FTSE 100 Is starting a brutal 2026 Bear Cycle.Last time we looked at FTSE 100 (UK100) was 3 months ago (September 19, see chart below) where we gave a strong buy signal at the bottom of its 7-month Channel Up, which methodically hit our 9700 Target:
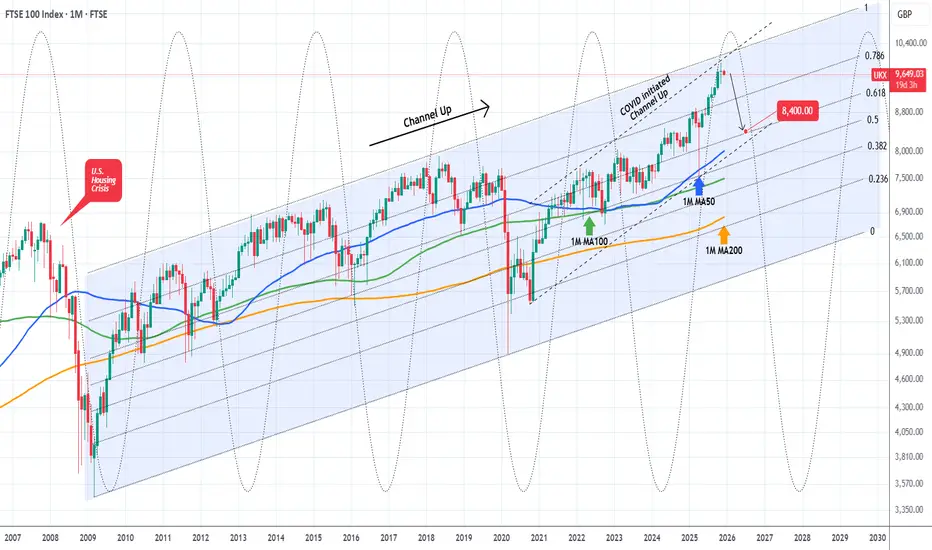
This time we are switching to the longest time-frame possible, the monthly (1M) as a key development has taken place. We switch our long-term stance to bearish as the index almost hit last month the top of its 16-year Channel Up, which started at the bottom of the 2008 U.S. Housing Crisis, and closed a very volatile November candle flat.
The use of the Sine Waves make the picture even clearer as they point out almost exactly every major Cycle Top since the 2008 Housing Crisis (5 such Cycle including that). And we are on one of them.
At the same time, the index also hit the top of the 5-year Channel Up that started shortly after the COVID crash bottom. Every correction (Bear Cycle/ Bearish Leg) within this pattern hit the 1M MA50 (blue trend-line) and rebounded. With the exception of the COVID flash crash which even broke below its 1M MA200 (orange trend-line), every other Bear Cycle since June 2012, hit the 1M MA100 (green trend-line) and rebounded.
As a result, we are expecting 2026 to be a strong Bear Cycle for FTSE, hitting at least its 1M MA50 at 8400, which is the bottom of the COVID Channel Up as well as the 0.618 Fibonacci retracement level of the post 2008 Channel Up.
---
** Please LIKE 👍, FOLLOW ✅, SHARE 🙌 and COMMENT ✍ if you enjoy this idea! Also share your ideas and charts in the comments section below! This is best way to keep it relevant, support us, keep the content here free and allow the idea to reach as many people as possible. **
---
💸💸💸💸💸💸
👇 👇 👇 👇 👇 👇
Market insights
UK100 Ready for 10,000? Bullish Swing Setup Explained🔹 UK100 (FTSE 100) Index — Swing Trade Opportunity Guide
Asset: UK100 Index
Market Type: Indices
Trade Style: Swing Trade
📊 Market Bias
Trend Direction: 🟢 Bullish
Bullish structure confirmed with a HULL Moving Average + Triangular Moving Average pullback, indicating trend continuation after healthy retracement.
🎯 Trade Plan
Strategy: Trend-following pullback continuation
Entry Plan:
👉 Any price level entry allowed
👉 Layered entry approach (Thief Layering Strategy)
Buy Limit Layer Zones:
• 9700
• 9750
• 9800
(You may increase or adjust layers based on your own risk plan)
This layered approach helps optimize average entry during volatility without chasing price.
🛑 Risk Management
Stop Loss: 9650
⚠️ Dear Ladies & Gentlemen (Thief OG’s),
This stop loss is not mandatory. Adjust SL according to your personal risk management and strategy rules.
🎯 Profit Plan
Primary Target: 10000
📌 Reasoning:
• Strong resistance zone
• Overbought conditions expected
• Potential trap & corrective reaction near highs
⚠️ Dear Ladies & Gentlemen (Thief OG’s),
This TP is for guidance only. Partial profits and manual exits are encouraged based on price action.
🔗 Related Markets to Watch (Correlation Guide)
💵 USD Index (DXY)
• Weakness in DXY often supports global equity indices
• Risk-on sentiment favors UK100 upside continuation
🇺🇸 US30 / NAS100
• Strong US indices usually provide positive sentiment spillover
• Bullish continuation in US equities supports FTSE strength
🛢️ Brent Crude (UKOIL)
• UK100 has heavy energy exposure
• Rising oil prices can boost FTSE components
🏦 GBP/USD
• Extreme GBP strength may cap FTSE upside
• Mild GBP weakness is generally supportive for UK exporters
🧠 Final Notes
✔ Trend-following setup
✔ Layered risk-controlled entries
✔ Structure-based SL
✔ Resistance-aware profit planning
📌 Trade smart. Manage risk. Let the trend pay.

UK100 - TIME TO KILLTeam, we are SHORTING UK100 at 9813-9816, stop loss at 9845
Target 1 at 9796-90
target 2 at 9786-75
Unemployment continue to hit the roof, increase higher than last month
inflation also above 3%
Economic dragging into recession, but market is FAKE pumping.
LETS GO


Price action Uk100 has already started showing cracks to the downside all im waiting for is clear break of structure
FTSE Bullish breakout supported at 9750
The FTSE remains in a bullish trend, with recent price action showing signs of a breakout within the broader uptrend.
Support Zone: 9750 – a key level from previous consolidation. Price is currently testing or approaching this level.
A bullish rebound from 9750 would confirm ongoing upside momentum, with potential targets at:
9900 – initial resistance
9930 – psychological and structural level
9960 – extended resistance on the longer-term chart
Bearish Scenario:
A confirmed break and daily close below 9750 would weaken the bullish outlook and suggest deeper downside risk toward:
9713 – minor support
9680 – stronger support and potential demand zone
Outlook:
Bullish bias remains intact while the FTSE holds above 9750. A sustained break below this level could shift momentum to the downside in the short term.
This communication is for informational purposes only and should not be viewed as any form of recommendation as to a particular course of action or as investment advice. It is not intended as an offer or solicitation for the purchase or sale of any financial instrument or as an official confirmation of any transaction. Opinions, estimates and assumptions expressed herein are made as of the date of this communication and are subject to change without notice. This communication has been prepared based upon information, including market prices, data and other information, believed to be reliable; however, Trade Nation does not warrant its completeness or accuracy. All market prices and market data contained in or attached to this communication are indicative and subject to change without notice.

FTSE 100 Support retest followed by a breakout The FTSE remains in a bullish trend, with recent price action showing signs of a breakout within the broader uptrend.
Support Zone: 9665 – a key level from previous consolidation. Price is currently testing or approaching this level.
A bullish rebound from 9665 would confirm ongoing upside momentum, with potential targets at:
9775 – initial resistance
9806 – psychological and structural level
9850 – extended resistance on the longer-term chart
Bearish Scenario:
A confirmed break and daily close below 9665 would weaken the bullish outlook and suggest deeper downside risk toward:
9630 – minor support
9598 – stronger support and potential demand zone
Outlook:
Bullish bias remains intact while the FTSE holds above 9665. A sustained break below this level could shift momentum to the downside in the short term.
This communication is for informational purposes only and should not be viewed as any form of recommendation as to a particular course of action or as investment advice. It is not intended as an offer or solicitation for the purchase or sale of any financial instrument or as an official confirmation of any transaction. Opinions, estimates and assumptions expressed herein are made as of the date of this communication and are subject to change without notice. This communication has been prepared based upon information, including market prices, data and other information, believed to be reliable; however, Trade Nation does not warrant its completeness or accuracy. All market prices and market data contained in or attached to this communication are indicative and subject to change without notice.

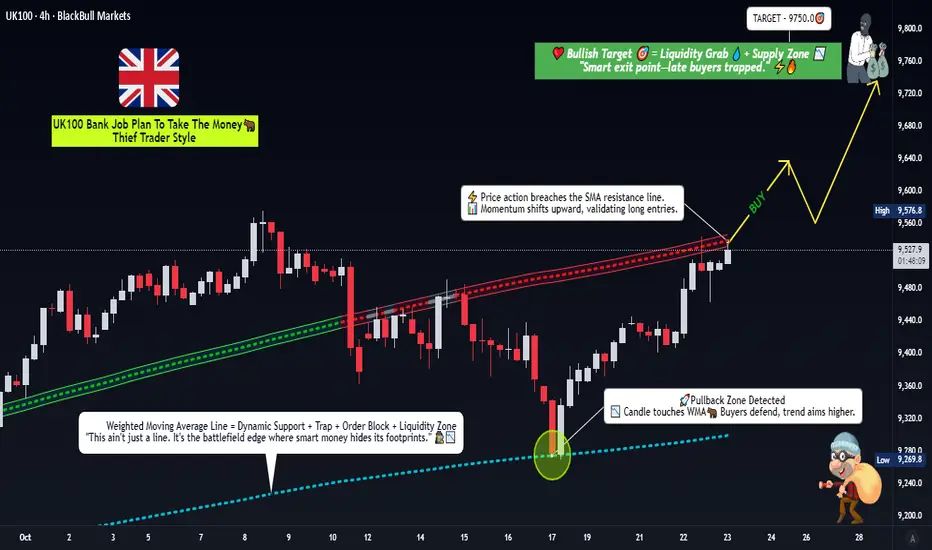
FTSE 100 Setup: Time to Go Long on This LSMA Breakout?🎯The UK100 "Capital Flow Heist" Blueprint 🚀 (Swing Trade Setup)
Buckle up, Thief Crew! 🏴☠️ We're plotting a bullish swing trade on the UK100, aiming to catch the next leg up. This isn't financial advice; it's a strategic blueprint for those who know how to handle the risk!
📈 The Master Plan (Analysis)
The strategy is simple: We're waiting for a confirmed bullish LSMA (Least Squares Moving Average) breakout to signal that the buyers are officially in control. This is all about timing the momentum shift and riding the wave.
⚙️ Trade Mechanics (The Heist Parameters)
Asset: UK100 (FTSE 100 Index)
Direction: Bullish
Style: Swing Trade
🎯 Entry Zone:
Action: Enter a LONG position on a confirmed candlestick close ABOVE the LSMA breakout level.
Level: 9560.0 (This is our launchpad! 🚀)
🛑 Stop Loss (The Escape Route):
Level: 9400.0
Thief's Note: This is my planned escape route. Place your SL where you are comfortable. Protect your capital like a pro! 💼
✅ Take Profit (The Loot Drop):
Level: 9750.0
Why Here? This zone represents a confluence of:
A strong historical resistance level.
Potential overbought conditions.
A classic bull trap area — so we grab our profits and exit stage left! 🎭
⚠️ Important Note from the OG: Dear Ladies & Gentlemen of the Thief Guild, I am not recommending you set only my SL or TP. It's your capital, your rules. You can make money, then take money at your own risk. Be a boss of your own trade. 😎
🔍 Related Pairs to Watch (The Intel)
To get a full picture, keep these assets on your radar. Movements here can influence our UK100 heist:
GBP/USD ( PYTH:GPUSD ): A stronger Pound can sometimes pressure the FTSE 100 (as many companies are multinational). Watch for inverse correlations.
US30 ($DOWI) / GER40 ( XETR:DAX ): Key global indices. Strong bullish moves in the US or German markets can often pull the UK market along for the ride.
EUR/GBP ( OANDA:EURGBP ): Economic dynamics between the UK and the Eurozone can cause capital flows in and out of UK assets.
✨ Final Community Message
“If you find value in my analysis, a 👍 and 🚀 boost is much appreciated — it helps me share more setups with the community!”
📜 Disclaimer & Hashtags
#UK100 #FTSE100 #TradingSetup #SwingTrading #TechnicalAnalysis #TradingView #CapitalFlow #ThiefStyle
FTSE uptrend continuation supported at 9665The FTSE remains in a bullish trend, with recent price action showing signs of a breakout within the broader uptrend.
Support Zone: 9665 – a key level from previous consolidation. Price is currently testing or approaching this level.
A bullish rebound from 9665 would confirm ongoing upside momentum, with potential targets at:
9775 – initial resistance
9806 – psychological and structural level
9850 – extended resistance on the longer-term chart
Bearish Scenario:
A confirmed break and daily close below 9665 would weaken the bullish outlook and suggest deeper downside risk toward:
9630 – minor support
9598 – stronger support and potential demand zone
Outlook:
Bullish bias remains intact while the FTSE holds above 9665. A sustained break below this level could shift momentum to the downside in the short term.
This communication is for informational purposes only and should not be viewed as any form of recommendation as to a particular course of action or as investment advice. It is not intended as an offer or solicitation for the purchase or sale of any financial instrument or as an official confirmation of any transaction. Opinions, estimates and assumptions expressed herein are made as of the date of this communication and are subject to change without notice. This communication has been prepared based upon information, including market prices, data and other information, believed to be reliable; however, Trade Nation does not warrant its completeness or accuracy. All market prices and market data contained in or attached to this communication are indicative and subject to change without notice.

FTSE 100 SHINES BRIGHT, WITHIN A WHISKER OF 10000 EPIC MILESTONEThe FTSE 100 index TVC:UKX is on track for one of its strongest years in decades in the year 2025, delivering a total return of about 18% year‑to‑date and trading just below the round and psychologically important 10,000‑point level by December, 2025.
This rally has been powered by a mix of miners, financials, and select growth names, with a handful of stocks delivering triple‑digit returns and heavily influencing the index.
2025 returns and 10,000 milestone
The FTSE 100 has returned roughly 20% in 2025 including dividends, making it the seventh‑best year on record and the strongest since the post‑financial‑crisis rebound.
By the middle of November, 2025 the index had climbed to around 9,930 points, described as “within a whisker” of 10,000 , and had outperformed major US indices (like S&P 500 SP:SPX and Dow Jones Industrial Average TVC:DJI ) over the year.
Forward‑looking models cited by analysts place many year‑end projections in the mid‑9,000s, underlining that 10,000 is more a timing than a feasibility question if earnings strength persists.
From a structural standpoint, supportive global policy, reasonable valuations, and strong contributions from commodities and financials have underpinned the surge, while the high dividend yield continues to attract both domestic and international investors. The index’s heavy overseas revenue exposure also means that periods of sterling softness have translated into stronger reported profits in 2025, magnifying gains.
Top 5 performers in 2025
Different datasets cut “top” slightly differently, but across major sources the standout FTSE 100 winners in 2025 cluster around a similar, defence-related, group of stocks:
Fresnillo LSE:FRES - precious‑metals miner with a total return around 345%, benefiting from a powerful rally in gold and silver prices and improved operational performance.
Technically saying, Fresnillo stock shows 7 consecutive Bull quarters in a row, as epic breakthroughs of 200-month SMA and multi-year highs has recently occured.
Either precious metals shine bright in 2025, their year-to-date returns definitely are not about "quadruppling in price".
This is why Fresnillo stock feels like 'a repeat mode' of 'MSTR v. 2024'... isn't it.
Airtel Africa LSE:AAF – telecoms and mobile money group with about 171% return, driven by rapid earnings growth, financial inclusion trends, and rerating from previously depressed valuations.
Technically saying, Airtel Africa stock shows 4 Bull consecutive quarters in a row, as epic breakthrough of multi-year highs has recently occured.
Babcock International LSE:BAB – defence and engineering group described as the best‑performing FTSE name earlier in the year, up roughly two‑thirds by May and supported by defence spending tailwinds and balance‑sheet repair.
Technically saying, Babcock International stock shows its best ever calendar year, with nearly 140% YTD return in the 2025.
Rolls-Royce Holdings LSE:RR. - one more defence and engineering group that develops and delivers complex power and propulsion solutions for safety-critical applications in the air, at sea and on land.
Technically saying, Rolls-Royce Holdings stock has nearly doubled in price in 2025, and printed more than 10x over the past 3 years.
Antofagasta LSE:ANTO - is a copper mining group with significant by-product production and interests in transportation. The Group creates value for its stakeholders through the discovery, development and operation of copper mines.
Antofagasta stock has also nearly doubled in price in 2025, following multi-year Bull vibe.
A broader “next tier” that often appears in top‑15 lists includes Next and Games Workshop each returning more than 50% and highlighting the role of retail, niche consumer brands, and copper in the 2025 upswing.
These stocks’ outperformance reflects a combination of cyclical leverage to commodities and defence, structural growth (mobile money, gaming IP), and market rerating from previously low multiples. Their weight in the index means they have had an outsized effect on the FTSE 100’s approach to 10,000.
Key drivers: 2026 fundamentals
Into 2026, large banks and brokers broadly expect the FTSE 100 to “grind higher” rather than explode upwards, with central scenarios pointing to moderate index gains supported by improving earnings and still‑reasonable valuations.
One major house outlines a base case of steady profit growth and a wider spread of contributors, moving away from the narrow group of 2025 winners, while an upside scenario sees the index potentially reaching around 10,800 by December 2026 if global growth accelerates, financial conditions ease, commodity prices remain firm, and sterling weakens.
Fundamentally, several factors look supportive: gradual interest‑rate cuts would relieve pressure on rate‑sensitive domestic sectors; 75–80% of FTSE 100 revenues are generated abroad, so a softer pound would lift reported earnings; and multi‑year capex programmes in energy and defence, such as SSE’s planned £33 billion investment and BAE Systems’ large export contracts, provide visible revenue pipelines.
Offsetting this, downside scenarios focus on risks of a global slowdown, stubborn inflation keeping rates elevated, falling commodity prices, and a stronger pound, which could pull the index back toward the low‑7,000s.
Technical picture into 2026
Technically, analysts describe the FTSE 100 in a mature but still constructive uptrend, with long‑term charts showing a breakout above prior resistance zones in the mid‑9,000s and potential for an extension toward roughly 10,500–11,000 if momentum is sustained.
One widely cited framework highlights an expanding wedge pattern, with 9,500 as a key breakout area and 7,000 as a major historical support zone that would likely attract buyers on any deep correction.
As the index hovers just below the 10,000 mark, that level functions as both psychological resistance and a potential springboard: a decisive weekly close above it, supported by rising volume and breadth beyond miners and financials, would strengthen the case for a attempt of 2026 bull leg.
Short‑ to medium‑term, the risk is that the 2025 rally has already priced in much of the near‑term earnings recovery, making the index more vulnerable to disappointments or sharp commodity pullbacks.
However, history suggests that once (and if) major indices convincingly clear big round numbers, those levels often become support rather than ceilings, especially when underpinned by improving macro data and ongoing dividend appeal.

FTSE oversold rally support at 9600The FTSE remains in a bullish trend, with recent price action showing signs of a corrective pullback within the broader uptrend.
Support Zone: 9600 – a key level from previous consolidation. Price is currently testing or approaching this level.
A bullish rebound from 9600 would confirm ongoing upside momentum, with potential targets at:
9734 – initial resistance
9775 – psychological and structural level
9806 – extended resistance on the longer-term chart
Bearish Scenario:
A confirmed break and daily close below 9600 would weaken the bullish outlook and suggest deeper downside risk toward:
9570 – minor support
9540 – stronger support and potential demand zone
Outlook:
Bullish bias remains intact while the FTSE holds above 9600. A sustained break below this level could shift momentum to the downside in the short term.
This communication is for informational purposes only and should not be viewed as any form of recommendation as to a particular course of action or as investment advice. It is not intended as an offer or solicitation for the purchase or sale of any financial instrument or as an official confirmation of any transaction. Opinions, estimates and assumptions expressed herein are made as of the date of this communication and are subject to change without notice. This communication has been prepared based upon information, including market prices, data and other information, believed to be reliable; however, Trade Nation does not warrant its completeness or accuracy. All market prices and market data contained in or attached to this communication are indicative and subject to change without notice.


FTSE100 support retest at 9655The FTSE remains in a bullish trend, with recent price action showing signs of a breakout within the broader uptrend.
Support Zone: 9655 – a key level from previous consolidation. Price is currently testing or approaching this level.
A bullish rebound from 9655 would confirm ongoing upside momentum, with potential targets at:
9765 – initial resistance
9800 – psychological and structural level
9885 – extended resistance on the longer-term chart
Bearish Scenario:
A confirmed break and daily close below 9655 would weaken the bullish outlook and suggest deeper downside risk toward:
9625 – minor support
9595 – stronger support and potential demand zone
Outlook:
Bullish bias remains intact while the FTSE holds above 9655. A sustained break below this level could shift momentum to the downside in the short term.
This communication is for informational purposes only and should not be viewed as any form of recommendation as to a particular course of action or as investment advice. It is not intended as an offer or solicitation for the purchase or sale of any financial instrument or as an official confirmation of any transaction. Opinions, estimates and assumptions expressed herein are made as of the date of this communication and are subject to change without notice. This communication has been prepared based upon information, including market prices, data and other information, believed to be reliable; however, Trade Nation does not warrant its completeness or accuracy. All market prices and market data contained in or attached to this communication are indicative and subject to change without notice.

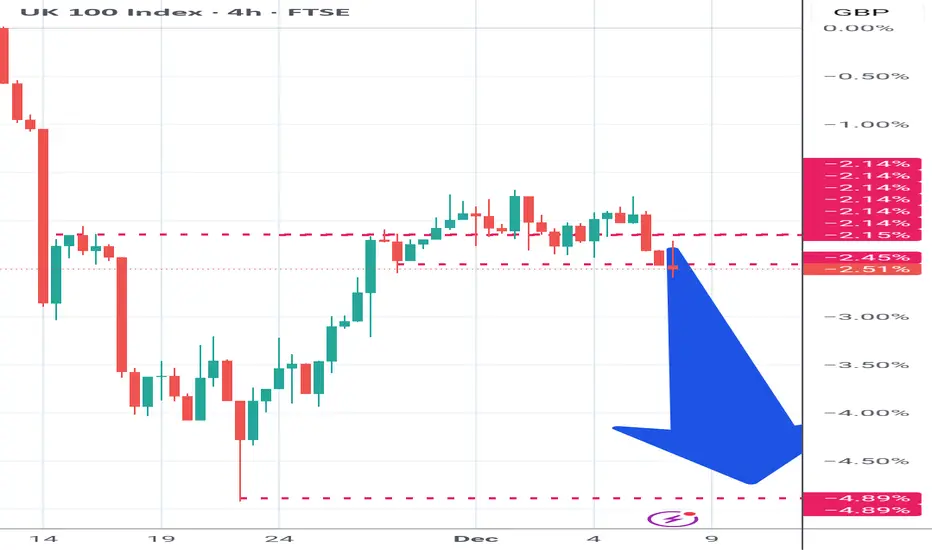
FTSE This chart shows a clear change.
The upside swing has lost the 90 degree angle.
The bearish swing was volatile.
The bullish swing was, until it wasnt.
Clear 4hr change in delivery.
Momentum lost .


FTSE sideways consolidation below 9765 resistanceThe FTSE remains in a bullish trend, with recent price action showing signs of a breakout within the broader uptrend.
Support Zone: 9655 – a key level from previous consolidation. Price is currently testing or approaching this level.
A bullish rebound from 9655 would confirm ongoing upside momentum, with potential targets at:
9765 – initial resistance
9800 – psychological and structural level
9885 – extended resistance on the longer-term chart
Bearish Scenario:
A confirmed break and daily close below 9655 would weaken the bullish outlook and suggest deeper downside risk toward:
9625 – minor support
9595 – stronger support and potential demand zone
Outlook:
Bullish bias remains intact while the FTSE holds above 9655. A sustained break below this level could shift momentum to the downside in the short term.
This communication is for informational purposes only and should not be viewed as any form of recommendation as to a particular course of action or as investment advice. It is not intended as an offer or solicitation for the purchase or sale of any financial instrument or as an official confirmation of any transaction. Opinions, estimates and assumptions expressed herein are made as of the date of this communication and are subject to change without notice. This communication has been prepared based upon information, including market prices, data and other information, believed to be reliable; however, Trade Nation does not warrant its completeness or accuracy. All market prices and market data contained in or attached to this communication are indicative and subject to change without notice.

FTSE100 uptrend continuation supported at 9655The FTSE remains in a bullish trend, with recent price action showing signs of a breakout within the broader uptrend.
Support Zone: 9655 – a key level from previous consolidation. Price is currently testing or approaching this level.
A bullish rebound from 9655 would confirm ongoing upside momentum, with potential targets at:
9765 – initial resistance
9800 – psychological and structural level
9885 – extended resistance on the longer-term chart
Bearish Scenario:
A confirmed break and daily close below 9655 would weaken the bullish outlook and suggest deeper downside risk toward:
9625 – minor support
9595 – stronger support and potential demand zone
Outlook:
Bullish bias remains intact while the FTSE holds above 9655. A sustained break below this level could shift momentum to the downside in the short term.
This communication is for informational purposes only and should not be viewed as any form of recommendation as to a particular course of action or as investment advice. It is not intended as an offer or solicitation for the purchase or sale of any financial instrument or as an official confirmation of any transaction. Opinions, estimates and assumptions expressed herein are made as of the date of this communication and are subject to change without notice. This communication has been prepared based upon information, including market prices, data and other information, believed to be reliable; however, Trade Nation does not warrant its completeness or accuracy. All market prices and market data contained in or attached to this communication are indicative and subject to change without notice.

FTSE bullish breakout supported at 9655The FTSE remains in a bullish trend, with recent price action showing signs of a breakout within the broader uptrend.
Support Zone: 9655 – a key level from previous consolidation. Price is currently testing or approaching this level.
A bullish rebound from 9655 would confirm ongoing upside momentum, with potential targets at:
9765 – initial resistance
9800 – psychological and structural level
9885 – extended resistance on the longer-term chart
Bearish Scenario:
A confirmed break and daily close below 9655 would weaken the bullish outlook and suggest deeper downside risk toward:
9625 – minor support
9595 – stronger support and potential demand zone
Outlook:
Bullish bias remains intact while the FTSE holds above 9655. A sustained break below this level could shift momentum to the downside in the short term.
This communication is for informational purposes only and should not be viewed as any form of recommendation as to a particular course of action or as investment advice. It is not intended as an offer or solicitation for the purchase or sale of any financial instrument or as an official confirmation of any transaction. Opinions, estimates and assumptions expressed herein are made as of the date of this communication and are subject to change without notice. This communication has been prepared based upon information, including market prices, data and other information, believed to be reliable; however, Trade Nation does not warrant its completeness or accuracy. All market prices and market data contained in or attached to this communication are indicative and subject to change without notice.

FTSE resistance retest at 9715The FTSE remains in a bullish trend, with recent price action showing signs of a breakout within the broader uptrend.
Support Zone: 9510 – a key level from previous consolidation. Price is currently testing or approaching this level.
A bullish rebound from 9510 would confirm ongoing upside momentum, with potential targets at:
9715 – initial resistance
9760 – psychological and structural level
9800 – extended resistance on the longer-term chart
Bearish Scenario:
A confirmed break and daily close below 9510 would weaken the bullish outlook and suggest deeper downside risk toward:
9477 – minor support
9430 – stronger support and potential demand zone
Outlook:
Bullish bias remains intact while the FTSE holds above 9510. A sustained break below this level could shift momentum to the downside in the short term.
This communication is for informational purposes only and should not be viewed as any form of recommendation as to a particular course of action or as investment advice. It is not intended as an offer or solicitation for the purchase or sale of any financial instrument or as an official confirmation of any transaction. Opinions, estimates and assumptions expressed herein are made as of the date of this communication and are subject to change without notice. This communication has been prepared based upon information, including market prices, data and other information, believed to be reliable; however, Trade Nation does not warrant its completeness or accuracy. All market prices and market data contained in or attached to this communication are indicative and subject to change without notice.

FTSE UK100 Daily Trade SetupsIn this update we review the recent price action in the FTSE UK100 and identify the next high-probability trade opportunity and price objectives to target. To review today's video analysis clcik here!

UK 100 Index – Psychological 10000 level Within Sight!As the dust settles on the UK Chancellor’s Autumn budget that was released on Wednesday it’s potentially a good time to assess the current backdrop for the UK 100 moving into early December.
First things first, Wednesday’s budget didn’t lead to an immediate rush to sell UK assets, which most notably was the case in the Liz Truss era and was a possible concern in the lead up to this release. Government bond markets took the series of tax rises and spending announcements in their stride, GBPUSD squeezed out some weak shorts to post a high of 1.3268 on Thursday, and the UK 100 followed it to print a 2 week high of 9715 before running into some profit taking on a move which had seen it rally from a low of 9425 posted on November 21st.
Looking forward, the focus for 100 UK traders may now shift to the interest rate decisions of the Federal Reserve (Fed) on December 10th and the Bank of England (BoE) on December 18th. The Fed rate decision could be important for two reasons, the first is that it may dictate the path of general risk sentiment into year end and secondly, with the UK 100 index dominated by multi-national companies generating around 70% of their revenue outside of the UK, any Fed move could directly impact their earnings outlook for early next year.
In terms of the BoE, while the Autumn budget wasn’t perhaps perceived by economists to be as dis-inflationary as it could have been, it may have done enough to shift the voting at the December meeting towards another 25bps (0.25%) cut. Certainly, the market thinks this to be the case with around 90% chance of a cut currently priced, although there could still room for a surprise ‘no change’ or disappointment on the speed of future rate cuts to start 2026.
While UK 100 price volatility may have reduced over this US Thanksgiving holiday period into the end of November, it could be very different story during the first 3 weeks of December.
Technical Outlook: How Much Further Can the Current Rally Go?
Since posting the 9425 November 21st low, the UK 100 index has rallied just over 3%, with immediate resistance levels giving way. This now includes closes above 9692, a level equal to the Bollinger mid‑average.
Traders may see this as the start of a further phase of price strength, but it remains essential to monitor both immediate support and resistance levels to gauge the next directional themes.
While a close above mid‑average resistance at 9692 could be interpreted as a signal of further upside potential ahead, there is no guarantee of this, and near‑term support levels may prove just as important in shaping price action over the coming days.
Potential Resistance Levels:
After the close above the Bollinger mid-average resistance at 9492 the focus could now be on 9742 as the next resistance. This level is equal to the 61.8% Fibonacci retracement
A successful close above 9742 is required to suggest further attempts at price strength, which could then shift focus towards potential tests of 9940, the November 12th all-time high.
Potential Support Levels:
After the latest price strength, initial support may now stand at 9605, the 38.2% retracement of the November rally. While a pattern of higher highs and higher lows is still intact, closing breaks below 9605 could lead toward further short-term weakness.
If the 9605 retracement gives way on a closing basis, risks could then shift toward deeper declines, opening scope for tests of 9537, which is the 61.8% retracement, possibly even 9425, the November 21st session low.
The material provided here has not been prepared accordance with legal requirements designed to promote the independence of investment research and as such is considered to be a marketing communication. Whilst it is not subject to any prohibition on dealing ahead of the dissemination of investment research, we will not seek to take any advantage before providing it to our clients.
Pepperstone doesn’t represent that the material provided here is accurate, current or complete, and therefore shouldn’t be relied upon as such. The information, whether from a third party or not, isn’t to be considered as a recommendation; or an offer to buy or sell; or the solicitation of an offer to buy or sell any security, financial product or instrument; or to participate in any particular trading strategy. It does not take into account readers’ financial situation or investment objectives. We advise any readers of this content to seek their own advice. Without the approval of Pepperstone, reproduction or redistribution of this information isn’t permitted.

FTSE100 post-Budget rally: Inverse Head & Shoulders eyes 9800Chancellor Reeves unveiled tax rises worth £26 billion annually by 2029-30 but showed fiscal discipline by committing to reduce government spending as a share of GDP each year and more than doubling the fiscal headroom buffer to £21.7 billion, reassuring bond markets still scarred by the Liz Truss mini-budget crisis.
With gilt yields falling, sterling at its best level since October, and a Bank of England rate cut expected in December, the macro backdrop supports further upside for Footsie, though sticky inflation and OBR growth downgrades remain headwinds.
Key drivers:
UK Budget introduces tax rises totalling £26bn annually by 2029-30 via threshold freezes, mansion tax, and dividend levies, but spending will decline as a share of GDP each year, calming government borrowing concerns and sending gilt yields lower.
Fiscal headroom buffer more than doubled to £21.7bn (from £9.9bn last year), giving bond vigilantes confidence that the debt trajectory is sustainable.
Sterling rallied above 1.32 towards 1.33 on lower borrowing risks, while FTSE 100 gained, led by financials.
Bank of England expected to cut rates 25bp in December, supporting equities, though sticky inflation and OBR growth downgrades are headwinds.
Technical setup : inverse head and shoulders with neckline/support at 9,630 (38.2% Fib), measured move and Fib confluence target 9,800 (between 61.8% and 78.6% retracement).
Trade idea : Entry on pullback to 38.2% Fib (9,630), stop below previous low (9,434), target 9,800, for 2:1+ risk-to-reward.
Trading the FTSE bounce? Drop your setups in the comments and follow for more high-action technical and macro trade ideas.
This content is not directed to residents of the EU or UK. Any opinions, news, research, analyses, prices or other information contained on this website is provided as general market commentary and does not constitute investment advice. ThinkMarkets will not accept liability for any loss or damage including, without limitation, to any loss of profit which may arise directly or indirectly from use of or reliance on such information.
