US30 H1 | Bullish ContinuationMomentum: Bullish
Price is currently above the ichimoku cloud.
Buy entry: 48,426.11
- Overlap support
- 38.2% Fib retracement
Stop Loss: 48,229.27
- Overlap support
Take Profit: 48,687.99
- Swing high resistance
- 100% Fib projection
High Risk Investment Warning
Stratos Markets Limited (tradu.c

US30 H1 | Bullish Bounce Off Pullback SupportMomentum: Bullish
Price is currently above the ichimoku cloud.
Buy entry: 48,231.75
- Pullback support
- 61.8% Fib retracement
- 100% Fib projection
Stop Loss: 48,105.22
- Swing low support
Take Profit: 48,389.14
- Swing high resistance
High Risk Investment Warning
Stratos Markets Limited (trad

US30 Price consolidation bearish momentumUS30 Dow Jones price action within a rising channel structure. The index has respected the ascending trendline multiple times, confirming an overall bullish trend in recent weeks.
After reaching a local high near the upper boundary of the channel, price began to show signs of weakness and consolida

US30 Approaches Key Support at 48,400!Hey Traders,
In the coming week, we are monitoring US30 (Dow Jones) for a potential buying opportunity around the 48,400 zone.
The index remains in a well-defined uptrend and is currently undergoing a healthy corrective pullback. Price is now approaching a key trend support and support/resistance

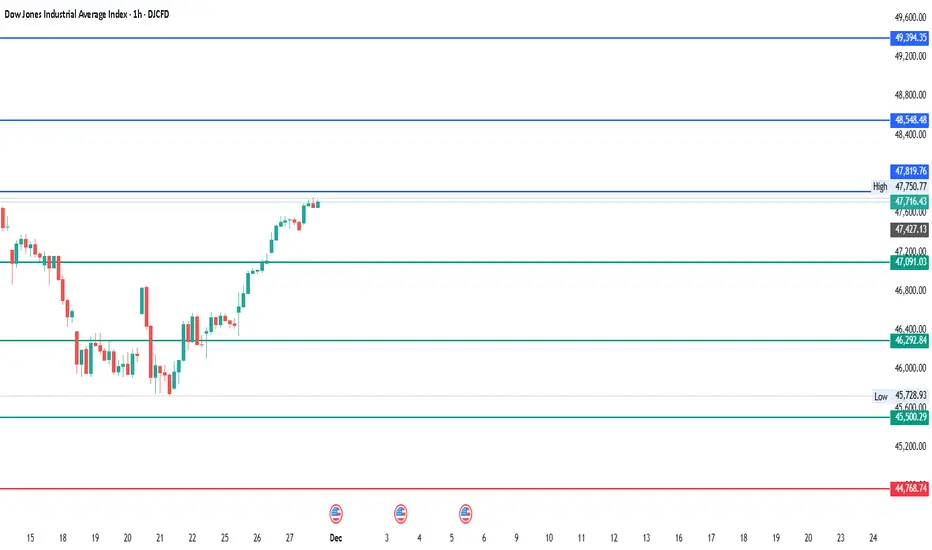
#DJI - 3,000 Points on Cards?Date: 01-12-2025
DJI - Current Price: $47,716
Pivot Point: $46,292.84 Support: $45,500.29 Resistance: $47,091.03
Upside Levels:
L1: $47,819.76 L2: $48,548.48 L3: $49,394.35 L4: $50,240.21
Downside Levels:
L1: $44,768.74
DJIA | ExpansionMajor timeframes are aligned and bullish, and the recent H4 countertrend has been broken with price significantly above the VAH of the correction.
Bias: 🟢 | H4 Close > 48,398.60
Path: 48791.21 → 49089.91 → 49187.75 → 49315.00

US30 Trade Set Up Dec 22 2025Price is in bullish structure, has swept Asia lows and London highs and inverted a 30m bearish FVG so i will want to see a pullback into it to then look for 1m-5m IFVG/CISD to target PDH


US30 : Bullish Continuation ScenarioUS30 Holding Rising Channel Support – Bullish Continuation Scenario
US30 remains in a well-defined ascending pattern, respecting higher highs and higher lows on the intraday structure. After rejecting the upper boundary, price pulled back in a corrective move and is now finding support near the lo

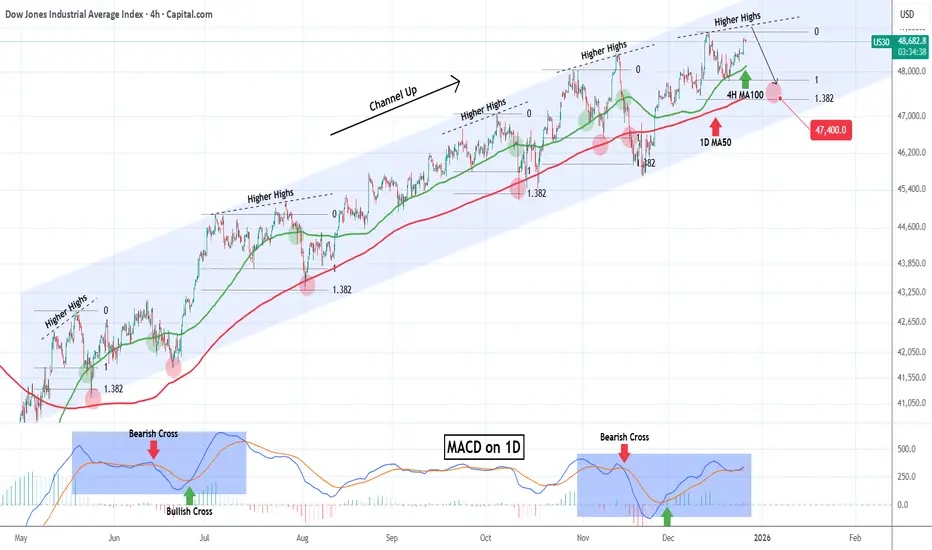
DOW JONES headed towards a rejection.Dow Jones (DJI) has been trading within a nearly 8-month Channel Up and is close to its All Time High (ATH) after rebounding last week on its 4H MA100 (green trend-line).
This pattern is cyclical and every time the latter support broke after a medium-term rally from its 1D MA50 (blue trend-line), t
See all ideas
Displays a symbol's value movements over previous years to identify recurring trends.
Frequently Asked Questions
Dow Jones Industrial Average Index reached its highest quote on Dec 12, 2025 — 48,868.00 USD. See more data on the Dow Jones Industrial Average Index chart.
The lowest ever quote of Dow Jones Industrial Average Index is 26,064.10 USD. It was reached on Oct 30, 2020. See more data on the Dow Jones Industrial Average Index chart.
Dow Jones Industrial Average Index is just a number that lets you track performance of the instruments comprising the index, so you can't invest in it directly. But you can buy Dow Jones Industrial Average Index futures or funds or invest in its components.