US30 Surprises in Store: I've got two traders telling me there's more of a bullish move to come. I already agreed with one of them earlier that the potential is there for that.
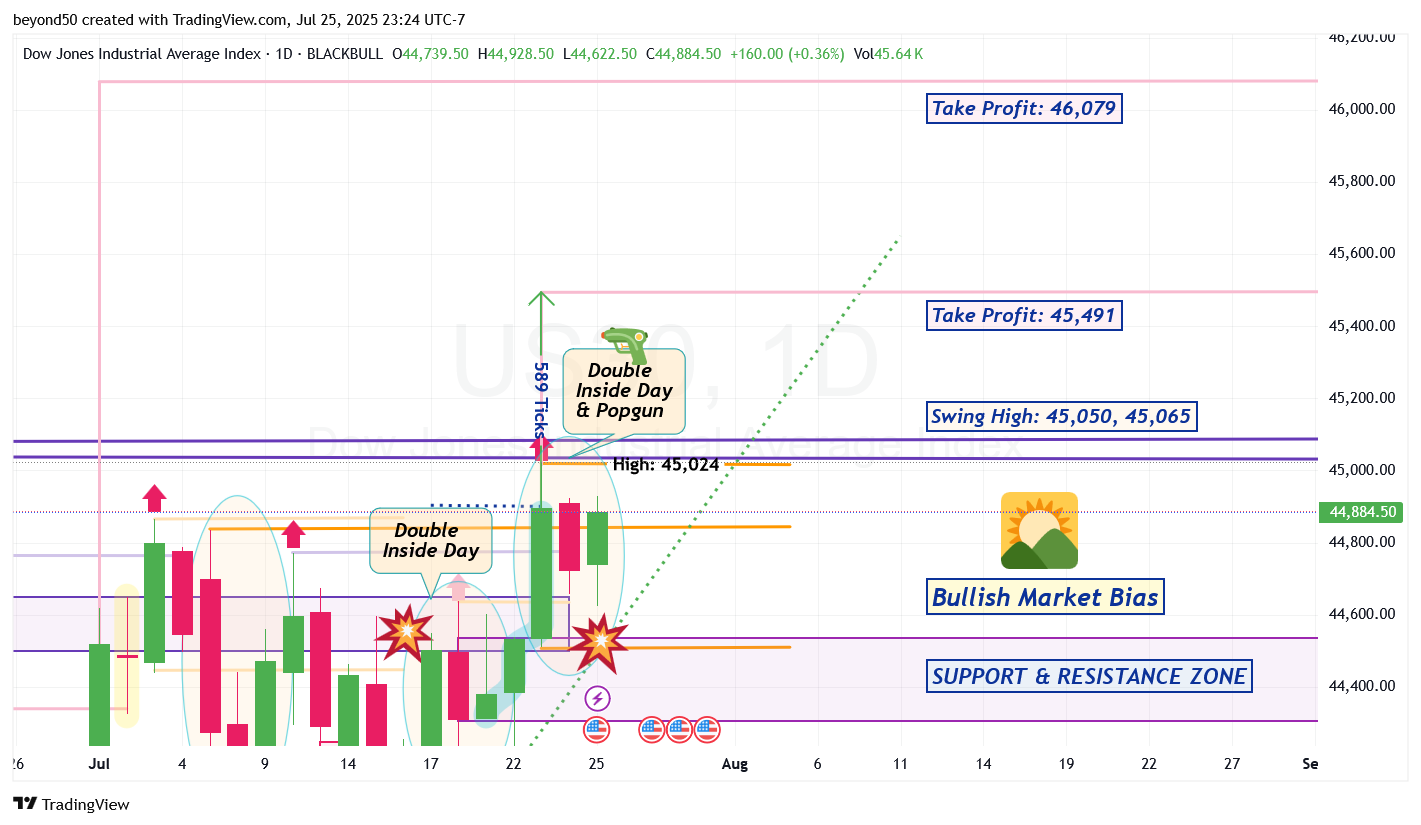
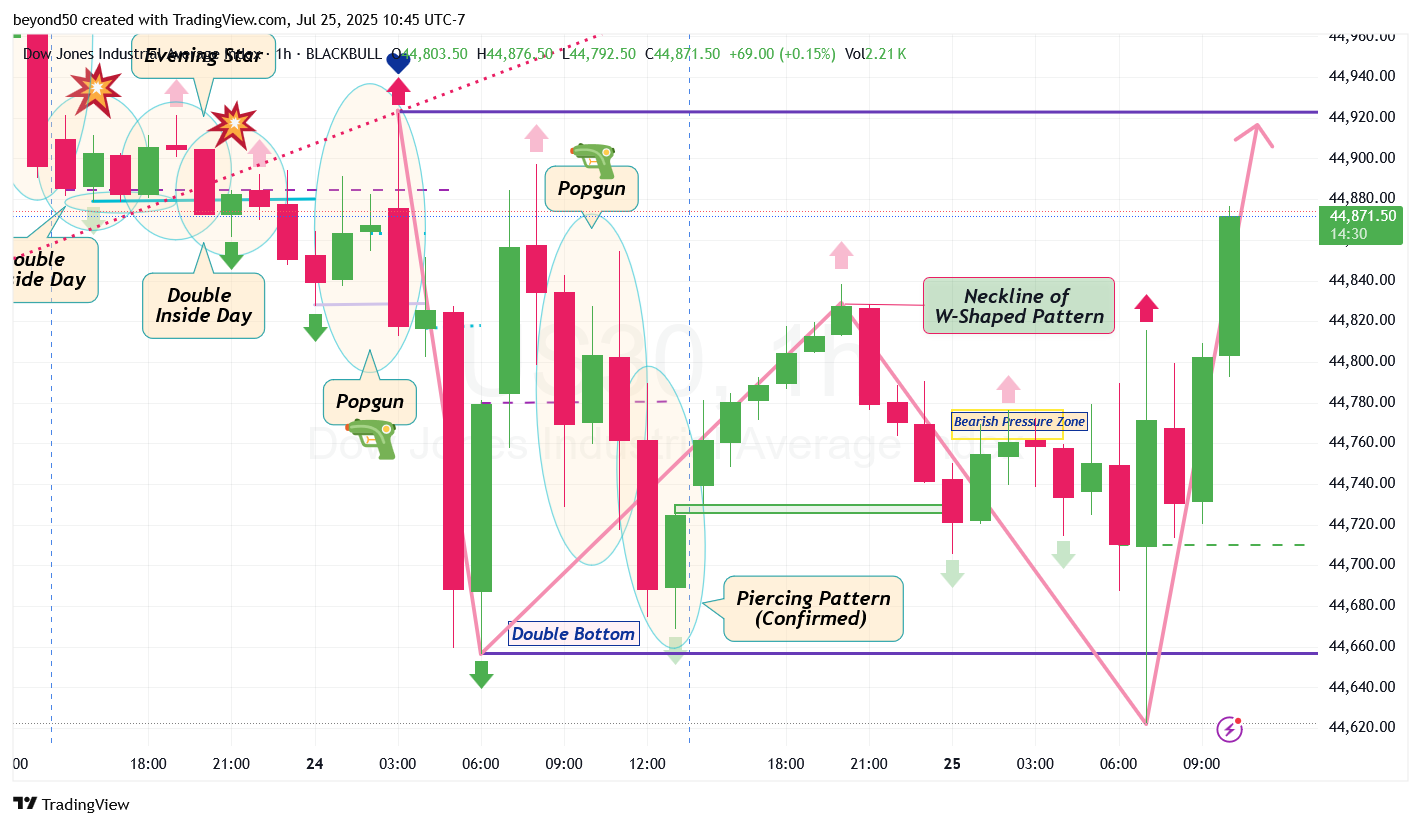
*An Alternative Scenario: Here's some surprising moves, based on the Daily Chart that can take a week or more to play out: - The last three candles printed out a Double Inside Day, which means that a very very BIG move is coming, especially when it shows up on the Daily timeframe.
- I don't use the Fibonacci, but take measured moves instead, which also works great. Three candles (highlighted in blue) within a bull run are 589 ticks tall as a measured move. When extended out (shown as a green arrow), the Take Profit Projection would be at 45,491. There are two Swing Highs on the way up. With a breach of each Swing High, more moves to the upside.
A secondary Take Profit level is at 46,079.
- A Popgun pattern showed up with the last three candles too, which means more complex consolidation with three major swings that move like a See-Saw to come.
- And, if the bulls rally towards the Take Profit level of 45,491, a bearish drop down from there to the S&R Zone below (that starts at 44,533) would be 950 points (ticks), completing the M-shaped pattern. Along the way down , the bears would also cross the Bullish Trendline (in green dotted line) to its right side, flipping the market bias from bullish to bearish.
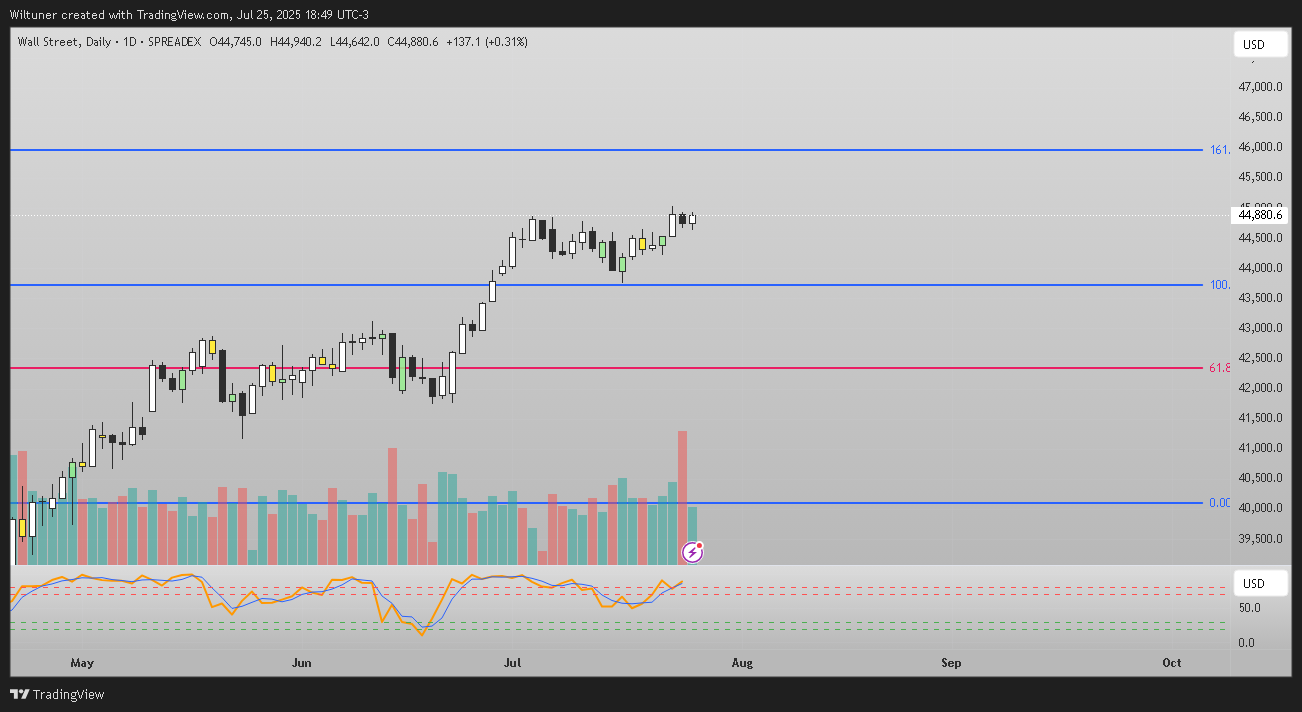
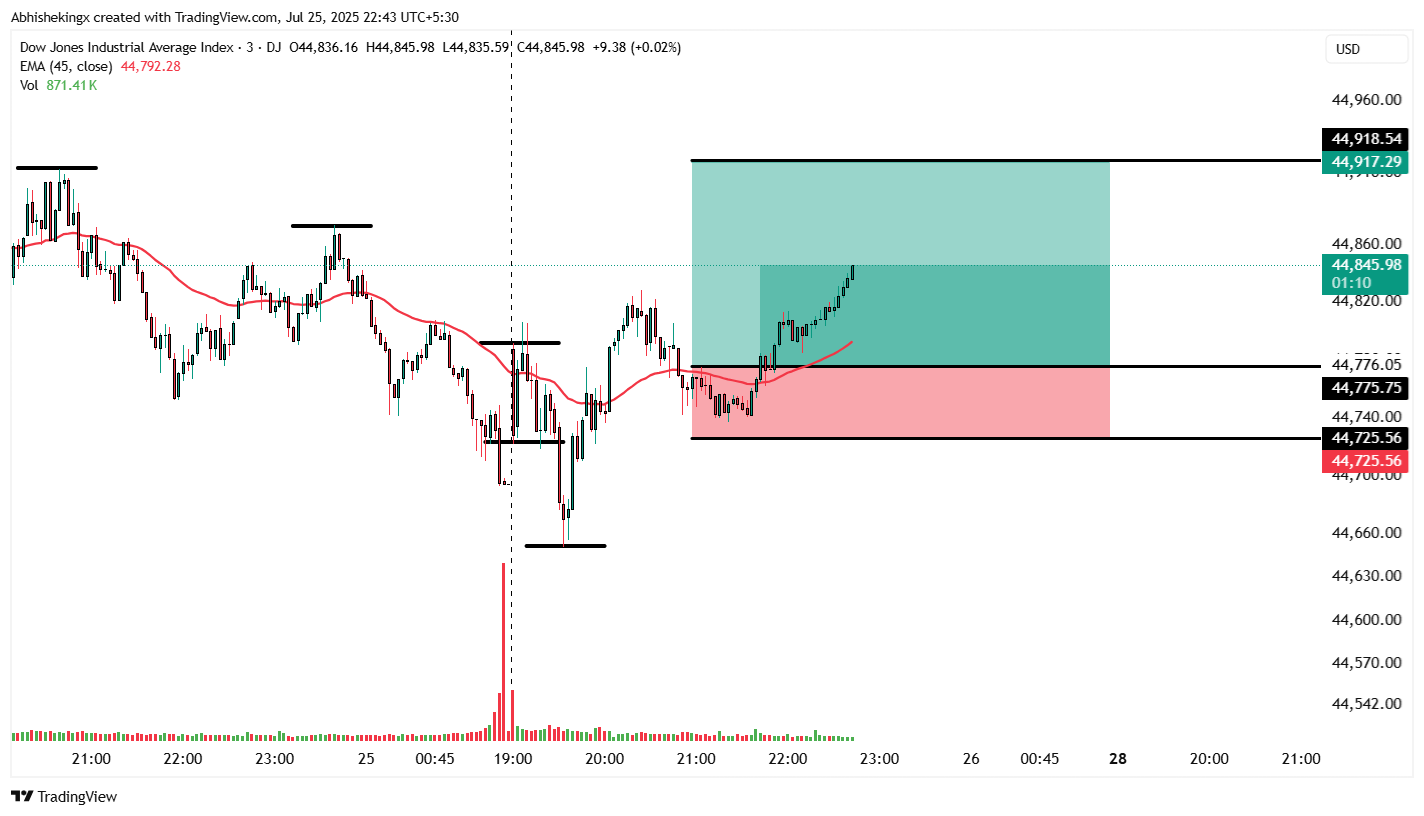
DJI I respect your take beyond50 on the forming “M” pattern and the potential 898-point drop, but based on my chart (see below), the technical outlook still supports a bullish trend continuation.
Price remains above the 44,000 level (100% Fibonacci extension), acting as key support. There's no confirmed break of the trendline, nor a validated “M” pattern just yet. In fact, current price action appears more like a consolidation before pushing toward the 46,000 target (161.8% Fibo extension).
The structure is still bullish as long as the 44,000 zone holds. Reversal patterns require confirmation with strong momentum and so far, we’re seeing hesitation, not weakness, with rising buyer volume.
📈 Still watching closely, but for now, I maintain a bullish bias.
US30 Want to See a Funny Video? Check out Trump with Jerome Powell wearing construction hats under the Federal Reserve building.
Trump has called Powell a "loser" in the past, so watch Powell's expressions in the video making him look like a fool: youtube.com/watch?v=4RwGS8jEic8
Just so you know some history, the Federal Reserve is not even part of the U.S. federal government. It's really part of an international banking cabal system under the Bank of International Settlements (BIS) in Europe that creates debt-based economies. The Federal Reserve has never been audited, only self-audited. They are a criminal bank organization that Trump wants either removed or restructured.
So all those trillions of dollars owed by the U.S. was by the Federal Reserve's design and never meant to be paid back. Trump the Sheriff is in town. He's after Powell and his banking minions.
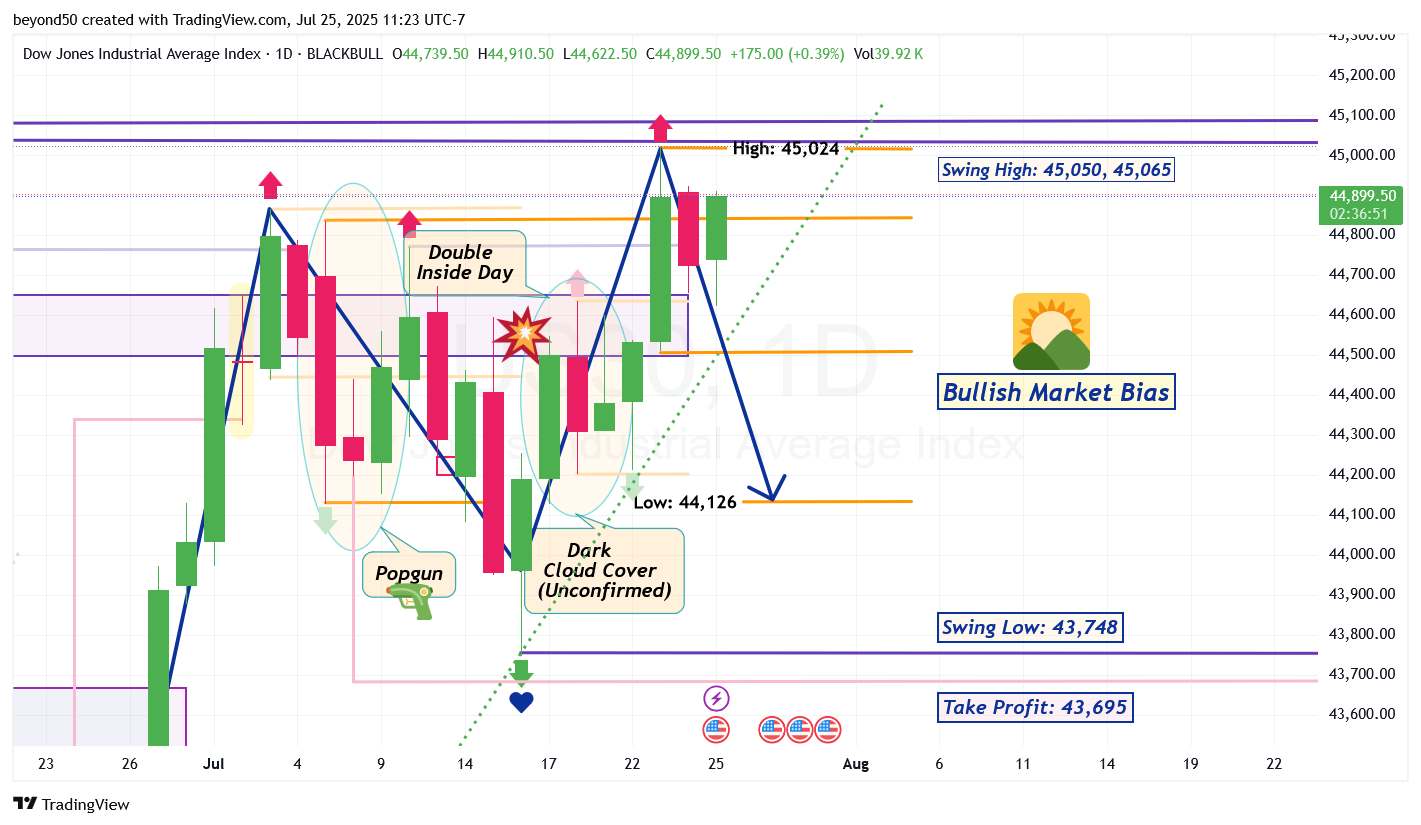
US30 BIG Drop Coming: 898 Points! On the Daily, price action is in consolidation to move towards the right of the Bullish Trendline (in green dotted line) to flip the market bias from bullish to bearish.
Look at the textbook-perfect looking, giant "M" forming. The coming last and 4th leg of the "M" is typically a very long, bearish trend AND price action has been moving within a very tall Inside Day for no true direction. Breakout from the pattern was rejected earlier this week from the pattern's high at 45,025, but more likely at the pattern's low of 44,126 (shown as orange lines).