Bitcoin's Moving Averages (Common, Weekly)In a previous post, I introduced moving averages and common periods measured using daily closes. Now we look at the same number of periods measured but each period is one week instead of one day.
Using weekly closes, I have overlaid the SMAs and EMAs of commonly used sets. The same color represents the same set of periods while the brighter color is the EMA and the duller color is the SMA.
10 black
20 orange
50 red
100 pink
200 purple
500 dark blue
(not yet shown)
1000 light blue
1500 light green
2000 black
...
Next we will look at the other sets of periods previously using weekly data instead of daily.
BLX trade ideas

BTC Simple AnalysisRed line is EMA300.
we bounced on it.
EMA300 is acting as the strongest support right now.
if we cross down this red line we can go 2000ish.
if we bounce multiple times on it, it should mean we bottomed, it can be a reversal bullish sign.
Happy Tr4Ding & Stay Safe !

BITCOIN HALVING CYCLESBy reading the history through chart, we can capture a pattern. One of them is BITCOIN's HALVING. In this chart we can see a repetition of pattern and it will be useful for next action if we want to buy BITCOIN especially in HALVING moment. From this pattern, can be interpreted the possibility that BITCOIN will make All time high.

Bitcoin halving analysisMany Traders have attempted to to compare previous halving cycles with the current Halving cycle coming up in April this year.
considering that there as only been three previous halvings - the first one back in 2012 which does not give us any very useful data or information, so then there’s really only two Halvings that give us any useful information, the last one in 2020, and the one before that.
The last having had a significant pullback prior to it occurring. however, the largest part of this dump was actually caused by the Covid worldwide crisis.
Therefore, if we look at where bitcoin’s price looked like it would’ve bottomed out it, had the crisis not occurred, We can see that the bottom happened around five months before the halving.
Therefore this shows that this cycle is completely different as we have not seen anything like that happened so far.
could it be that we have already seen all of the selling/consolidation happening over the last few months as bitcoin has stepped its way up. This is very different what happened in 2020 with so very strong parabolic rise, and then a big sell-off that big parabolic rise has not really happened. This time it’s been a much more of a steady upward growth.
Therefore people might be in for a shock when bitcoin just continues to go up. maybe there will be a small dip after the halving - as in what happened in the 2016, halving cycle.

BTC Market Cycle | Repetitive and Predictable Market CycleThe Bitcoin market cycle can be easily predicted by studying historical data. Whenever you seek an idea of where the market is heading, you can always look at the past to gauge the future. However, this doesn't guarantee that the predictions stated here will unfold exactly as described; it's a PREDICTION, not a fact.
Let's examine the chart displayed here. The market cycle repeats itself every four years, with our chart divided into four cycles, the fourth being the current cycle we are in. Every four years, Bitcoin undergoes a major event known as Halving, where the number of blocks containing Bitcoins is halved every four years. We started with 50 Bitcoins released in a block every 10 minutes; in 2012, that amount was reduced to 25 BTC. In the following cycle, it was halved again, and this will continue to happen every four years until all Bitcoins are mined. Currently, we are heading towards the fourth halving event, which will see the number of blocks released reduced to 3.125 BTC.
Due to this event, the price of Bitcoin appreciates in value every four years. This is driven by supply and demand, as fewer Bitcoins are mined than in the previous four years (reduced supply), creating scarcity and increasing demand. The mining difficulty also increases, causing miners to be reluctant to sell the Bitcoins they've mined, contributing to the price increase.
On our chart, we have three completed cycles that look almost identical. The cycles consist of a bull market where the price experiences a significant increase, followed by a bear market where the price drops in the range of 80–85%. This is followed by the first expansion, where we see a slight price increase, followed by the first accumulation phase. Prices move up and down within a specified range during this phase, also known as the consolidation phase. We then move on to the second expansion and the second accumulation, usually forming just before or within the halving period.
This not only shows us that the market cycles are similar but also allows us to predict future events. At the time of writing this, we are three months away from the fourth halving, and it appears we have entered the second accumulation phase, as seen in the past three cycles. Prices should trade in a specified range for a few months after the halving. When you examine the halving events on the chart, you can observe that we usually enter the bull run somewhere between 6 to 8 months after the halving. Based on that, we can predict that the next bull run will start between October and December 2024, lasting until the fourth quarter of 2025.
In the past, the cycles have been accurate, and we can expect the same unless a global catastrophic event occurs, as seen in March 2020 during the COVID-19 pandemic. In that phase, there was no second expansion as all markets crashed. It is my opinion that this led to the bull run not reaching its full potential. Had we experienced the second expansion, the price would have moved slightly higher before the second accumulation phase, leading to an extended bull run pushing the price near or above $100k.
My price prediction at the end of the cycle, assuming world events stay normal, is to see Bitcoin in the range of $120–150K.
What do you think the price of Bitcoin at the end of 2025 will be? Like, share, and feel free to leave a comment. Let me know if you agree or disagree with this analysis.

Benford's Law (The Law of Anomalous Numbers)In a previous post we discussed the significance of price levels. Prior highs and lows are often revisited, sometimes more than once and act as resistance and support. Like a magnet these major and minor highs and lows appear to attract and repel price over time. With this information we drew trendlines creating channels in order to anticipate future price levels.
To view a growing price chart over a long period of time is impractical using an Arithmetic scale for price. For the most part, all analysis is done using a Logarithmic scale instead. This allows us to view the percent change uniformly. To understand the drawback of an arithmetic chart, consider how it may look for prices to change from 2 to 10 then 10 to 50. The move from 2 to 10 is only a difference of 8 units, whereas, 10 to 50 is 40 units. The percent change is the same, as is the rate of change assuming the same amount of time eclipsed. Logarithmic charts allow for a better gauge on momentum, but our understanding of numbers as they relate to each other may still be incorrect.
The Law of Anomalous Numbers or Benford's Law states that given a data set that does not have built in constraints or parameters to influence the output of data, the leading digit will follow a power law distribution. The larger the data set and orders of magnitude covered, the greater the conformity to this distribution. We may have assumed that the most likely outcome of leading digits in a data set would be uniform, but this would be incorrect.
As a percentage the expected distribution of leading digits using numbers in base 10 is as follows:
P(1) = 30.1%
P(2) = 17.6%
P(3) = 12.5%
P(4) = 9.7%
P(5) = 7.9%
P(6) = 6.7%
P(7) = 5.8%
P(8) = 5.1%
P(9) = 4.6%
It should be noted that the shape of this distribution holds regardless of the base of the number system used. Using base 10, the median leading digit of the distribution is 3.16. This means that half of all data points should fall between 1.00 and 3.16 while the other half fall between 3.16 and 9.99. Without this understanding, we might have otherwise expected 5.5 to be the median leading digit as in the case of a uniform distribution.
The chart above shows equal spacing between price levels on a logarithmic chart. They can be found by taking the square root of 10 (= 3.16), then taking the square root of 3.16 (= 1.78) then cubing 1.78 (= 5.62). Midpoints play a significant role in my analysis and is the basis for using these numbers.
1.0 black
1.78 light blue
3.16 red
5.62 dark blue
This organizes the expected distribution into quarters. Over time the actual distribution of leading digits observed should gravitate towards the distribution of Benford's Law.
While I have had my doubts about the validity of using these numbers as price levels, I couldn't keep this to myself given its apparent relevance.

Bitcoin's Moving Averages (Lucas Numbers)Lucas Numbers
This is the final set of numbers for periods that we'll analyze in this series. In previous posts we discussed the significance of phi, the golden ratio, 0.618 and how Lucas Numbers relate to the Fibonacci Sequence.
Using daily closes, I have overlaid the SMAs and EMAs. The same colors represent the same set of periods while the brighter color is the EMA and the duller color is the SMA.
2 black
1 orange
3 red
4 pink
7 purple
11 dark blue
18 light blue
29 light green
47 black
76 orange
123 red
199 pink
322 purple
521 dark blue
843 light blue
1364 light green
2207 black
3571 orange
Next we will take a look at the same Moving Averages but using weekly closes instead of daily closes.

Bitcoin's Moving Averages (Fibonacci Sequence)The Fibonacci Sequence
In a previous post we discussed phi, the Golden Ratio, 0.618. Adjacent numbers along the Fibonacci Sequence trend toward this ratio. Growth and decay can be witnessed through this proportion.
Using daily closes, I have overlaid the SMAs and EMAs. The same colors represent the same set of periods while the brighter color is the EMA and the duller color is the SMA.
Starting with the 5th number of the Fibonacci Sequence:
5 black
8 orange
13 red
21 pink
34 purple
55 dark blue
89 light blue
144 light green
233 black
377 orange
610 red
987 pink
1597 purple
2584 dark blue
4181 light blue
Next we will take a look at Moving Averages using Lucas Numbers and conclusions will be saved for later.

Bitcoin's Moving Averages (Human Cycle)The Human Cycle
In the previous post, we looked at standard or commonly used moving averages due to the simplicity of calculation given our base 10 number system. Now we consider if the cycles we experience as humans on earth provide us insight into the patterns seen on the charts.
Using daily closes, I have overlaid the SMAs and EMAs. The same colors represent the same set of periods while the brighter color is the EMA and the duller color is the SMA.
7 black (1 week)
30 orange (1 month)
91 red (1 quarter)
183 pink (half year)
274 purple (3 quarters)
365 dark blue (1 year)
548 light blue (1 and a half years)
730 light green (2 years)
1095 black (3 years)
1461 orange (4 years)
1826 red (5 years)
2191 pink (6 years)
2556 purple (7 years)
2922 dark blue (8 years)
3287 light blue (9 years)
3652 light green (10 years)
4914 black (all available data through 2023)
Next we will take a look at Moving Averages using the Fibonacci Sequence and conclusions will be saved for later.

Bitcoin's Moving Averages (Intro with Common)Moving Averages provide us with a dynamic metric to monitor current price in relation to past periods. A Simple Moving Average (SMA) is the average closing price for a set number of periods. An Exponential Moving Average (EMA) weights the most recent closing prices more than the closing prices toward the beginning of the set number of periods.
The current price in relation to a moving average provides us with information about what to expect from the market and can often act as resistance and support when approached. The purpose of this post is to introduce moving averages and provide a chart with as much unfiltered information as possible. Conclusions will be drawn another time.
Using daily closes, I have overlaid the SMAs and EMAs of commonly used sets. The same colors represent the same set of periods while the brighter color is the EMA and the duller color is the SMA.
Since we are accustomed to using numbers in base 10, these are some of the most commonly considered sets:
10 black
20 orange
50 red
100 pink
200 purple
500 dark blue
1000 light blue
1500 light green
2000 black
2500 orange
3000 red
3500 pink
4000 purple
4500 dark blue
5000 light blue
(TradingView wouldn't let me add a set any higher than 4999)
While we are accustomed to using these numbers, we aren't confined. In a separate post I will overlay both SMAs and EMAs again, but will instead use sets that are more familiar to the cycles we experience as humans on earth, such as, 1 Week, 1 Month, 1 Year, etc. In the posts to follow, I will do the same using the Fibonacci Sequence then once more with Lucas Numbers. Finally, I will do it all again considering Weekly then Monthly closes. Later on we'll draw conclusions on which moving averages consistently appear to have the most relevance and when to expect changes in price given moving average positioning.

BTC Diminishing Cycle ReturnsIf we can break and hold a monthly above the blue fib spiral, then this model is broken and can be ignored.
See the image below for the correct scaling.

Post halving rally to $750kThe halving in April 2024 will serve as catalyst to trigger the active hidden bullish divergence in RSI vs. the all-time monthly log chart resulting in a 2-year rally up to $750,000 by end of year 2025

Bitcoin's Most Relevant Price LevelsThis is a cleaner chart with the relevant channel and price levels using weekly closes.
Next we will take a look at Moving Averages using standard and nonstandard time periods.

Bitcoin's Price LevelsSimplicity is significant. When viewing a price chart, what are the first things we notice?
Highs, Lows, and Slopes
As we begin to analyze a chart, note the major and highs. Like a magnet, these are price levels that price will gravitate toward and repel from over time. How price approaches these levels will give us insight into the likelihood of a continuation or reversal at the price level. A price level is resistance when above the price and support when below the price. The space between price levels is the range. The more times price interacts with the price levels that make up the range while remaining rangebound, the higher the likelihood that the eventual breakout from the range will result in price never returning to the former range. A relatively long amount of time spent rangebound is a sign that price has stabilized and is ready to continue or reverse the preceding move that brought it into the range. Oftentimes we notice resistance turned support or support turned resistance as price breaks through a price level. This would imply that one price level is losing its significance relative to the next price level, which may not yet be identified. In order to identify a price level that does not yet exist, we must turn to alternate charting methods.
Channeling is one way to incorporate price levels with the slope, i.e., a channel is a sloped range or an average rate of change with the expected deviation around the midpoint. Occasionally the price levels that make up a range are seemingly ignored in the case of a breakout. The next area of resistance or support can be identified by drawing a channel. A downward channel is formed by drawing a trendline that connects two major highs with a parallel line that passes through the major low separating major highs. An upward channel is formed by drawing a trendline that connects two major lows with a parallel line that passes through the major high separating major lows.
At every moment multiple ranges and channels exist simultaneously. Special attention is paid to price as it approaches the support or resistance of a channel, as we search for the formation of new price levels and ranges. There is also significance when trendlines and price levels intersect since the market must decide which force is stronger. At times price is not near an intersection but the timing of the intersection may prove important to changes in trend. When the price remains rangebound, the market is taking its time to organize its next move. Breaking through the support or resistance of a channel should alert us to consider a different or altered channel along with other metrics, such as moving averages.

The Golden RatioAlso known as phi, the Golden Ratio can be derived by determining the proportion at which dividing the whole equals the proportion between the smaller and larger segment that together make up the whole.
Algebraically, this can be describes as:
x + y = 1
|x| = y / x
x (and y) must be positive since they make up a whole.
Isolate the variable:
y = 1 - x
y = x^2
Combine & Solve:
1 - x = x^2
...
0 = x^2 + x - 1
...
x = 0.618
This ratio is also discoverable by considering the ratio of adjacent numbers in a sequence that continues by adding the two prior numbers, starting with 0 and 1, the Fibonacci Sequence: oeis.org
0, 1, 1, 2, 3, 5, 8, 13, 21, 34, 55, 89, 144, 233, 377, 610, 987, 1597, 2584, 4181, 6765, 10946, 17711, 28657, 46368, 75025, 121393,...
As the sequence continues, the ratio of adjacent numbers approach 0.618.
Why stop there?
Taking the ratio of all numbers in the Sequence produce more ratios that I call Fibonacci Multiples, which approach Lucas Numbers: oeis.org
..., 0.000733, 0.00119, 0.00192, 0.00311, 0.00503, 0.00813, 0.0132, 0.0213, 0.0344, 0.0557, 0.0901, 0.1459, 0.236, 0.382, 0.618, 1 ,1.618, 2.618, 4.236, 6.854, 11.09, 17.94, 29.03, 46.98, 76.01, 122.99, 199, 322, 521, 843, 1364, 2207, 3571, 5778, 9349, 15127, 24476, 39603, 64079, 103682, 167761,...
Given the similar relationship, is interesting but ultimately unsurprising to note how the sum of all ratios below the Golden Ratio of 0.618 approach 1 and the beginning significant digits begin to resemble whole numbers found in the Fibonacci Sequence.
Understanding that growth and decay is relative, we should then expect to see these ratios appear when we look for it...

More Relevance From Bitcoin's 2019 Monthly Channels The right channel contains the price, but it would be a mistake to simply discard the channel once it seemingly become invalidated.
The chart speaks for itself; who's listening?

Does Bitcoin's Monthly Channel from 2019 Remain Relevant?While the usefulness of a channel diminishes over time, I notice bitcoin moving along the same angle as it has in years past. Interestingly, the space between channels may not be coincidental.
How long will bitcoin continue to appreciate at this rate?
At this rate bitcoin will be back to a new all time of $70k in October 2024.
Will bitcoin reach the bottom of the former channel (red line) ever again?
This could coincide with a bitcoin top around $400k at the end of 2025.
Be prepared but remain flexible.


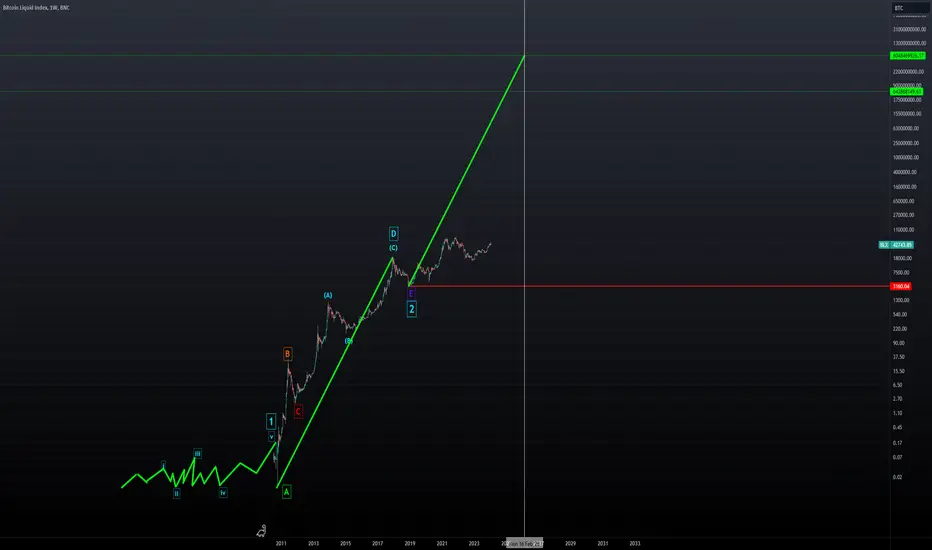
TRILLION DOLLAR BITCOIN CHART - Watch The Video...In the video linked below featuring this chart, I discussed the potential range of 6 trillion within a 65 trillion context. The distinction in measurement depends on whether you assess it in terms of percentage or a linear scale. The underlying rationale is rooted in the concept that if Wave 2 can undergo a 200 million percent expansion during an expanded correction, then Wave 3 would be at least as extensive.
Regardless of whether this expansion is attributed to inflation, one thing certainty prevails: people desire liberation from the current system of control and perceived enslavement. Could cryptocurrencies emerge as the new sovereign currency, leading to a substantial wealth transfer solely based on the power of choice? This proposition seems plausible, considering that the existing system would collapse without our continued faith in it. Consequently, the new system could establish itself as an independent entity, regardless of the prevalence of fake fiat dollar bills within the current framework. This implies that we held the power all along and are now unleashing a new tool against authoritarianism.
This perspective directly contradicts the concept of Central Bank Digital Currencies (CBDCs), as they would signify more of the same, if not worse.
The key insight into this chart lies not only in its deviation from Elliott Wave analysis but also in the fact that AriasWave deliberately evolved to focus solely on the corrective phase of a move. The 200 million percent purely as a correction indicates that the impulsive phase yet to come suggests that the best is indeed on the horizon.
TRILLION DOLLAR BITCOIN - No, It's Not Clickbait...To begin with, it's crucial to emphasize that this approach differs significantly from Elliott Wave analysis. Utilizing the AriasWave methodology involves years of observation and ongoing pattern analysis, making it distinct from conventional techniques. This video may seem out of the ordinary for this channel, as I've consistently held a contrarian view on Bitcoin since its inception.
By conducting a comprehensive analysis across various cryptocurrencies and concentrating on those that exhibit unique characteristics, I've formulated certain assumptions that have the potential to challenge conventional thinking using straightforward logic. This reasoning is rooted in distinguishing between impulsive moves and corrections. When a correction expands by a remarkable 200 million percent, it signifies an unusual occurrence with implications that extend into various aspects of daily life.
I don't believe we are immune to hyperinflation solely due to the existence of central banks. Instead, I perceive central banks as akin to an inebriated driver behind the wheel, with monetary policy as their preferred intoxicant. To illustrate, using the analogy of a central banker, it appears that when your only tool is a hammer, everything tends to resemble a nail. In response to every crisis, the singular tool employed is more Quantitative Easing (QE). While this type of inflation has been a persistent issue, much like the boiling frog analogy, the market seems to be reaching a critical point.
I encourage you to assess the content for yourself, bearing in mind that every posted comment endures indefinitely. Your efforts on this channel will yield lasting results, so, as always, conduct thorough research and refrain from seeking confirmation of preexisting biases if that's your inclination.

BitcoinBuy the dip opportunity very close around the FWB:31K +/-4k. Be ready it may be quicker than you expect.

Bitcoin: Redux ITargets listed for cycle tops.
30-40k expected bottom before continuation to 200k levels.
Halving April 2024.

