BTC TimetravelLook at this, its crazy how accurate! Look at my first Timetravelpost and let me know what do you think about that.
It looks that the next bottom is in around 1. Nov. 22...
BLX trade ideas

BITCOIN FUTURE PRICE BULLISH🔋🔋🔋We know roughly what the price of bitcoin will be in the future🔥🔥 Do you believe bitcoin will be worth $1 million? Anyone have any idea? Write your opinion

BTCUSD - 200 Weekly SMA to the rescue (again)? 🤔What's up traders, gamblers, hodlers?
Been a while since I last posted an analysis and this was mostly because I've been in denial that we were in a bear market. Bias is a b#...
There is hope though... You see, in the 2 previous bear markets about halfway between halvings, bitcoin has found its bottom on the 200 weekly SMA which acted as support. So maybe, just maybe this might happen again?
I know that past performance is no guarantee for the future, but hey, if it happened twice, it could happen again, right?
Additionally, the time that has elapsed since the previous halving is about the same as the previous times this happened, which might increase the chances that we'll see bitcoin slowly turn around and start running up towards the next halving.
⚠️BUT .... the financial markets are very shaky, supply shocks, inflation, conflicts ... for a lot of traders and investors this is a RISK-OFF period, so don't expect a sudden turnaround, and keep in mind that just because it happened twice before, it does not necessarily have to happen again.
How am I dealing with this situation?
You probably know that I'm a strong proponent of HODLing and DCAing. I'm an investor, not a trader. So I've not sold a single satoshi, and I plan on starting to put some buy orders in to DCA considering that the potential upside from here is so much larger than the potential downside ... But this is my money, my decision, and definitely not advice for any of you.
So what do you think? ... Will the weekly 200 SMA be the bitcoin SuperHero again and come to the rescue?
Share your thoughts in the comments, and if you made it this far reading, you might as well click that thumbs-up button. ;)
Have a great day, and whatever you do, don't invest more than you can afford to lose.
✌🏽

FIB SPIRALS RESEARCH IIEXPERIMENTAL SERIES OF FRACTAL RESEARCH WORKS
How can fib spiral affect and decrypt the randomness of fluctuations in financial markets.
This is basically what our eyes miss, but inner voice feels it, I call it map of chances. The actual math behind intuition of mass consciousness in the market and why the price action chooses to behave in certain way, accordingly creating shapes which continuously determine its path. For example, when a pullback retraces to 0.618 and reverses.
This is what's behind the very action of your expectations coinciding with outcome of the price fluctuations.
I often put this spiral on trends to find its path or limits. The price will always react upon reaching fib spirals, whether it just follows the path or reverses when price surpasses them (breakout).
It mimics and justifies the potential trends just like sine waves but in an advanced way considering the rate of change .
Interconnectedness of fractal's critical points predetermines it's fate.
I didn't want to publish this work because it can raise too many questions. But I'm also the one who has some questions too.
EXAMPLE OF JUSTIFIED USE OF FIB SPIRAL.
This phenomenon is quite interesting. When it's handled in the right way, it can do miracles and I'm just raising common awareness about this magnificent tool.
Throughout time, I'll be consistently updating this idea with new content of whatever I find out about application cases as such
Logical deductions are yet to be made. This problem can be solved by method of exclusion.

Bitcoin Bullrun Fractal 🚀 Current market condition compared to it's historic fractal
When people like @msh42 talk about higher targets.
Request executed.
NOT A FINANCIAL ADVICE

Update on Bitcoin - Stoch RSI ❌cross below 1.00 (smoothD)Update on Bitcoin - Stoch RSI ❌cross below 1.00 (smoothD)
Event only happened three times in BTC history
1. ❌
November 2011 - smD 0.25
2. ❌
December 2018 - smD 0.65
3. ❌
July 2022 - smD 0.76
Massive gains after 1. & 2. ❌cross Crypto Nation
Comment & Follow appreciated
*not financial advice
do your own research before investing

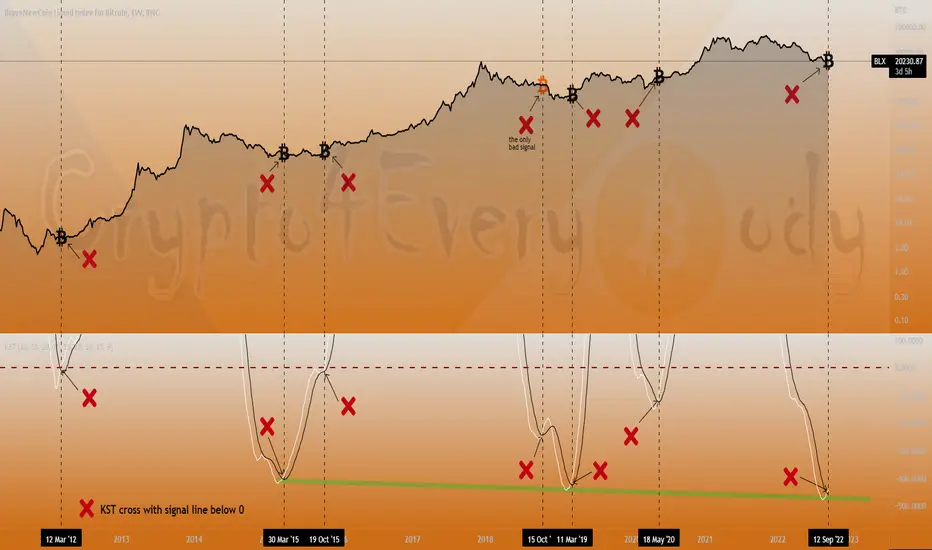
KST cross❌below 0 in the past for Bitcoin 🚨🚨🚨Update:
Look at these KST cross❌below 0 in the past for Bitcoin 🚨🚨🚨
Except one bad signal October 2018 we had six beautiful buy signal for BTC with great gains followed
Crypto Nation - two weeks ago KST crossed❌again
Comment & FOLLOW appreciated
*not financial advice
do your own research before investing

DXY (is it time to see relief in crypto market?)TVC:DXY
Finally it's time to watch us dollar index closely as it is approaching the upper boundary of long time frame ascending channel. us dollar index shows the strength of USD against other assets. RSI looks overbought and i am expecting to see some green candles for crypto in coming weeks. Historically we can see how crypto market reacted to these critical levels of DXY chart and this is one reason for me to get interested in DXY current chart. this does not mean bear market is finished but it shows we can see bounce before real crypto winter comes. in the TOTAL chart i will go deeper in TA and see what is in it for us to be more curious.
as always DYOR before taking any financial decisions.


7k bitcoin Coming?Although the charts of bitcoin on lower time frames look like they might be bottoming, the monthly chaos looks like it's just getting started. BTC has just broken it's low on the RSI at the same time it has gone below it's historical log growth curve.
This could get real bad real soon.
Not Financial Advice.

Is The Crowd Ever Right? This article aims to address a question that seems to be burning at the back of many investors’ minds: Can the crowd be right? How can we enter a recession or depression when everyone seems to be thinking about it? But first, I’ll give a bit of background and some of my opinions on the current fundamentals of the cryptocurrency market, and why these opinions are in keeping with my general character.
The Crowd's Market Choices and Economic Revolution
As anyone who has been following me for the last few years will know, I’ve tended to embody a somewhat revolutionary mindset. I’m a hippie artist guy who finds dystopian realities disturbing, but also fascinating. At the same time, I’m also hopeful we will continue to evolve as a species and “figure our shit out.” That’s why I frequently talk about big tech collapsing and why I’ve even speculated about crypto as a promising new financial system. Particularly over the last two years, several observations have led me to become skeptical of something I once thought had some potential. In fact, it seems more and more that cryptocurrencies have become just another way for profiteers to generate income off people’s mere hope to obtain financial freedom. This seems pretty messed up, right? Cue Michael Saylor’s pseudo-radical, esoteric Tweets.
Being a supporter of some cryptocurrencies has always given me a vague feeling of cognitive dissonance, and events of the last two years have revealed to me why that’s the case. Current implementation of cryptocurrencies just doesn’t align with my values. After all, I was a hippie artist guy long before I ever got into crypto or financial markets. I’m still entranced by the idea of a frictionless global currency that’s accessible, lightweight, and inclusive. This is why I feel more neutral to positive towards projects like Nano, Stellar, and now Algorand. One of the things I find interesting about crypto is that people are free to choose projects and protocols that fit their own economic vision. It’s a fascinating sociological case study into Internet communities and economic values. But I think this hyper-decentralization itself has become a downfall of the space. The projects that work the best as currencies have been left by the wayside, while the clunky, expensive, expansion-oriented projects garner most of the attention.
In some ways, the growth of Ethereum, Bitcoin, and Binance Coin all represent the parallel growth in our society––a growth without real substance and meaningful positive change. And with clunky, bureaucratic infrastructure to boot, with lots of unnecessary fees and almost too many instances where one can slip up. In fact, American Neoliberal economics values the “pull yourself up by your bootstraps” mentality, which is why healthcare is not universal here, and why the social welfare system seems to entrap rather than empower. If you want evidence, read American Society: How it Really Works by Joel Rogers and Erik Olin Wright.
“Being your own bank” is just the financialized version of “pick yourself up by your bootstraps”, so it’s in effect anti-revolutionary; it merely goes along with the Neoliberal policies of Nixon, Reagan and Clinton (I think these three are the biggest culprits). Crypto is very American, and is aligned with the policies of the American government since the early 1970’s. Therefore, developing countries adopting crypto seems to be more of a step closer to disaster than away from it. Much like socioeconomic policy in the U.S. It enforces individual responsibility in such a way that people don't have much to support themselves. It pretends to be revolutionary, when it is really oppressive and disempowering.
I speak mostly of the United States, since this is where I live, and it’s the socioeconomic context I learned about in social work school. What I’m talking about here is also lasting output. You cannot say, with evidence, that Bitcoin or Ethereum has a net positive effect on access to resources, education, sound infrastructure, or financial efficiency. Sure, there are some places in the world where using Bitcoin for purchases makes more sense. These are places where everyday citizens experience absurd inflation and do not have easy access to banks or dollars. In this case, it serves a distinct purpose as a tool––essentially a last resort. It is a good thing to have last resorts, but I also wonder whether localities within these countries would simply just develop their own currency or bartering system. I wouldn’t be surprised if this were the case. In some ways, Bitcoin is even more obedient to the whims of the elite, since supply is easily accumulated by large wealthy entities over periods of time. If a small community in an inflation-stricken nation decides to use small pebbles as currency, they have more control over the rules than had they chosen to use Bitcoin. With Bitcoin, they’d be subject to numerous technological limits, portals, fees….and that’s just unnecessarily complex.
This article wasn’t really meant to be about crypto and why I don’t particularly believe in its long-term durability. But my belief in its durability affects how I, as an “analyst” read the market.
There seems to be a pervading assumption in markets that when everyone is talking about selling and fear is palpable, smart investors should really be buying. However, natural logical reasoning dictates that if a bunch of people simultaneously give up on something, the project will halt, and it won’t get finished. So why has the market tended to behave differently? Why can’t we just be allowed to give up on something that doesn’t work? We saw with 2008 that a bunch of banks in the U.S. could have completely failed, because they did not adequately serve the people with integrity. But…the government stepped in and bailed them out, instead of improving the system. This is unfortunately in line with the monetary policy that has snowballed into the current crisis.
I believe the reason why the crowd always seems to be wrong is mostly a function of wealth inequality and exploitation within markets. This is because when the general public is excited about something, they are often late to the game, and they are already being actively exploited, whether they know it or not (early investors using the purchases of newcomers to generate profit). Then, once the bubble pops and prices bottom out, the everyday person has already sold because they cannot afford to see their assets decline any further. Then, the market runs out of sellers while the wealthy (and even the moderately privileged) can afford to continue adding to their balance sheets.
What breaks this cycle? A debt reckoning and deflation. If one subscribes to the belief that markets naturally correct themselves to rebalance, and if one observes the pace at which inflation has exploded relative to stagnant wages since the '70's....then clearly there is an imbalance, although it is difficult right now to ascertain what effect this imbalance will have. What is always clear is that he process of a return to equilibrium after unsustainable growth is a painful one. Excess gets trimmed, and as the saying goes, you get to see who’s standing naked once the tide goes out. The ones in power feel the pain last because they’re standing deep in the water.
There is also the pervading idea that markets only go up. Let’s take a look at the Japanese markets, which have not even breached their highs from the late 1980’s. This shows us it is possible for U.S. equities to enter a period of slower growth that lasts decades. Yes, decades. In this case, even though the crowd seems to be overwhelmingly bearish, they are secretly bullish––meaning they do not believe a recession would last longer than a couple years, at the very worst. In a way, the crowd actually still expects investing in equities and other assets to be a surefire play. And again, if we look at Japan––they have been experiencing an aging crisis. Many studies have recently shown that the same is about to hit the U.S., as the baby-boomer generation reaches old age while younger generations have less and less children. This is not an environment suitable for the kind of growth the market has seen since the 1970’s.
The Crowd's Stance on Bitcoin
Active addresses have not sustained meaningful growth since the 2015-2017 bull market. studio.glassnode.com
In fact, the amount of active addresses has essentially stagnated. This leads me to believe that everyone who wanted to own Bitcoin has purchased some already, and it will be hard to get others to do so without enforcing it. But even with El Salvador and The Central African Republic adopting it as legal tender, addresses have grown minimally. The crowd seems to feel indifferently or negatively towards Bitcoin. To be fair, it’s gotten a lot of flak for its environmental impact. And this is warranted: If Bitcoin scaled to facilitate a quantity of transactions on par with the current financial system, it would be far more devastating. Does this mean Bitcoin’s growth is finished?
Amongst the remaining Bitcoin bulls, I've noticed three major justifications for continued price appreciation:
1) Cycles. Bitcoin will definitely go up again because of its repetitive cycle behavior. *Wink Wink* Trust me bro, now is a great price. Anything under $20k is a good buy.
2) Negative funding – funding has been consistently negative for weeks and weeks while open interest remains stubbornly high. This means the crowd is shorting, and they will be squeezed.
3) The dollar will eventually become nearly worthless, since the FED will need to turn the money printer back on. Everything else is priced in. The history of currencies tells us fiat fails.
4) The crowd is bearish, so we should all be buying.
Now, I’m going to address each of these points and explain why I think we should be careful with this logic.
1) This is making an assumption based on past behavior. Bitcoin has already deviated from this behavior by lingering near its previous cycle high without a meaningful bounce. Although the crowd is short-term bearish, it is still long term bullish. People are hopeful to purchase Bitcoin at $12k or lower, expecting another cycle eventually.
2) This is an interesting one. Exchanges generally want trading activity. They also want asset prices to move up, since it attracts new investors to their platforms. Funding has been extremely negative across the crypto market for much of this year, even as prices have continued lower. I recall ridiculously negative funding for LUNA right before the collapse, and recently extreme negative funding for ETH right before the merge. Usually, negative funding tells us that the market is biased to the short side. But is that really what it tells us? Or does it mean the exchange itself wants to make shorting more expensive, to make retail traders more likely to keep tight stops and close out positions early? These “forced” trades generate fees and income during a bearish period for the exchange.
3) The USD hasn’t been around for terribly long. Because it holds so much power internationally, it is unlikely to become worthless in the short term. In fact, its value goes up as the demand for debt decreases and the demand for cash increases, regardless of its supply. My opinion is that if the money printing and QE in the U.S. had gone into substantial projects (infrastructure, education, clean energy, etc.) we would have seen true growth, which could be sustained. It might have taken more time, but it would not result in bubbly market behavior requiring constant bailouts. Our systems would be more self-sustaining. Money spending isn’t a bad thing. It’s what we do with it that matters.
4) We have programmed fear responses for a reason. Animals will often sense an earthquake or hurricane well in advance, and escape to higher ground or a protected area. Just because everyone seems to be panicking or running away does not make disaster any less likely. As I’ve written above, it only seems to be that way because there are certain members of society who take advantage of the herd to generate liquidity and profit.
Since this article has been fairly long, I’ll give a small TL; DR:
The crowd is usually wrong because they’re being fleeced by someone with more power. A mass sell-off IS a revolution – action towards change. The crowd can be right, in a sense. The markets need to tumble significantly for new powers to establish and allocate resources mindfully.
And I’ll leave with a couple of questions:
Bitcoiners believe this bear market won’t last more than a couple of years, and certainly most believe Bitcoin will see another cycle. But then, most outside of crypto seem to not believe in it and find it unattractive, scammy, or even funny. By abstaining from crypto, people are exercising their freedom to choose. Will they be right, or is Bitcoin “inevitable?”
As I've mentioned in some of my recent posts, Bitcoin needs to manifest an impressive 100+% rally in a pretty short timeframe in order to keep up with its long term trend, particularly against traditional assets. That required percentage keeps increasing every day. Ideally, Bitcoin needs to clear that $48k level marked on my chart and stay above. What could be a catalyst?
This is not meant to be financial advice, but speculative and reflective opinions on current conditions. Please consult a professional financial advisor before making significant financial decisions.
-Victor Cobra

Bullish Divergence on Bitcoin This divergence is very strong on weekly chart and it will help BTC to explode and retest 30k soon.

BTC - My Black Swan TheoryI think this post is vitally important to read and prepare for. I think the only way this scenario is negated is by the FED only raising 50bps, even if we get 75 I think we will chop and collapse.
First let me explain my theory based on time. My prediction is that this black swan event/economic collapse could happen between September 23-Septemeber 28. The only way it might begin the 21st is if we get 100bps raise or higher. The reason for 9/23-9/28 Is due to many different factors such as numerology, world events, biblical dates, and much much more. Please be watching what happens during this span of time.
Now for the chart analysis. Our first key level for this bear market cycle was our 0.618 ($28,800). We held it as major support for many months before we closed a candle below and had a 40% drop in price over the next couple weeks.
Red Line on Chart (1.)
This time is much the same. We held our wick support at our 0.786 ($17,700) and have had most of the support built around our previous resistance ($19,500) (Orange Line). If we break our last low which is also our 0.786 with a candle close then there is nothing but thin air below us. Little trading volume is below us until around the $9,700 level. As soon as we break the $17.7k level with a close it will only take a couple weeks to again have a 40%ish correction.
If this scenario does play out here are all the next major levels to the downside. The next one is our yellow line around $13,800. This level was major candle closes in our 2017 bull run. It was our top on our 2019 rally and also a key level before our breakout for the 2020/2021 bull run. Most people are targeting this level which is why I think we will go lower.
The level below that is our green line ($11,400-$11,800). This would be that 40% drop measured move. It was also very key candle closes from our 2019 rally and an important level to watch.
The next level is our cyan line around $10,500. This was our triple top level before our bull run breakout. It was also some very key candle closes from the 2017 bull market.
The level below that is our blue line ($9,700). This is where most of the volume was traded and a very key psychological level around the $10k mark. It was also the last CME gap before our 2020-2021 bull run.
The final level if we have a calamity like never seen before would be around the $7600 level. There is lots of significance to this level in the past cycles, but also very key candle closes on our 6M chart. This is the lowest I think we could possibly go as it seems very unlikely to see the $3k levels ever again.
Again, I am a MAJOR BTC bull but its important to take charts into consideration and not emotional decisions. This is just my black swan theory, but if something bad is to happen around those dates please look back at this chart and prepare yourself for the key levels I have outlined.

BTC Trajectory based on Log Scale, Trendlines, and Log FIBs BTC Trajectory based on Log Scale, Trendlines, and Log FIBs

BTC All-Time-ChartEverything is on the chart - just to fill your perspective with additional nuances. Sorry and you're welcome!

3 long-term scenarios for BTC 2022-2024There are 3 possible scenarios:
— If we brake 25000 and stay there, it could be a sign of further level of consolidation 25000-30000
— Then, If we break 30000 it could be a great sign of finished lower bear market, if we fail to break 30000 we may see 20000 again
— If we lost 18000-19000 support, we may see cascade liquidations and lower lows at 15000 or even lower
Analysis based on past mirror levels.

Long Term Forecasting For BTC-USDTthe btc in the last stage and forming last Bottom >>>>>>>>>>>>>>>>>>>>>>>>>>


BTC Long opportunity
BTC long opportunity to break the downtrend.
Tp's have to be taken at every resistance arrea. please take in mind that the Tp's are global and have to be perfectionated by your own analyse.

Delayed OutcomePossible that the pandemic just delayed the outcome of pattern playing out? Here is an idea that 2 cycles have played out and 3rd is just about to start.

Look at these KST cross❌below 0 in the past for Bitcoin 🚨🚨🚨Wow ‼️
Look at these KST cross❌below 0 in the past for Bitcoin 🚨🚨🚨
Except one bad signal October 2018 we had six beautiful buy signal for BTC with great gains followed
Crypto Nation - last week KST crossed❌again
Comment & FOLLOW appreciated
*not financial advice
do your own research before investing
This could be your next huge buy opportunityHey everyone,
Lets see if I can repeat the halving cycle forecast success as in Apr 2019 because I see very similar conditions no matter what people think of Bitcoin based on fundamentals. This is clearly a technical view.
This chart is based on Fear/Greed mutliyear halving cycle ( Supply and demand + greed and fear = cycles)
What is Halvening ?
In Bitcoin , halving is when block rewards for mining are cut in half. Halving happens at regular intervals based on the Bitcoin protocol.
In other words the code underlying the network dictates that X new coins minted as mining rewards for miners adding blocks of transactions to the blockchain will be cut in half every Y blocks until the reward reaches zero and no new coins are mined.
Bitcoin halving occurs every 210,000 blocks.
Since one block is added to the Bitcoin blockchain roughly every 10 minutes, each halving is about 210,000 blocks x 10 minutes = 2,100,000 minutes = 4 years apart.
When is the next Bitcoin Halving: Assuming no major changes, the mining reward will drop from 6.25 BTC to 3.125 per block approx. in Apr 2024
---------------------------------------------------------
What happens when all the bitcoins are mined?
The bitcoin inflation rate steadily trends downwards. At the time of writing, more than 3 out of every 4 bitcoins that will ever exist have already been mined, and the annual inflation rate is just 4%. The block reward given to miners is made up of newly-created bitcoins plus transaction fees. As inflation goes to zero miners will obtain an income only from transaction fees which will provide an incentive to keep mining to make transactions irreversible.
Due to deep technical reasons, block space is a scarce commodity, getting a transaction mined can be seen as purchasing a portion of it. By analogy, on average every 10 minutes a fixed amount of land is created and no more, people wanting to make transactions bid for parcels of this land. The sale of this land is what supports the miners even in a zero-inflation regime. The price of this land is set by demand for transactions (because the supply is fixed and known) and the mining difficulty readjusts around this to keep the average interval at 10 minutes.
** This is attempt to predict future price movement & not a financial advice **
R:R, money management, risk, reward, technique, style, trading, bitcoin , bitcointrading, profitable trading, profittrading, profit trading, secret, divergence, bull divergence, bear divergence, divergencetrading, divergence trading, trading strategy, how to trade bitcoin , bitcoin trades, bitcoin trading, make profit, take profit, trading strategy, trading technique, successful, successful trader, successful technique, successful strategy, successful secret, how to trade, trend analysis, technical analysis , indicators, rsi , relative strenght index, let it rain, successful life, easy strategy, easy trading, easy technique, make money, crypto investing, investing, crypto, cryptocurrency, cryptocurrencies, mentoring, money, chartart, beyond

Is this the ultimate support? Hi All
Bitcoin price action is still lagging the recent strength in the network and new ATH with hashrate.
However, PA is now holding (so far) on the 20 DMA and 21 EMA support band on the 3-Monthly TF.
This what the ultimate support, even no spikes below that.
What do you think?
Is it gonna hold or break now?
Thnx
Jad
