AVGO (Broadcom) Crash Alert | The Biggest Drop Is Just Starting “ AVGO (Broadcom ) is on the brink of a massive correction, with charts pointing toward a potential plunge into the $45–$23 zone — a brutal reset that could shake the entire semiconductor sector before the next bull cycle begins. ⚠️📉”
🔥 Summary:
Broadcom (AVGO) might be entering a massive corrective phase after a historic rally. The charts suggest the bull run is pausing and a bear market retracement is about to unfold — potentially one of the biggest corrections in years. While long-term fundamentals remain strong, smart money could be preparing to buy much lower after this shakeout. ⚠️📉
🌊 Elliott Wave Breakdown
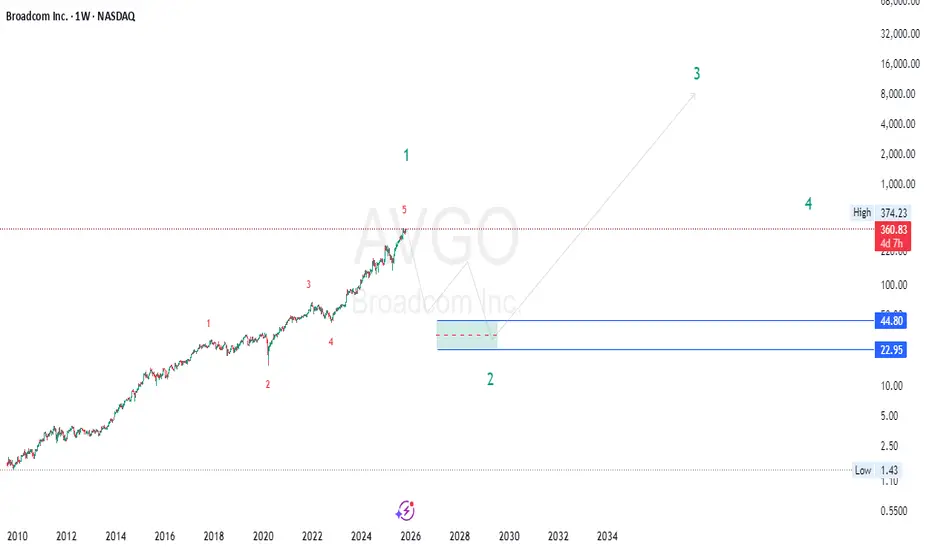
According to wave theory, AVGO has likely completed a full 5-wave impulse — marking the end of Cycle Wave 1 .
Now, the market is preparing for Cycle Wave 2 , a deep and time-consuming correction.
The expected retracement zone lies between $45–$23 , which corresponds with the 0.618–0.786 Fibonacci retracement of the entire 2010–2025 rally.
Wave 2s often create fear and disbelief, shaking out late buyers before the next mega rally (Wave 3).
In other words: this is not the end of the bull , but the start of a much-needed reset .
📉 Price Action & Market Structure
AVGO’s weekly structure shows clear exhaustion at the top — long wicks, slowing momentum, and divergence between price and volume.
The market structure shift (MSS) is forming:
Break of trendline support 🟠
Lower highs forming 🔻
Liquidity still sitting under 2022–2023 consolidation zones
All this signals that distribution is underway. Once liquidity under key swing lows gets tapped, a larger bearish trend can unfold.
🧠 Smart Money Concept (SMC) View
Smart Money is likely offloading at these premium prices.
Expect the following sequence:
💥 Liquidity grab above current highs (final trap)
⬇️ Break of structure confirming the downtrend
📉 Repricing toward discount zone ($45–$23)
🧱 Reaccumulation by institutions for the next macro leg
The bearish reprice phase may last several quarters or even years, but this is where smart money prepares for the next cycle , not retail FOMO.
💰 Fundamentals Meet Reality
Despite Broadcom’s strong fundamentals — AI infrastructure, chip dominance, software expansion — valuations have far outrun earnings .
A macro reset (higher rates, earnings compression, slowing AI hype) could drive a fundamental correction to align price with real growth.
Even great companies need bear markets to reload and revalue before resuming exponential growth.
🔮 The Big Picture
✅ Long-term bull trend is intact — but paused .
⚠️ Short-to-medium term: bear market correction is expected to start soon .
🎯 Key accumulation zone: $45–$23 (deep discount territory).
🚀 Post-correction, the next supercycle (Wave 3) could begin — targeting multi-thousand-dollar levels.
🦅 Summary Insight
“Smart money sells strength, not weakness. They’ll buy when fear peaks.”
AVGO’s parabolic bull wave has likely topped , and a multi-year corrective wave is next.
This is not the end — it’s the reset before a generational buying opportunity.
Brace for turbulence before the skies clear. 🌪️📉➡️🌤️🚀
“ Traders , this could be the setup of the decade. AVGO (Broadcom) is flashing every warning sign of a massive correction — our models point to the $45–$23 zone as the next major demand area. Don’t chase the top when smart money is preparing to buy the bottom. 📉💰
How deep do you think this correction goes? Drop your targets below 👇 and let’s see who catches the real reversal!”
— Team FIBCOS
#AVGO #Broadcom #StockMarket #BearMarket #Correction #WaveTheory #SmartMoney #ElliottWave #TechnicalAnalysis #TradingView #Fibcos #PriceAction #Investing #MarketCrash #StockAlert #Wave2 #MarketUpdate #ChartAnalysis #BearishSetup #TradeSmart
Broadcom Inc. Shs Unsponsored Brazilian Depository Receipt Repr 0.02857 Sh
No trades
Trade ideas
AVGO: Institutional Forecast Meets Structural ConfirmationSharing a quick snapshot from the WaverVanir research desk.
Our Institutional Model and structural price-action analysis are aligned on a high-probability setup in AVGO:
Model Highlights
Current: $342.65
Target: $368.31 (+7.5% in 30 days)
Signal: Strong Buy
Direction Confidence: 67%
Confidence Interval Range: $407–$466
Model Agreement: 9 of 9 bullish
The model is showing a clean volatility compression with a projected breakout path, supported by a constructive risk/reward profile.
Technical Structure
Price respected the lower ascending trend channel.
Reversal aligns with key Fibonacci recovery levels.
Structural resistance sits at $373–$378, matching the model’s breakout target.
As long as AVGO holds above $336–$340, the upward trajectory remains intact.
Why This Matters
This setup represents the type of convergence I look for:
quantitative momentum + structural flow + institutional probability stacking.
These are the building blocks behind the VolanX decision-support protocol we’re building at WaverVanir — bridging predictive modeling with real-time market structure.
If anyone is researching AI-driven forecasting or institutional-grade quant systems, I’m always open to connecting and exchanging ideas.
— Prabhawa Koirala
Founder, WaverVanir International LLC
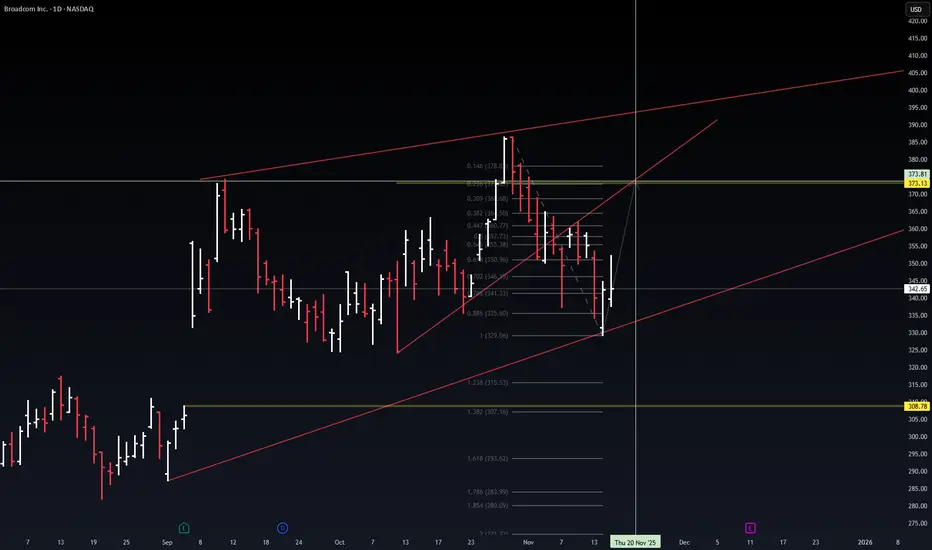
Momentum exhaustedThe price can no longer hold above the blue trendline that has supported the recent upward move.
A double top formation is also present, with a neckline at $324 and a bearish target around $260, where the daily SMA200 (blue line) passes.
Just below the neckline, there is a large gap down to $308, highlighted in orange.
It’s best to wait for a confirmed close below the neckline for greater safety

$AVGOExecutive Summary:
A significant technical development is underway for Broadcom Inc. ( NASDAQ:AVGO ). Beginning around Monday, April 7th, the stock has shown early signs of a potential trend reversal, characterized by the formation of a new ascending trendline. This bullish structure is consolidating within what appears to be a Symmetrical Triangle pattern, a classic formation that typically resolves in the direction of the preceding trend. The immediate resistance to monitor is the $340 level. A decisive breakout above this ceiling could trigger a powerful upward move, projecting a medium-term price target of $400. Key support levels are established at $330 and more critically at $300, which would act as the final defensive line should the pattern fail.
Detailed Technical Breakdown:
1. Emergence of a New Bullish Structure:
The price action observed from April 7th onwards is critically important as it marks a departure from previous consolidation. The formation of a higher low series, connected by a rising trendline, indicates that buyer demand is becoming more aggressive at successively higher prices. This ascending support line forms the lower boundary of the current technical setup and is the primary evidence for a strengthening short-term bullish bias.
2. The Symmetrical Triangle Pattern:
The price action is currently contained within the converging bounds of the ascending support line and a descending or flat resistance line near $340. This creates a Symmetrical Triangle pattern, which represents a period of indecision where the forces of supply and demand are nearly in equilibrium.
Implication: This pattern is a continuation pattern, meaning it typically pauses a larger trend (in this case, the long-term uptrend) before resolving with a breakout. The coiling action builds energy, often leading to a significant price move upon exit.
Trigger: The trigger for a bullish move is a decisive breakout above the $340 resistance level, confirmed by a strong bullish candle and, ideally, an increase in trading volume.
3. Critical Price Levels: Support and Resistance:
Resistance: The $340 level is the immediate technical hurdle. A sustained break above this, especially on high volume, is the required catalyst to validate the bullish thesis and signal the next leg up.
Support:
Primary Support ($330): This is the dynamic support offered by the ascending trendline. A bounce from this level reinforces the bullish structure.
Major Support ($300): This is a crucial psychological and static support level. A breach below the ascending trendline would invalidate the current bullish pattern, and a fall to $300 would represent a much deeper correction. This level must hold to prevent a more significant bearish reversal.
4. Projected Target and Strategic Outlook:
The measuring technique for a Symmetrical Triangle involves calculating the height of the pattern's widest part and projecting that distance upward from the point of breakout.
Price Target: A successful breakout above $340 projects a move towards the $400 zone. This objective aligns with both the technical measurement and the round-number psychological resistance, making it a credible and significant target.
Strategy: The tactical approach is to monitor the price action around the $340 resistance. A confirmed breakout offers a potential long entry with an initial profit target at $400. Stop-loss orders should be placed strategically, ideally below the ascending trendline (near $330) or more conservatively below the $300 major support, depending on risk tolerance. The integrity of the ascending trendline from April 7th is key to maintaining this optimistic outlook.

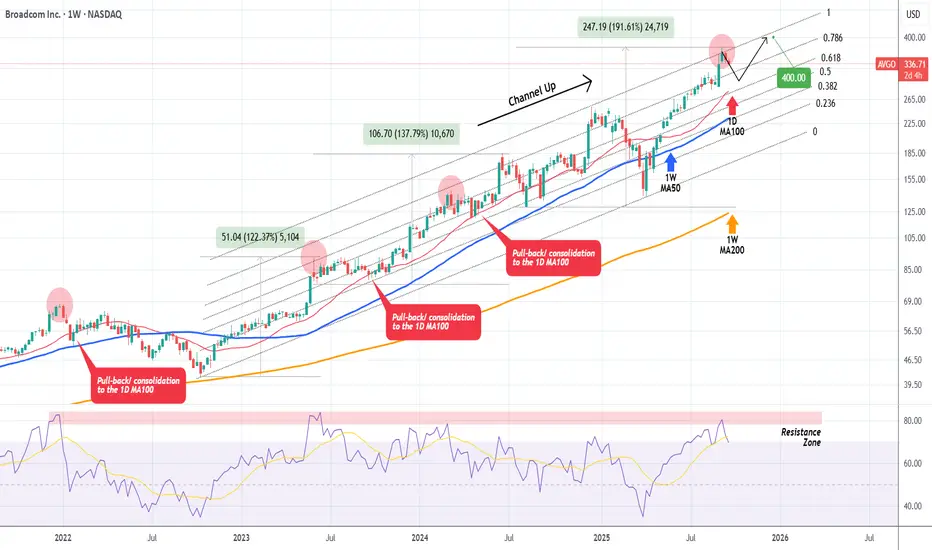
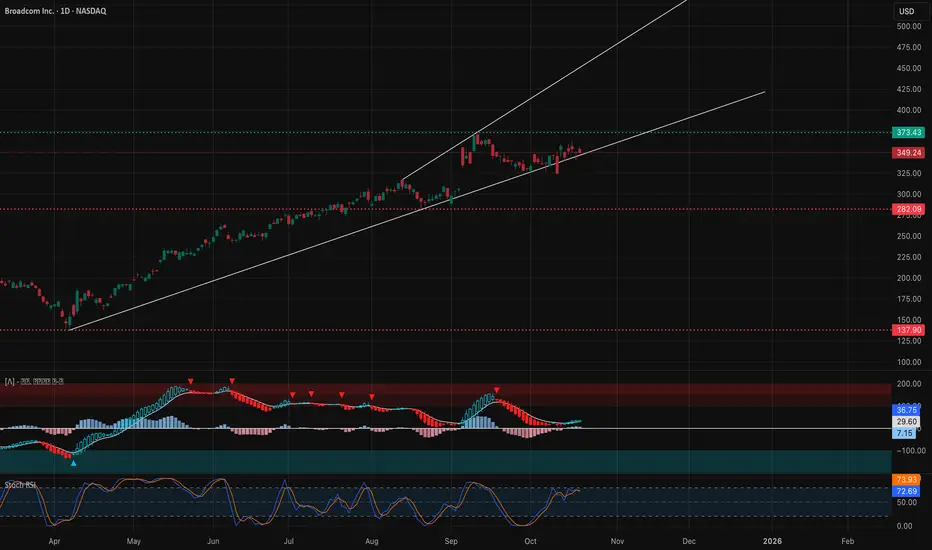
BROADCOM 6-year Channel Up in need of a correction.Broadcom Inc. (AVGO) has been trading within a 6-year Channel Up since the start of the COVID crash with the price is currently on its top (Higher Highs trend-line).
Our point of interest currently is the 1W RSI Bearish Divergence, being on Lower Highs since September against the price's Higher Highs. This kind of Bearish Divergence that high inside such a long-term pattern is an indication of a potential trend reversal.
The last correction (January - March 2025) pulled back all the way to the 1W MA100 (green trend-line) and the one before (January - October 2022) to the 1W MA200 (orange trend-line). The former was more aggressive (-44.72% against -38.65%) and faster. Both reached the bottom of the Channel Up.
As a result, even a -38.65% correction from the current levels would come very close to the bottom of the pattern by Q3 2026, approaching also the 1W MA200, which fulfils most prior pull-back conditions of the Channel Up.
Given this data, our long-term Target on Broadcom from now on is $240. The most optimal buy signal for our next long-term buy will be when the 1W RSI hits its 6-year Support Zone, which happened both on the March 2025 and October 2022 bottoms.
---
** Please LIKE 👍, FOLLOW ✅, SHARE 🙌 and COMMENT ✍ if you enjoy this idea! Also share your ideas and charts in the comments section below! This is best way to keep it relevant, support us, keep the content here free and allow the idea to reach as many people as possible. **
---
💸💸💸💸💸💸
👇 👇 👇 👇 👇 👇

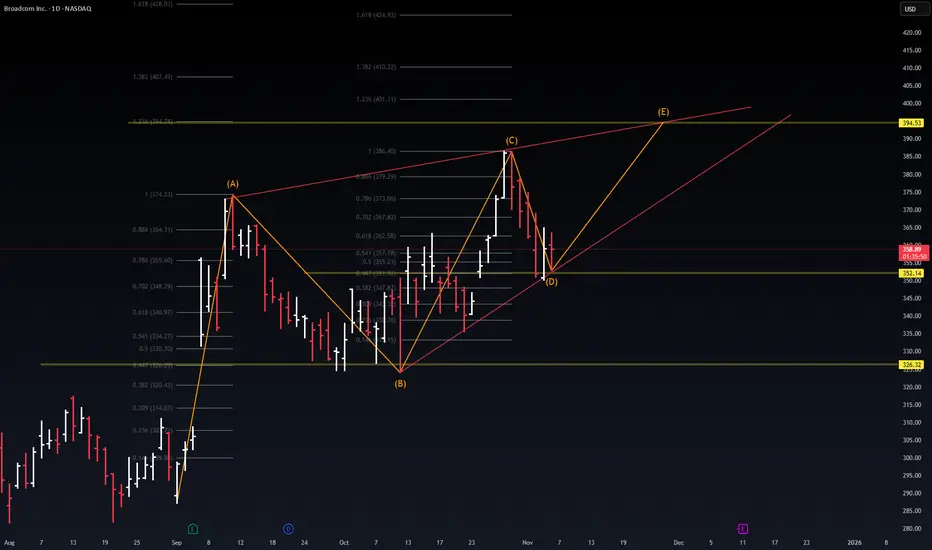
$AVGO — Harmonic Completion Loading (Wave E Setup)⚙️ NASDAQ:AVGO — Harmonic Completion Loading (Wave E Setup)
Date: Nov 6 2025 | Current Price: ≈ $358.84
Structure Insight: NASDAQ:AVGO has completed an A–B–C–D corrective cycle, stabilizing near the 0.618 retracement ($357–358 zone) — a historically strong reversal pocket.
Projection Path: If the D-leg holds, we can expect the final E-wave expansion to unfold toward the $394–$400 zone, aligning with 1.236–1.382 fib extension and prior structural supply.
Critical Supports:
Major confluence zone: $352 → $357 (ideal D-point base)
Structural invalidation: Below $347 = bearish continuation back to $326 base support
Bullish Scenario: A bounce from D → E would imply momentum rotation into late Q4 as semiconductor capital rotation resumes.
Bearish Scenario: A clean break under $352 triggers reaccumulation phase; next buy zone near $330.
Macro Catalyst: With AI hardware demand sustaining NVIDIA, SMCI, and now NASDAQ:AVGO ’s chip exposure, institutions could be positioning for year-end sector rotation.
📊 Pattern symmetry + fib confluence = where Smart Money hides in plain sight.
#AVGO #NASDAQ #AI #Trading #WaverVanir #VolanX #ElliottWave #Harmonics
TradeUSAsignals RecommendationsAVGO - Long (5% of your portfolio) - Order filled @ 342.50
An up trend controlled by Bias traders with both Time and Price traders against the trend.

$AVGO major trendline overshootNASDAQ:AVGO short.
After a trendline overshoot we should test other side of the channel:
#BROADCOM

AVGO ShortOn the 15-minute chart for AVGO, the broader market structure has been bullish, with price creating a series of higher highs and higher lows all the way up into the recent peak around $386.46, where a Break of Structure (BOS) was printed. That BOS indicates that price violated a previous swing low, signaling a shift in character and suggesting that the aggressive uptrend may be transitioning into a corrective or fully bearish phase. This break is important because it confirms that buyers who controlled the trend earlier are no longer defending previous lows with the same strength.
The nearest supply zone sits just below the $382–$386 region, where price previously dropped sharply from the high. Sellers showed clear aggression there, leaving behind a strong wick rejection and an impulsive sell-off. Below current price, multiple stacked demand zones are visible, but the most recent ones look weaker, as each bounce from these areas has become smaller and less impulsive—buyers stepped in, but with diminishing strength, which usually precedes a stronger move lower.
Inside the marked region, price is pulling back from the recent drop and is approaching that small mid-range supply, but the candles show hesitation—long upper wicks, slow momentum, and shallow follow-through. This type of price action often reflects a retracement rather than a reversal. The likely scenario is a retracement into the $376–$379 supply zone, followed by continuation to the downside targeting deeper demand areas around $362–$356, which aligns with the drawn projection.
The trade bias is bearish. Expect continuation lower after the pullback. The key invalidation level is a clean break above $382.00; if price reclaims that level with conviction, the bearish structure weakens and buyers regain short-term control.
Momentum currently favors sellers, as downside legs are impulsive and upside legs are corrective.

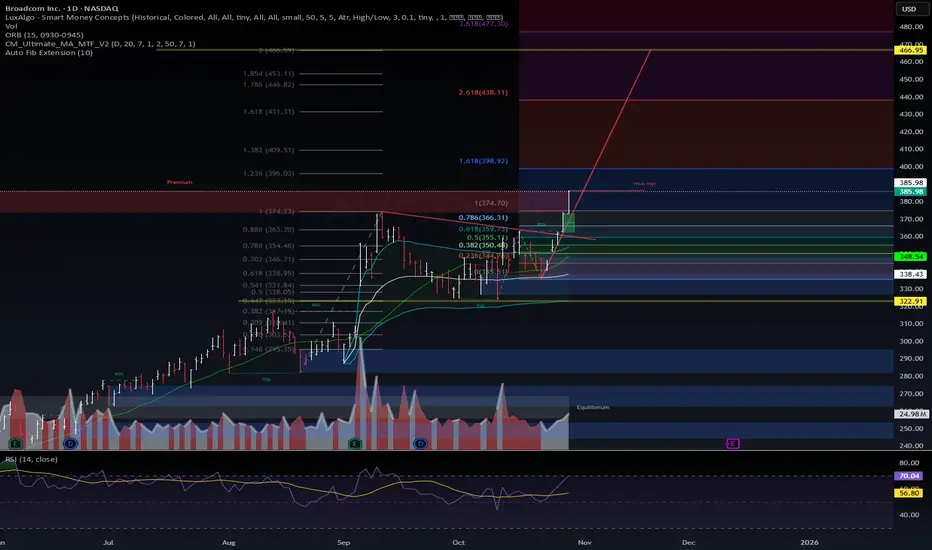
$AVGO | The Chip Vampire Awakes — Liquidity Reversal Complete🩸 NASDAQ:AVGO | The Chip Vampire Awakes — Liquidity Reversal Complete ⚡
Broadcom just reclaimed its premium zone and triggered a macro-level BOS — this is how AI liquidity resurrects after months of compression.
🧠 VolanX DSS Signal Matrix:
✅ BOS confirmed above $360 — smart money continuation detected.
🧩 Reversal block absorbed → liquidity reclaimed.
📊 RSI retesting 70 — energy curve resembles pre-expansion phase.
🩸 1.236–1.618 extension targets $396 → $431 → $466.
🎃 Macro Edge:
AI CapEx rotation isn’t slowing — it’s accelerating quietly.
Fiscal liquidity, semiconductor subsidies, and sovereign AI infrastructure are converging.
This isn’t just a stock; it’s the bloodline of the machine economy.
💡 VolanX Projection Path:
$396 → structural validation zone
$431 → institutional expansion
$466 → Vampiric Fibonacci extension target
📈 Probability Matrix (VolanX DSS):
Bull 70% | Range 20% | Pullback 10%
LRG guard confirms expansion mode.
🕯️ Liquidity never dies; it just changes its vessel — and right now, it’s flowing through silicon.
#AVGO #VolanXDSS #WaverVanir #AITrading #VampiricSetup #Liquidity #SmartMoneyConcepts #HalloweenSpecial #MarketStructure #MacroEdge #Semiconductors #TechStocks
Broadcom - Please short this stock now!🔒Broadcom ( NASDAQ:AVGO ) just ended its rally:
🔎Analysis summary:
Over the course of the past couple of months, Broadcom has been rallying substantially. But considering that Broadcom is now retesting the rising channel resistance, a retracement becomes more and more likely. We just have to wait for bearish confirmation.
📝Levels to watch:
$350 and $240
SwingTraderPhil
SwingTrading.Simplified. | Investing.Simplified. | #LONGTERMVISION

$AVGO - $400 possibleAVGO - Stock breaking out and hitting all time highs today. Seeing lot of call flow coming in here. Looking for calls above $375 for a move towards $400 and higher. Stock looks decent at the indicator level. Stock has resistance at $380 as well.

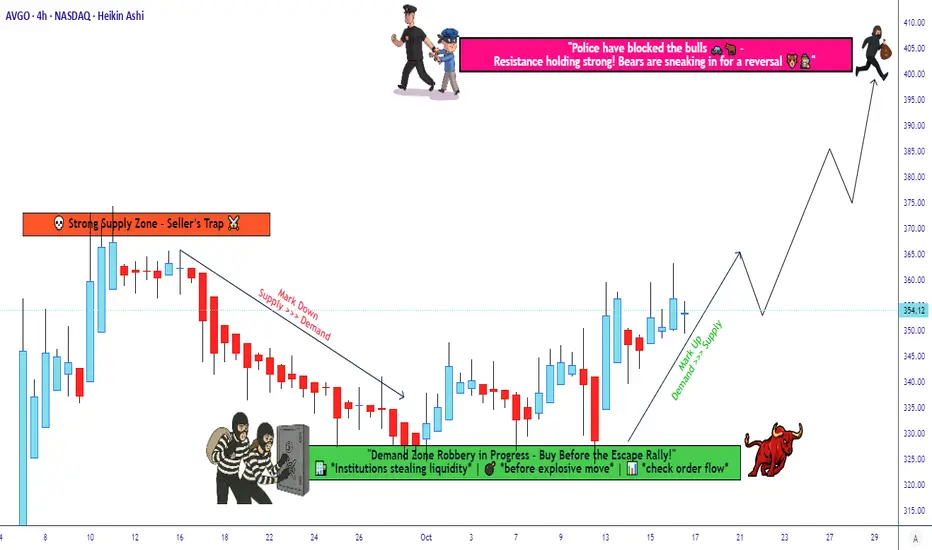
Broadcom Technical Setup - Systematic Entry Approach🎯 AVGO: The Great Heist Setup | Layered Entry Strategy 💰
📊 Asset Overview
Broadcom Inc. (AVGO) - The semiconductor kingpin that's been printing money like a Vegas casino! 🎰
🎭 The Heist Plan: BULLISH Setup
Strategy Style: The "Thief Method" - Layered Limit Orders (Ocean's Eleven style but legal! 😎)
🚪 ENTRY ZONE: The Multi-Layer Approach
This ain't your grandma's single entry point! We're going full stealth mode with multiple limit buy orders spread across the zone like a well-planned heist:
Suggested Entry Layers:
💵 Layer 1: $330
💵 Layer 2: $340
💵 Layer 3: $345
💵 Layer 4: $350
💵 Layer 5: $355
OR feel free to enter at ANY current price level if you're feeling bold! 🎲
Pro Tip: You can add more layers based on your capital and risk appetite. More layers = Better average price = Smoother ride! 🎢
🛑 STOP LOSS: The Emergency Exit
Thief's Escape Hatch: $320
⚠️ RISK DISCLAIMER: Dear Thief OG's (Ladies & Gentlemen of Fortune), this is MY stop loss level for MY strategy. You're the boss of your own money! Set your SL based on YOUR risk tolerance. Make money, take money - at your own risk! 🎲
🎯 TARGET: The Vault Unlocks Here!
POLICE BARRICADE ZONE (Strong Resistance Alert! 🚨): $400
This level is where we expect:
💪 Strong resistance
📈 Overbought conditions brewing
Bull traps potentially forming
Strategy: Escape with your bags of cash before the sirens go off! 🚔💨
⚠️ PROFIT DISCLAIMER: Again, Thief OG's - this is MY target, not financial advice! Take profits whenever YOUR plan says so. Your money, your rules, your responsibility! 💯
🔗 Related Pairs to Watch (Correlation Play)
Keep your eyes on these accomplices in the semiconductor/tech heist:
NASDAQ:NVDA (NVIDIA) - The GPU mastermind, moves often correlate with AVGO
NASDAQ:AMD (Advanced Micro Devices) - Another chip champ in the gang
NYSE:TSM (Taiwan Semiconductor) - The supplier kingpin
NASDAQ:QCOM (Qualcomm) - Wireless chip crew member
NASDAQ:SMH (VanEck Semiconductor ETF) - The whole gang in one basket
Key Correlation: When semiconductor sector heats up, AVGO typically rides the wave. Watch NASDAQ:SMH for sector-wide momentum! 📡
🎪 Why This Setup Works (Technical Edge)
✅ Layered entries reduce timing risk
✅ Multiple support zones below current price
✅ Clear risk/reward structure
✅ Room to run toward resistance at $400
✅ Semiconductor sector showing strength
🎬 Final Words from Your Friendly Neighborhood Thief
This is the "Thief Strategy" - a layered, calculated approach to catching moves in AVGO. It's all about spreading your risk, averaging your entry, and having a clear exit plan whether things go right (🎯 $400) or wrong (🛑 $320).
Remember: The best thieves always have an escape plan! 🏃💨
Trade smart, not hard! And always remember: Past performance doesn't guarantee future results, but a solid plan beats panic every time! 🧠💪
✨ If you find value in my analysis, a 👍 and 🚀 boost is much appreciated — it helps me share more setups with the community!
#AVGO #Broadcom #SwingTrading #DayTrading #TradingStrategy #StockMarket #TechnicalAnalysis #LayeredEntry #ThiefStrategy #Semiconductors #TechStocks #RiskManagement #TradingIdeas #StockTrading #BullishSetup #TradingView #MarketAnalysis #PriceAction #SupportAndResistance
AVGO Weekly Outlook (Oct 21–25): Bulls Defend the Channel Watching for a $373 Breakout 🚀
📆 Daily Chart — Macro Structure and Trend Bias
Market Structure:
Broadcom (AVGO) continues to respect its long-term ascending channel, maintaining higher lows since April. Despite recent consolidation, price remains above the channel midline, signaling that the broader trend is still bullish. The recent CHoCH near $345 shows a minor structural shift within this uptrend — a potential retest before continuation.
Buyers have been defending the $340–$345 zone, which aligns with the ascending channel support and prior breakout structure from June. As long as this area holds, the structure suggests accumulation rather than reversal.
Supply & Demand / Order Blocks:
* Demand Zone: $340–$345 (key structure retest + OB confluence).
* Supply Zone: $372–$375 (major resistance from last BOS).
* Deeper Demand (macro): $282–$290 (channel base + 0.382 retracement).
Indicator Confluence:
* 9 EMA & 21 EMA: Flattening slightly but still stacked bullishly; compression phase before next move.
* MACD: Bullish histogram momentum reappearing after fading; crossover possible if bulls reclaim $355+.
* Stoch RSI: Hovering near 70 — bullish continuation potential with no overbought extremes.
* Volume: Accumulation rising near channel support, confirming institutional defense.
If price reclaims $355–$360 with momentum, daily structure resumes higher toward $373–$380 channel top.
⏱️ 1-Hour Chart — Short-Term Structure and Swing Zones
Market Structure:
The 1-hour chart shows AVGO consolidating after rejecting $356, forming a descending wedge pattern — a bullish continuation setup within the broader channel. The CHoCH at $340 and subsequent BOS at $350 suggest an early reversal base forming.
Bulls need to sustain above $348–$350 to keep short-term momentum alive. A breakout through $356.50–$358.00 could trigger an impulsive move to $363–$372.
Supply & Demand / OB Levels:
* Demand Zone: $340.80–$345.00 (retest area for long setups).
* Supply Zone: $356–$363 (upper wedge + prior liquidity cluster).
Indicator Confluence:
* 9 EMA > 21 EMA after flattening — short-term bullish crossover in progress.
* MACD: Histogram turning positive; signal crossover likely on next push.
* Stoch RSI: Rising from oversold (20–40), confirming fresh bullish momentum.
* Volume: Uptick during intraday pushes; fade on pullbacks — healthy bullish structure.
Trade Scenarios:
* Bullish Setup: Entry $348–$350 → Target $363 / $372 → Stop below $340.
* Bearish Setup: If rejection from $356–$358 → Target $345 / $341 → Stop $360.
A clean breakout above $358 confirms a bullish reversal from wedge compression — potentially setting up for a $373 channel retest.
🕒 15-Minute Chart — Intraday Momentum and Scalping Bias
Market Structure:
AVGO’s 15-min structure shows a tight accumulation range between $348–$356. Buyers defended the lower bound multiple times, confirming intraday liquidity building beneath support. A recent BOS and higher low near $348.5 mark a transition from distribution to re-accumulation.
Supply & Demand / OB Levels:
* Demand Zone: $347.80–$349.50 (intraday OB base).
* Supply Zone: $356.00–$358.00 (scalp resistance & liquidity trap zone).
Indicator Confluence:
* 9 EMA vs 21 EMA: Just starting to curl upward — potential re-entry signal for bulls.
* MACD: Momentum improving; early bullish divergence forming against prior lows.
* Stoch RSI: Rising from 20 to 80 — intraday reversal confirmation.
Scalp Plan:
* Bullish Bias: Long near $349–$350 → Target $355.50 / $358.00 → Stop $347.50.
* Bearish Bias: Short rejection from $358 → Target $349 → Stop $359.
Intraday trend neutral-bullish; price reclaiming $355 would trigger renewed buying momentum toward $360+.
📊 GEX (Gamma Exposure) & Options Sentiment Overview
AVGO’s options landscape supports range-bound stability with potential for a gamma breakout above $370. Dealer positioning remains balanced around $350, suggesting magnet behavior until a strong directional move develops.
Key GEX Levels:
* Highest Positive GEX / Call Wall: $372 (strong resistance + dealer hedging zone).
* Second Call Wall: $365–$368.
* Major Put Support: $340 and $320 (solid floor for mean reversion).
* IVR: 24.1 — low volatility, room for expansion.
* Call Flow: 19.5% — relatively light but could rise sharply on breakout.
Dealer hedging pressure remains neutral below $360, but if AVGO breaks above $365–$372, expect momentum acceleration as short gamma triggers. Below $340, dealers likely provide support via mean reversion hedging.
🎯 Closing Outlook
AVGO remains structurally bullish within its macro uptrend but temporarily compressed between $340–$356. The daily channel remains intact, and short-term indicators show early signs of accumulation.
My focus is on a break and hold above $356–$358, which could kickstart a gamma-driven leg toward $373–$375.
If bulls fail to defend $340, expect a controlled pullback to $325–$330 before re-entry into the broader channel.
Disclaimer:
This analysis is for educational purposes only and not financial advice. Always do your own research and manage your risk.
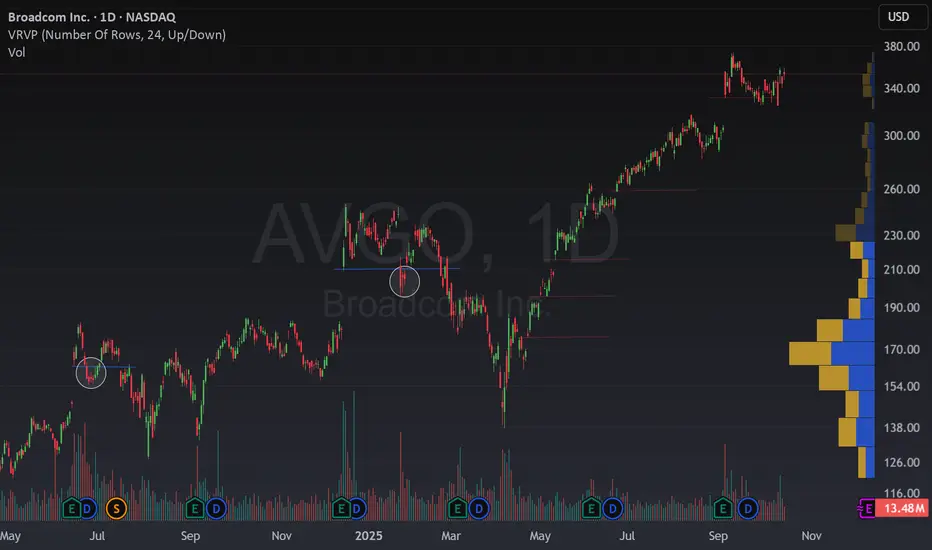
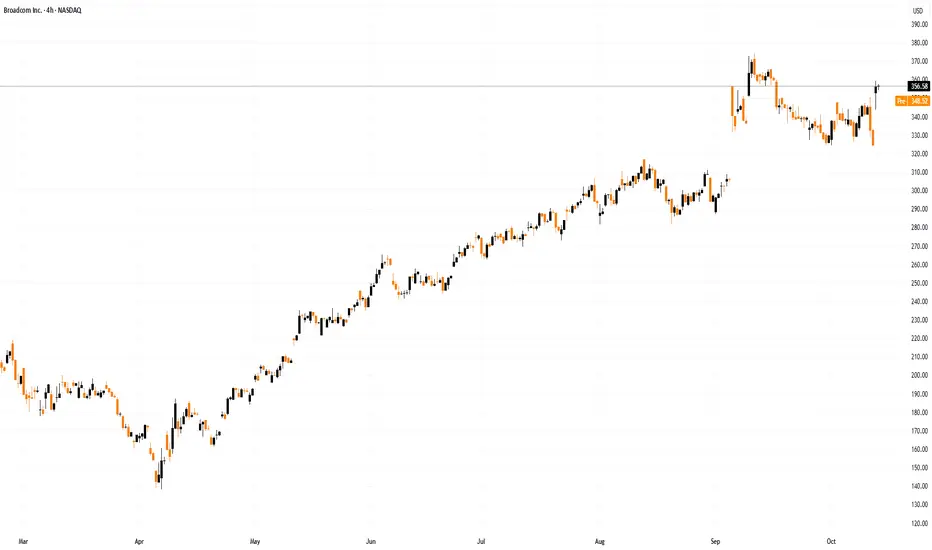
Broadcom’s the Gap-LoverBroadcom has a very particular behavior, it loves to rally in sharp upward bursts.
It often opens with gaps, quickly pushing the price to new levels. Interestingly, the gap zones are never violated during these uptrends.
However, we’ve recently seen a small but concerning move back into a previous gap area.
In past cases, this has been Broadcom’s first bearish signal, often marking the start of a cooling phase. (see white circles for recent behaviour)
That said, this kind of signal doesn’t always mean a full reversal, sometimes it just suggests a sideways consolidation while the buying euphoria takes a breather.
🤔 What do you think?
Will Broadcom respect its usual pattern again… or will this be the first time it ignores it and keeps printing new ATHs?
AVGO watch $355-360: Dual Fib zone resistance holding up new ATHAVGO got a surge from news and then retraced.
Now retesting Dual-Fib zone at $355.42-359.67
Look for Break-n-Retest to enter longs or add.
.
See "Related Pubications" for previous plots such as this perfect BREAK OUT
Hit BOOST and FOLLOW for more such PRECISE and TIMELY charts.
=========================================================
.

Broadcom Shares Surge Nearly 10% on OpenAI Partnership NewsBroadcom (AVGO) Shares Surge Nearly 10% on OpenAI Partnership News
Last month, news of a partnership with OpenAI served as a powerful bullish catalyst for NVIDIA (NVDA) shares. In October, a similar effect can be seen on the Broadcom (AVGO) chart.
According to media reports, the two companies have been collaborating for 18 months but are now making their partnership public. Their plans for 2026 include launching chip racks developed by OpenAI and based on Broadcom technology.
The rally in AVGO shares was further supported by:
→ President Trump’s conciliatory tone following his earlier remarks about imposing 100% tariffs on Chinese goods;
→ the prospect of a meeting between the Chinese and US leaders in South Korea at the end of October, as announced by US Treasury Secretary Scott Bessent.
Technical Analysis of Broadcom (AVGO)
Price movements in mid-2025 formed an upward channel (shown in blue). A strong earnings report in September triggered:
→ a bullish gap at the beginning of the month;
→ an extension of the channel, with the historical high (B) sitting near its upper boundary.
From a bullish perspective:
→ the price remains within the channel, confirming its validity;
→ the pullback to October lows following the A→B impulse can be viewed as a standard correction consistent with classic Fibonacci ratios of 0.5–0.618;
→ yesterday’s rally may represent a breakout of a bullish flag (shown in red) and an attempt to resume the upward trend;
→ within this context, the $315–325 zone appears to be key support for the bulls, while the 10 October low (marked with an arrow) may prove to be a bear trap.
From a bearish perspective:
→ in pre-market trading today, AVGO shares are slightly lower, suggesting the initial reaction may have been overly emotional;
→ the psychological $350 level continues to act as resistance — previous attempts to break above it have failed to hold.
If yesterday’s rally fails to gain traction, it could indicate underlying weakness in AVGO shares, which were unable to capitalise on strong fundamentals to sustain the bullish trend seen earlier in 2025.
This article represents the opinion of the Companies operating under the FXOpen brand only. It is not to be construed as an offer, solicitation, or recommendation with respect to products and services provided by the Companies operating under the FXOpen brand, nor is it to be considered financial advice.
$AVGO Call Alert – Oct 31 ’25 $345 Calls | 125% ROI PotentialEnter: NASDAQ:AVGO OCT 31 2025 $345 CALLS
Buy in Price: $14.89 - $15.15
Take Profit: $33.50
Stop Bleeding: $13.10
ROI Potential: 125%
Exit Within: 167 Minutes

AVGO OCT 2025AVGO (4H): Rejected at 350–345 and still trading under the descending trendline. Distribution overhead persists into 370 where heavy sell programs hit. If buyers can absorb above 345, momentum can shift; otherwise, watch the 316 gap and the 300–290 base for further absorption.
• Upside targets: 370 first; extension 390 on a clean break and hold above 370.
• Downside targets: 316 gap fill; extension 300–290. A failure there opens 249.
#AVGO #globaltrade #investment #investing #stockmarket #wealth #realestate #markets #economy #finance #money #forex #trading #price #business #currency #blockchain #crypto #cryptocurrency #airdrop #btc #ethereum #ico #altcoin #cryptonews #Bitcoin #ipo

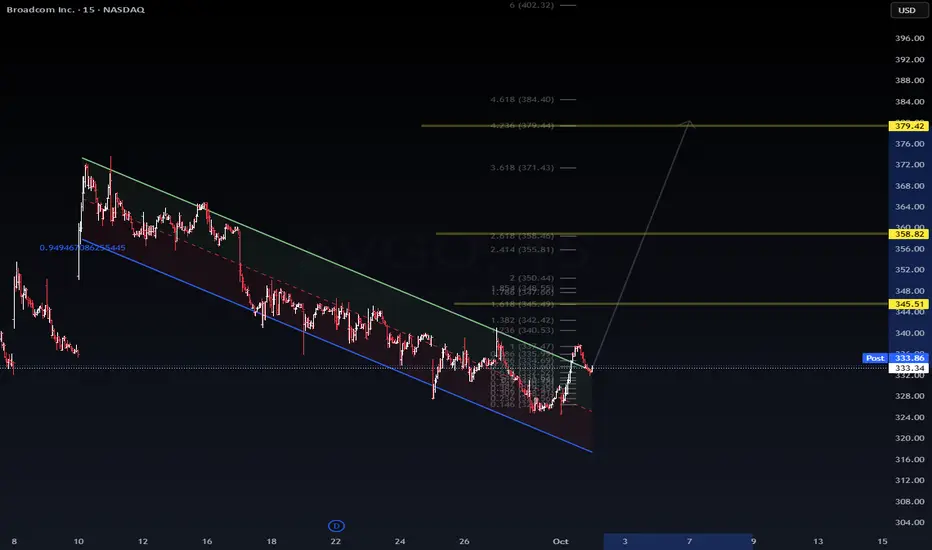
$AVGO | Broadcom – Institutional DSS ProjectionNASDAQ:AVGO | Broadcom – Institutional DSS Projection
Price has broken out of the descending channel and is testing early reversal confirmation.
Immediate resistance: $340.50 – $345.51
Mid-term target: $358.82 (Fib 2.618)
Extended projection: $379.42 (Fib 4.236)
Institutional model suggests accumulation in this zone, with upside momentum building if $334 support holds. Downside invalidation below $328.
📊 Watching for liquidity rotation from semis back into megacaps. AVGO aligned with tech-sector resilience ahead of earnings season.
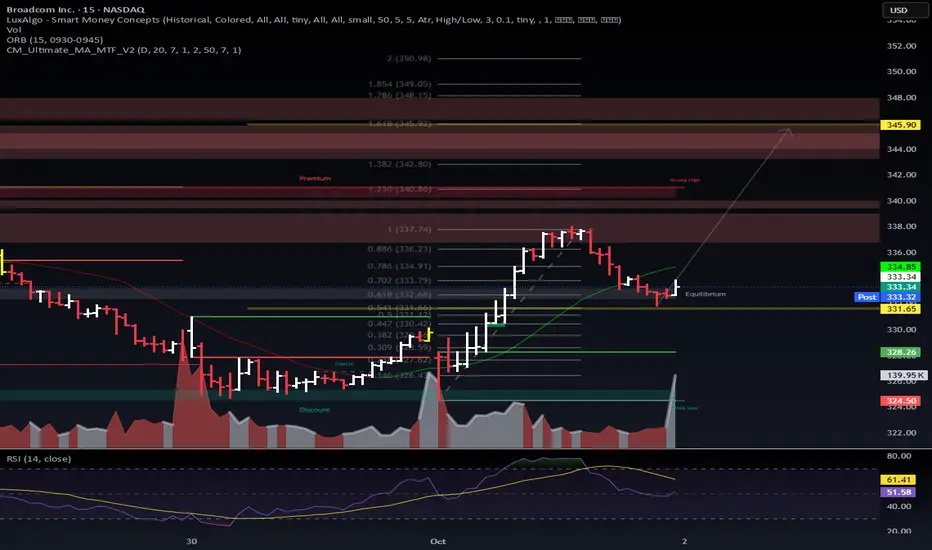
$AVGO – Flow + TA Alignment📈 NASDAQ:AVGO – Flow + TA Alignment
AVGO sitting at equilibrium (~332–333) after tagging resistance. Options flow + fib extensions are pointing toward the next magnet zone.
🔑 Key Levels
Support: 330 → invalidation level.
Short-term target: 346–348 (1.618 fib + heavy call flow strikes).
Mid-term target: 354–356 (Wave (5) projection, aligned with Oct expiries).
Stretch target: 380 (OTM call bets).
🧭 Roadmap
Holding 332–330 → expect quick move into 346–348.
If buyers sustain momentum → extension toward 354–356.
Flow confirms: institutions stacked size on 342.5C, 345C, 340C for October.
Breakdown under 330 = risk back to 328/324 demand.
📊 Flow + TA Confluence
The yellow projection curve shows how options activity + fib mapping align into October.
Heavy near-dated call flow = 345–348 magnet.
Mid-month flow + Elliott count = 354–356 extension.
Outlier 380C = possible overshoot if semis squeeze.
🚀 Outlook: AVGO has confluence into 346 short-term, with Wave 5 potential into mid-350s. Flow + TA speak the same language.
#AVGO #OptionsFlow #VolanX #ElliottWave #AITrading
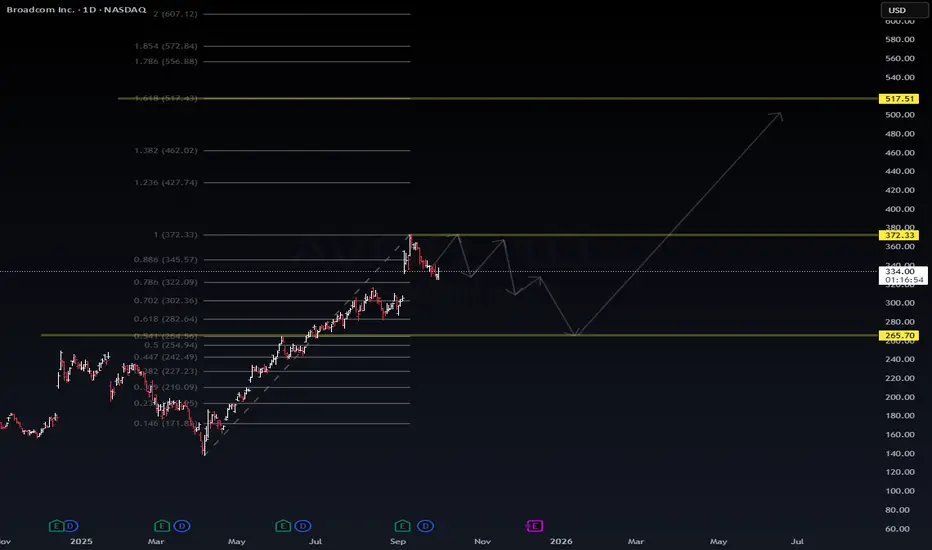
$AVGO | Decision Zone – Bounce or Deeper Pullback?NASDAQ:AVGO | Decision Zone – Bounce or Deeper Pullback?
🔹 Technicals
Current: 333.9 (+1.2%)
Fib retracement showing key levels:
372.3 = resistance / upside pivot
322.0 → 302.0 = short-term support band
265.7 = deeper liquidity target if breakdown extends
Larger fib extensions point toward 517.5+ on sustained uptrend.
🔹 Scenarios
🟢 Bullish Path:
Hold 322–333 support → reclaim 372 → path opens toward 400 → 517.
🔴 Bearish Path:
Failure at 333–322 → momentum drags into 302 → 265 before long-term buyers step in.
📌 Summary
NASDAQ:AVGO sitting mid-structure. 372 is the bull trigger, 322 is the bear trigger. Watch liquidity rotation here for the next major leg.
#AVGO #Semiconductors #AI #Trading
BROADCOM Rejection at the top of 3-year Channel Up possible. Last time we looked at Broadcom Inc. (AVGO) was more than 3 months ago (June 10, see chart below), where we gave a buy signal, targeting $320:
The price is now on the 2nd straight red week after it marginally breached above its 3-year Channel Up, and if it closes in red eventually, we will have a strong technical case for a rejection pull-back.
As you can see, every time the 1W RSI got that overbought and got rejected on its 4-year Resistance Zone, it always corrected back to its 1D MA100 (red trend-line).
Technically that should be the next medium-term buy entry point to finish the year with a $400 Target.
-------------------------------------------------------------------------------
** Please LIKE 👍, FOLLOW ✅, SHARE 🙌 and COMMENT ✍ if you enjoy this idea! Also share your ideas and charts in the comments section below! This is best way to keep it relevant, support us, keep the content here free and allow the idea to reach as many people as possible. **
-------------------------------------------------------------------------------
💸💸💸💸💸💸
👇 👇 👇 👇 👇 👇