DPZ - Same pattern repeating perfectlyIt's incredible how much information and confirmation we can get from the algorithms. My last DPZ video goes into the HTF chart and the incoming bullish picture.
But in this video, as I did in the last, I am showing you why we're heading lower for the time being and how we're setting up perfectly for continuation.
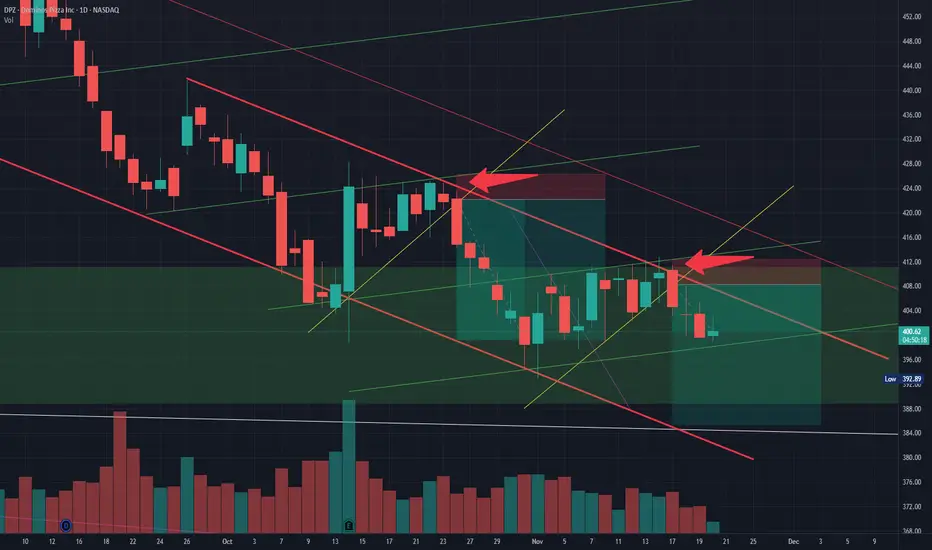
Where you see two arrows, you see price respecting a green tapered buying (which is a bearish liquidity builder). In addition, we are at the top of our red strong selling channel (which is selling continuation). Since green is there in order to help us continue lower and red is there to do just that, it proves itself over yellow (you see the dump that happens once we fall out of yellow - that's because green proved itself and we're heading down to and bellow green).
We see that exact thing happening again now. The second arrow is where I made the last video discussing the short opportunity down to the $480 level. We have since dropped out of strong yellow and are now proving green. What does that mean? DUMP!
So with the alignment of all these algorithms and most importantly a HTF intentional area below (massive liquidity sitting at $393), we have every reason to want to come down a bit before a larger move upward. And the algorithms are agreeing.
Happy Trading :)
Domino's Pizza, Inc. Unsponsored Brazilian Depositary Receipt Repr 0.02 Sh
No trades
Trade ideas
Same Algorithms, Different Timeframes — Structure RepeatsThis is a great visual representation of what multi-timeframe analysis really looks like — a chart within a larger chart within an even larger chart.
When you start aligning these timeframes and spotting consistencies, you unlock a new dimension of clarity in price behavior.
I use this to pinpoint where liquidity has been built and which algorithms need to be activated or proven for a healthy continuation. It’s also how I manage risk — by being able to execute on the lowest timeframe that aligns with my higher-timeframe thesis.
As you’ll see in the video, this chart’s algorithmic structure repeats beautifully — from the hourly all the way up to the weekly.
Current Story:
The HTF shows a major bullish liquidity build within white tapered selling, now in the process of disproving the stronger purple algorithm. If we can hold white support around $380–390, the market is essentially signaling a move toward the sell-side of its HTF white algorithm.
However, on the LTF, we’re still under the control of a strong red selling structure . Until we see tapering there — and ultimately a break of red — there’s no reason to rush a long. That’s step one.
Structure’s clear. Now it’s about patience and precision.
Happy Trading :)

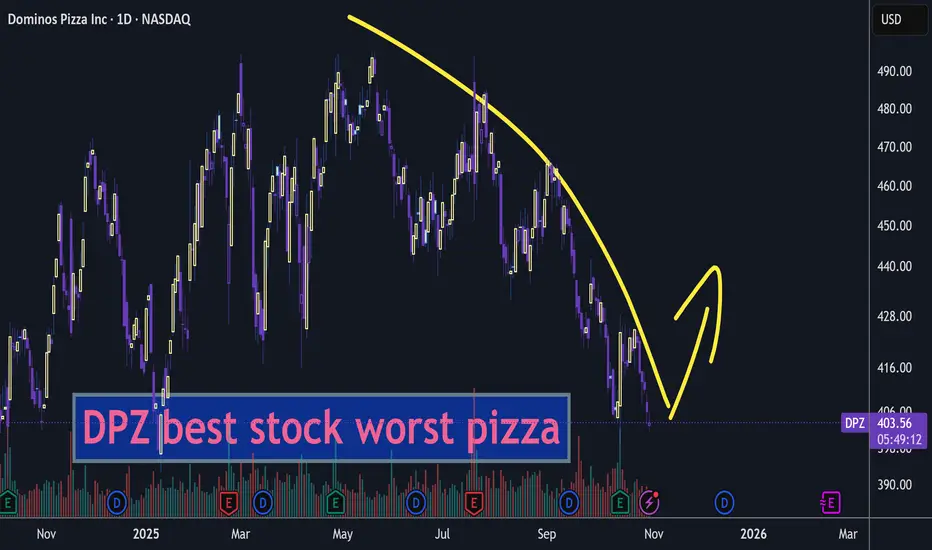
DPZ - The market is setting up for something...The formations of "Cup & handles" as well as "Head & shoulders" are just visual ways to describe what the market is doing to be efficient.
The market's efficiency of course runs on the basic concept of supply & demand - but in order for that to happen efficiently, we need to constantly fight it out on multiple time frames to remove a certain side and then replenish at lower and higher levels.
In DPZ's case, we are looking to shake off buyers (built up at the $400 support level) in order to re-introduce newer and larger buyers at lower levels - subsequently replenishing buyers while also 'trapping' sellers.
This constant game of cat and mouse happens throughout all time frames - and is a big reason why most traders feel like they are constantly losing and that the market is against them - because it is!
Enough of the lesson - my thesis here is the market is intentionally building a large support base in order to break through, lose buyers (stopped out), trap sellers, and give the opportunity to big money to enter positions at attractive prices.
Target Entry: $380
Target Exit (Short term): $450
Target Exit (Long Term): $530
Happy Trading :)

Dominos pizza +10%DPZ is the stock ticker for Domino's Pizza, Inc., a pizza restaurant operator and franchisor that generates revenue from company-owned and franchise stores, as well as its supply chain network. The company sells a variety of menu items, including pizza, wings, and desserts, and is the largest pizza company globally.
DPZ watch $496/497: Double Fib resistance to possible new ATHDPZ has been range bound for a while.
Up against a double fib barrier into earnings.
Look for reject or break of $296.58-497.08

DPZ - Very Bullish Chart!All I needed to see was this most recent white algorithm respecting and I'm interested. Automatically catches my eye when I see us respecting such a tapered algorithm on both the buy and sell side on the HTF. This, in my opinion, is poised for a pretty large breakout.
Happy Trading :)

Breaking: Domino's Pizza Reports Weaker-Than-Expected Q1 RevenueShares of Domino's Pizza (NASDAQ: NASDAQ:DPZ ) moved lower in premarket trading Monday after the pizza delivery giant reported weaker-than-expected first-quarter revenue and U.S. same-store sales.
The Ann Arbor, Mich.-based company posted earnings per share (EPS) of $4.33 on revenue that increased 2.5% year-over-year to $1.11 billion. Analysts polled by Visible Alpha expected $4.04 and $1.13 billion, respectively.
Same-store sales among Domino's U.S. locations fell by 0.5% year-over-year, worse than the 0.22% bump analysts had forecast. International same store sales excluding foreign currency impacts were up 3.7%, topping the 1.88% growth analysts were expecting.
CEO Russell Weiner said the company continues to operate in a "challenging global macroeconomic environment," but said Domino's is continuing to gain market share in the U.S. and internationally.
Earlier this month, Domino's announced a new partnership with DoorDash (DASH), with the pizza chain's food set to be available through the latter's app beginning in May, once its exclusive agreement with Uber (UBER) Eats expires. Domino's has said it believes the third-party delivery market could eventually generate $1 billion in sales.
Domino's shares, which entered Monday up 16% in 2025, were down 2% shortly after the report was released.
Technical Outlook
As of the time of writing, NASDAQ:DPZ shares are down 1.66% in Monday's premarket session, albeit the earnings missed. With the RSI at 64, NASDAQ:DPZ is strong enough to hold the current resistant point. However, should selling pressure increased, shares of NASDAQ:DPZ could retraced touching the $399 support zone.
Similarly, the $500 resistant point is still in play, should the bulls take over.

DPZ Cup with Handle?Weekly chart showing a cup with handle on DPZ. Earnings on 4/28/25. I like this play during uncertain times and a possible recession. Dominos Pizza, I believe has improved their products and service year over year including their app, their food, and their customer service. When people cut back on dining out they order in more to save money.
Technicals are lining up with the possible story here. Definitely worth keeping an eye on.

DPZ - Another Trade of the Year Candidate!I did a video on DPZ and why I was bullish a few months ago but this video is regarding a more recent snipe trade - post earnings getting filled on shares at a level that I had sitting and waiting. That's the beauty of shares and algorithms! Within day 1 the position was up upwards of 5% because of the confidence we have in our algos!
Happy trading :)

$DPZ Pre-Earnings Front-RunFrom a technical perspective everything looks primed for a pre-earnings rally for $DPZ. With about eight trading days prior to reporting I expect a move to the upside.
Trade Risk Reward is about 1:1 with SL of $450 Daily Close and PT of ~$500.
Happy Trading.
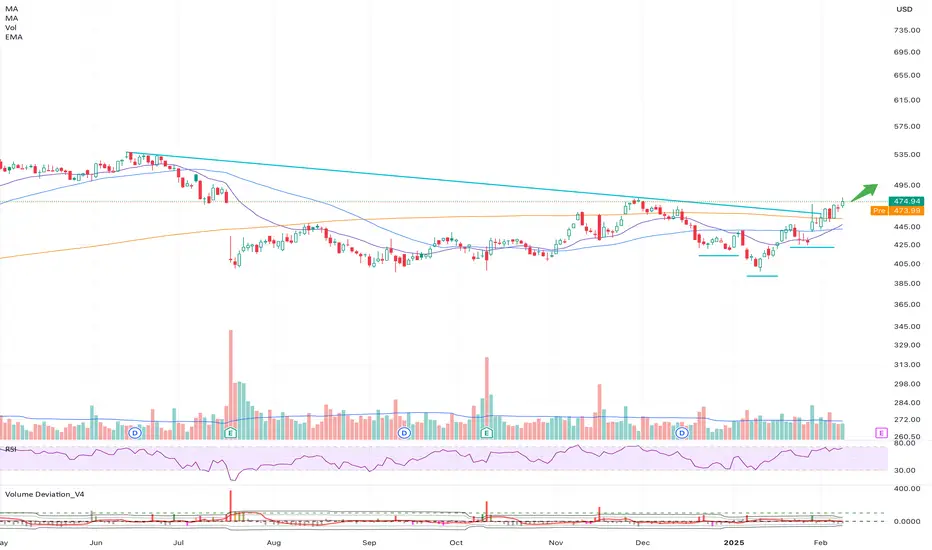
Pre-Market Update: DPZ Potential Option Play into EarningsDPZ is currently sitting a very Strong Support Buy Zone. With this one, we're just watching due to DPZ breaking below it's lower longer-term support level but was completely on low-volume. DMZ does have earnings coming up on Feb. 20th, 2025, which it typically not only does well in February Earnings historically, but DPZ has consecutively beat the street on expectations set.
At best place this on a watchlist or look at potentially options going into earnings to the upside. With that, we would look at the $440 - $460 Price Levels see a Resistance Retest and break higher going into earnings at best.
Connect with us by following the links in the signature below to get more Free Tools and Resources at @MyMIWallet #MyMIWallet
