ES - December 4th - Daily Trade PlanDecember 4th- Daily Trade Plan - 8:30am
*Before reading this trade plan, if you did not read yesterday's take the time to read it first! (You can view the posts in the related publication section) *
If my posts provide quality information that has helped you with your trading journey. Feel free to boost it for others to find and learn, also!
My daily trade plan and real-time notes that I post are intended for myself to easily be able to go back and review my plan and how I did from an execution perspective.
--------------------------------------------------------------------------------------------------------
You can review my trade plan from yesterday and the daily note updates to see which levels we grabbed points from.
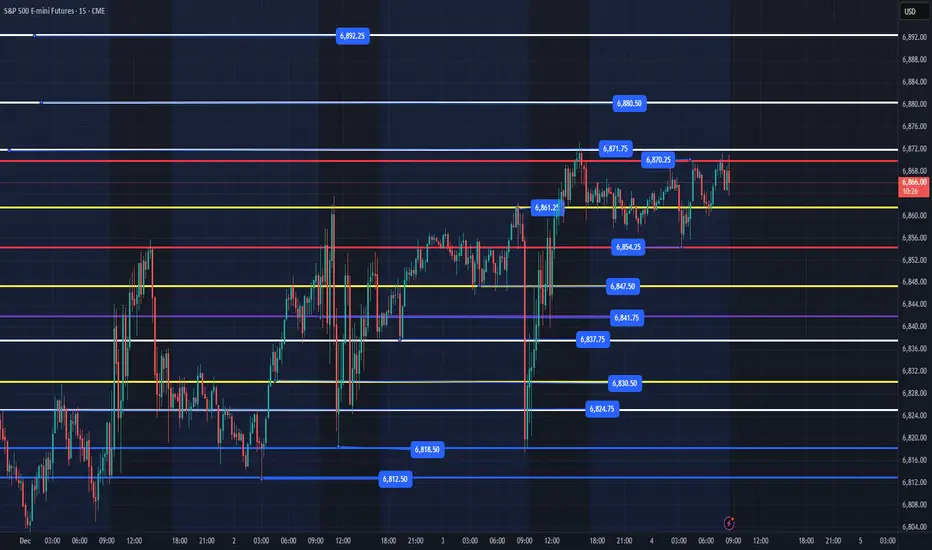
Overnight we have been building a nice bull flag between 6854-6870. Looking at the bigger picture price looks like it wants to go higher and break out of this range we have been. My general lean today is that we have a flush and reclaim of 6854 before heading up. We might only get as low as 6861. IF price loses 6818 then we should move lower.
Key Levels Today
1. 6861 flush and reclaim
2. 6854 flush and reclaim
3. 6847 flush and reclaim
4. 6837 flush and reclaim
5. 6818 flush and reclaim (wait for reclaim of 6824)
Below these levels and price will most likely be selling off and I would be getting out the way and let price find a level below to reclaim and move higher.
I will post an update around 10am EST
----------------------------------------------------------------------------------------------------------------
Couple of things about how I color code my levels.
1. Purple shows a current or prior weekly low
2. Red shows the current overnight session High/Low (time of post)
3. Blue shows the previous day's session Low (also other previous day's lows)
4. Yellow shows core support/resistance levels
5. White shows overhead resistance/targets
S&P 500 Index Futures
No trades
Market insights
Inside and only slightly higher dayThe structure in the daily chart for the S&P 500 implies an inside day and slightly higher for the Thursday trading session.

ES_F Bulls Are On The RopesToday price continued on the recent path of weakness and it looks like Bears are throwing some heavier punches at the Bulls. Will the Bulls wake up after four straight red days or will they keep taking some more shots to the chin before their manager throws in the towel? If we take a step back and zoom out to the Daily chart we can see that the overall uptrend is still in tact and I wouldn’t consider this totally broken unless we lose 6600/6585. On one hand that is a good sign for the Bulls but it also shows that we could lose another 200 points before this weakness lets up. On the shorter time frame that I use for our daily levels things aren’t looking so rosy. Today price broke through and held below the 50MA(6831) and we are also seeing the 8MA(6872) just about to cross down below the 21MA(6871). We also broke back into the flag structure that we broke out of right after Thanksgiving and we are testing a rising trendline that goes back to April. Bulls really need to show some life here or we are going to see continued weakness as the Bears press for the 100MA(6718).
You can follow the levels in more detail on my Substack (link in bio).

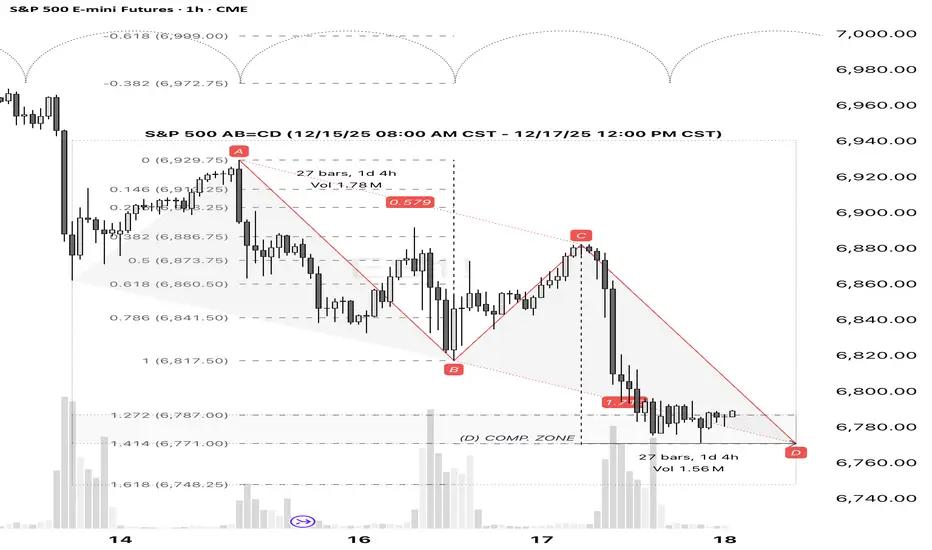
SPX: AB=CD Pattern Completion Suggests Long SetupS&P 500 (SPX) - Technical Analysis: Bullish Reversal Signal at AB=CD Completion
1. Pattern Recognition:
A classic bullish AB=CD harmonic pattern has reached its precise completion point (D). This validates the designated support zone as a significant technical area where buyer momentum is anticipated to overcome recent selling pressure.
2. Market Structure Implications:
The successful completion of this pattern suggests:
· The establishment of a firm, technically-defined support level.
· Exhaustion of the prior downward (CD) leg.
· An increased probability of a mean-reversion move higher, targeting a retracement of the recent decline.
3. Trade Thesis & Risk Management:
The confluence at the D point presents a favorable risk/reward opportunity for a long position.
· Action: Initiate long positions.
· Entry Zone: At or near the pattern's D completion point.
· Invalidation Level: A decisive close below the D point invalidates the pattern structure. Place stop loss accordingly.
· Primary Target: The 0.618 Fibonacci retracement of the CD leg.
· Secondary Target: The initiation point (C) of the pattern.
ES (SPX, SPY) Analysis, Key Levels, Setups for Thu (Dec 18)TOMORROW EVENT STACK (ET)
07:00 - Bank of England rate decision + statement
04:00 - Norges Bank rate decision (Norway)
08:15 - ECB policy statement release
08:30 - CPI (Nov) + Real Earnings (Nov)
08:30 - Initial Jobless Claims
08:30 - Philly Fed Manufacturing (Dec)
08:30 - ECB press conference begins (adds FX noise, CPI still dominates ES)
High-impact window: The peak whip risk occurs from 08:30 to 08:45 ET. After the market opens at 09:30, it often either continues the 08:30 trend or reverses back to fair value.
October CPI Release and Its Implications
The absence of the October CPI data from the Bureau of Labor Statistics (BLS) introduces significant complexity to the upcoming November CPI release. Notably, the November figures will omit certain one-month percent changes due to the missing October data. This gap is likely to lead to increased volatility in market reactions, as traders may rely more heavily on year-over-year comparisons and overarching narratives. It's important to emphasize that this presents a data-quality risk rather than a straightforward price forecast.
Current projections from Reuters indicate a CPI rise of 0.3% month-over-month, with a year-over-year increase of 3.1%. Additionally, core CPI is expected to mirror this 0.3% monthly change, while the year-over-year core figure is anticipated to remain at 3.0%. These benchmarks represent the market's baseline, and any significant deviation—either a miss or beat—could trigger a pronounced market reaction.
Navigating Market Dynamics: A Practical Guide for E-mini S&P Traders
- Hot Scenario: A core CPI increase of 0.4% or more, or any unexpected data that raises inflation concerns, is likely to drive yields upward. In this case, E-mini S&P futures may see selling pressure on initial rebounds, as traders react to renewed inflation fears and test support levels.
- Cool Scenario: Conversely, if the core CPI prints at 0.2% or below, or if there’s a clear downside surprise against expectations, we might witness a drop in yields. This scenario could facilitate a breakout for E-mini S&P futures, allowing for upward progression through resistance levels as shorts are squeezed.
- In-Line Scenario: The market may react chaotically to the initial news, but typically, direction stabilizes upon the first pullback following the 09:30 cash market open.
To ensure effective trading during the CPI release, adhere to the following guidelines:
1. Avoid initiating new positions in the final 60 seconds leading up to the 08:30 release.
2. Establish four key reference points: the high and low of the pre-CPI trading range (08:20-08:29) and the high and low resulting from the CPI spike (08:30-08:33). These levels frequently serve as pivotal points for price action during the first 30 to 90 minutes of trading post-release.
By keeping these dynamics in mind, traders can better navigate the potentially tumultuous waters of the upcoming CPI announcement.
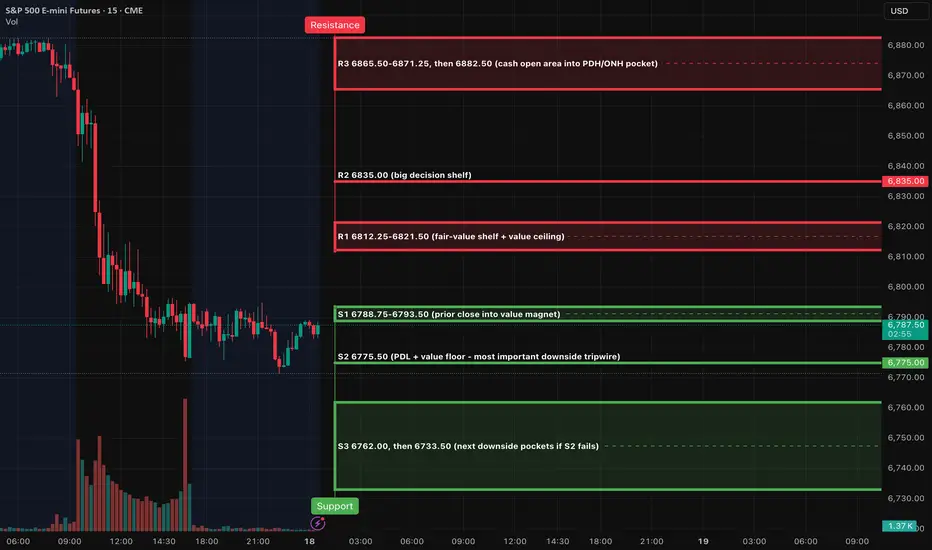
Market Analysis: Short-Term Outlook
In the broader context, the recent trading action suggests a failure to maintain momentum after reaching the upper resistance band. The most recent price structure indicates a downward trend, with the market currently trading below key resistance levels. For upcoming sessions, this is critical; any attempts at upward movement will need to overcome the 6821-6835 range to signify a genuine reversal rather than mere corrective action.
On the 4-hour timeframe, we observe a distinct sell-off followed by a consolidation phase. There are several resistance zones left untested from the recent decline, which could hinder any potential rallies. The immediate resistance is located between 6812 and 6821, with a higher barrier at 6835. Should the price exceed 6835, it might have the potential to rally toward the 6865-6882 range.
The 1-hour perspective reveals a classic pattern characterized by a sharp decline followed by a basing phase. Notably, trading volume surged during the sell-off before tapering as prices stabilized near the close. This dynamic sets the stage for either a rebound toward immediate resistance levels or a further decline if the established support fails.
The oscillator is currently in a deeply oversold position, registering in the low teens and beginning to show signs of a potential upward turn. This development suggests some bounce potential, although it does not guarantee a trend reversal on its own. A credible shift in trend will require the price to reclaim the R1 resistance and maintain levels above R2.
Overnight Market Outlook: NY Session Forecast
Base Case Scenario (Pre-CPI): Anticipate a period of rotational trading between support level S2 at 6775.50 and resistance range R1 at 6812-6821.
Bullish Scenario: Should the market hold at S2, a reclaim of R1 would be crucial. A successful transition of R2 (6835) from a resistance level to a support floor could propel prices toward R3 (6865-6871), with the potential to reach 6882.50 if bullish momentum remains strong.
Bearish Scenario: Conversely, if the market slips below S2 and fails to reclaim the 6775.50 level, we could see a decline towards S3 at 6762, with a further slide to 6733.50 if selling pressure intensifies.
A++ Setup 1 - Short Position (Rejection at Resistance Level 1)
Entry Criteria: Monitor the market for a minimum of 30 minutes. The ideal entry is between 6816.00 and 6821.00.
- Stop Loss (SL): 6838.00
- Take Profit (TP) Targets:
- TP1: 6775.50
- TP2: 6762.00
- TP3: 6733.50
**Invalidation Point:** The setup will be invalidated if price sustains above 6835.00.
A++ Setup 2 - Long Position (Continuation through Resistance Level 2)
Entry Criteria: Again, monitor for a duration of at least 30 minutes. The target entry range is between 6830.00 and 6836.00.
- Stop Loss (SL): 6818.50
- Take Profit (TP) Targets:
- TP1: 6871.25
- TP2: 6882.50
- TP3: 6936.25
Invalidation Point: The trade will be considered invalid if there is a decisive drop back below 6821.50 after the reclaim action.
Good Luck !!!
ES UpdateNow that futures went red, you can see ES touched oversold.
Not sure how far it needs to go oversold before we get a bounce tomorrow.

MES. Short (1h) 12.18.25Bias: Bearish on 1H
Context: Strong downside impulse followed by a corrective bounce.
Location: Short taken into EMA 20. Invalidation above SL.
Confirmation: Bounce failed to hold above EMA 20 and rolled over.
Entry: RTH
- 15min Rejection candle during RTH
- Close back below the zone or below EMA 20.
Target: Rotation back toward recent lows
R:R: ~1:3.3
Session: Executed during RTH. Avoid first 5min of the market

Inside day for ThursdayThe expectation for price action in the S&P 500 daily chart is an inside day for Thursday. This would be typical behavior unless we get new fundamental information to change the markets attitude towards this index.

RSI Is Measuring What You’re Already TradingThe Relative Strength Index (RSI) is one of the most persistent tools in technical analysis. Despite being widely available and heavily discussed, it is frequently misapplied. Its reputation as a “basic” oscillator has led many traders to underestimate its true function.
RSI was never designed as a buy/sell signal generator. It is a momentum framework, quantifying internal strength, participation, and directional efficiency in price movement.
This article examines RSI from a professional perspective: its mathematical structure, its behavior across market regimes, and why it remains relevant in modern discretionary and institutional analysis.
📈 RSI’s Mathematical Construction (Why It’s Still Relevant) 📈
RSI was introduced by J. Welles Wilder Jr. in 1978 and is built on a smoothed comparison of average gains versus average losses over a fixed lookback period.
The key element is Wilder’s smoothing, which creates continuity in momentum measurement. Unlike raw rate-of-change or unfiltered oscillators, RSI reduces short-term randomness while preserving meaningful changes in directional pressure.
Mathematically, RSI functions as:
a normalized momentum ratio
a bounded statistical model
a low-noise momentum estimator
This structure allows RSI to remain comparable across:
assets
volatility regimes
timeframes
This is not a subjective advantage — it is a mathematical one.
📈 RSI as a Momentum Diagnostic, Not a Signal 📈
One of the most common misunderstandings is treating RSI as a trigger.
In professional analysis, RSI answers state-based questions, not directional predictions:
Is momentum expanding or contracting?
Is price movement internally supported?
Is participation increasing or deteriorating?
RSI evaluates momentum quality, not outcome.
Price can move higher while momentum weakens.
Price can stall while momentum builds.
RSI exists to measure that internal condition.
📈 RSI Behavior Across Market Regimes 📈
In strong directional markets, RSI behaves asymmetrically:
Bullish trends:
RSI typically holds above 40–50
Pullbacks show shallow momentum retracements
Bearish trends:
RSI caps below 60
Rallies fail internally
This behavior reflects momentum compression, not randomness.
📈 Divergence: What It Actually Tells You 📈
RSI divergence is often framed as a reversal signal. This is inaccurate.
Divergence measures internal inefficiency, price is extending, but momentum is no longer confirming.
This implies:
decreasing participation
reduced directional efficiency
increased probability of consolidation or structural change
It does not guarantee reversal timing.
Institutions interpret divergence as risk information, not entries.
📈 Why RSI Still Appears in Professional Analysis 📈
RSI remains in use because it performs well under scrutiny:
It adapts to volatility
It survives backtesting across decades
It identifies regime changes earlier than lagging indicators
It complements price instead of competing with it
Institutions do not use RSI mechanically.
They use it contextually.
Common professional applications include:
identifying crowded momentum
comparing relative strength across correlated assets
monitoring momentum decay during position management
validating regime persistence
RSI’s durability comes from statistical reliability, not popularity.
📈 Conclusion 📈
RSI is not outdated.
It is frequently misunderstood.
When used as a momentum and regime framework, RSI provides information that price alone cannot. Its value lies in diagnosing market condition, not predicting outcome.
For traders who move beyond simplistic interpretations, RSI remains one of the most reliable analytical tools available.

ES_F Starting To Gain Some Bearish MomentumPrice cracked the 21MA today and is now testing the 50MA. I am leaning short as long as we stay below the 21MA and will press shorts if Bears can start pushing this below the 50MA.
I share detailed levels and a long and short plan for both ES_F and SP:SPX over on Substack. Please check out the link in my Bio and subscribe.

Short: MES Bias: Bearish
Context: Postimpse pull back to EMA20, into EMA50
Entry: Sell limit into EMA 20 in to 50
Rotation back towards recent low, cont. w/in range
RR: 1.2.5-1:3
Action Fixed target

ES Daily: Bearish Divergence Detected at Resistance — Caution Taking a step back to the daily timeframe on ES. After the strong November rally, we're seeing some warning signs develop at these levels.
Recon Summary:
Coil: CHOPPY — avoid trend trades
Rush: Momentum FADING but direction still bullish
Venom: CONTESTED — no clear buyer/seller control
Strike: LONG position active, but "watch momentum" warning
MTF: LTFs BEARISH (60 + 240) vs HTFs BULLISH (1W + 1M) — classic timeframe divergence
Pulse: Momentum UP 9 bars (avg 27, 90th: 55)
Snap: BEARISH DIVERGENCE detected
Fangs: Support 6805 | Resist 6900.5
Recon is flagging "BEARISH DIVERGENCE - momentum fading" This is significant. Price pushed to new highs but momentum didn't confirm. Snap is picking up the divergence and Recon is synthesizing it into a clear warning. Venom shows CONTESTED control with pressure at just 4.6 and flow FALLING. Volume is LOW. Nobody's committing here. Rush tells an interesting story — direction is BULLISH with STRONG strength (86%), but momentum is FALLING and market state is CHOP. That 86% strength reading is residual from the November move, but the fading momentum and chop state suggest distribution may be underway. My read: The weekly and monthly remain bullish (HTFs BULLISH 1W + 1M), but shorter timeframes are rolling over (LTFs BEARISH 60 + 240). With bearish divergence confirmed and momentum fading at resistance near 6900, this looks like a pullback setup rather than a continuation buy. Watching 6805 support — a break there opens 6630-6500. Bulls need to reclaim momentum above 6900 to invalidate. Not chasing longs here. Wouldn't go short. Stay Neutral.

ES_F is chopping. Watch levels below for moves up and down.Here are the major levels I would watch today for #ES_F. We had a nice trade during globex when price broke down 6795 and hit our target at 6775. This plan was shared before it happened on Substack (link in Bio). Price bounced off of that test and we want to see how it reacts at the 21MA(6825). Break/hold above is a long and holding below is a short back down to 6795. Check the Substack post for more levels on both sides. Have a good day!
AMEX:SPY , SP:SPX , $ES_F, $NQ_F

Day 82 — Falling Asleep During the Session (But Still Green)Ended the day +$130 trading S&P Futures. I came into the session bearish, spotting a setup right at the 10-minute resistance. I managed to execute a short at the open and secure the profit, but the reality of trading US markets from Asia hours caught up with me. I was completely exhausted and literally fell asleep right after that first trade. While I’m happy to be green, it stings to wake up and realize I missed some great movements, including a perfect chance to go long when the market hit the oversold and longer-timeframe MOB levels.
📰 News Highlights
*DOW, S&P 500, NASDAQ END LOWER AS TECH STOCKS TUMBLE AHEAD OF JOBS REPORT
🔔 VX Algo Signals
9:42 AM — MES Market Structure flipped bearish (X3) ✅ 10:40 AM — VXAlgo ES X1 Oversold signal ✅
2 out of 2 signals worked — 100% accuracy today.
🔑 Key Levels for Tomorrow
Above 6925 = Bullish Below 6910 = Bearish

Long positionEntered long.
looking for a test of the upper blue trend line which is part of a larger falling wedge. would ber nice to rally past it.

ES_F Bulls May Be Running Out of GasToday price tested that 21MA(6826) and still held it but bulls are looking weak here and really need to step up or the Bears are going to start smiling as they push price back into our previous downtrend and try to test the 50MA(6775). I don’t like how the Bulls have failed on their rally attempts above 6900 and I also don’t love that the 8 and 21MA are starting to curl down as price failed to break that lower high we were testing last week. The Bulls still have a chance here if they can hold the 21MA but price is testing below this level as I type this and they haven’t stepped up at all last week so I will be cautious and open to both sides depending on how this action plays out. Check out my Substack post for detailed levels and plans (link in Bio).


ES | Wk 5`T.A explained -
BackSide (BS)
FrontSide (FS)
Inverse BS (Inv.BS)
Inverse FS (Inv.FS)
BS & FS levels are expected support when dashed lines, tested when dotted and resistance when solid lines.
The inverse is true for the Inv. BS Inv. FS levels, they are resistance as dashed lines, tested as dotted and support as solid lines.
Monthly timeframe is color pink
weekly grey
daily is red
4hr is orange
1hr is yellow
15min is blue
5min is green if they are shown.
strength favors the higher timeframe.
2x dotted levels are origin levels where trends have or will originate. When trends break, price will target the origin of the trend. its math, when the trend breaks, the vertex breaks too so the higher timeframe level/trend that breaks, the more volatility there could be as strength in the orders flow in to fuel the move.

ES_F is at a crossroads for Bulls and BearsBulls are trying to hang on to the breakout and Bears are trying to break the 21MA(6826). We have some familiar levels from last week as we are back in the same choppy range that we were stuck in previously. Short term resistance is at 6865 and short term support is at 6826. I would be bullish on a break/hold above resistance to target 6890 and I would be short on a break/hold below support to target 6805.
I share a lot more levels and discussion on Substack which you can find in my signature.

ES | Week 50 | 1hr chartT.A explained -
BackSide (BS)
FrontSide (FS)
Inverse BS (Inv.BS)
Inverse FS (Inv.FS)
BS & FS levels are expected support when dashed lines, tested when dotted and resistance when solid lines.
The inverse is true for the Inv. BS Inv. FS levels, they are resistance as dashed lines, tested as dotted and support as solid lines.
Monthly timeframe is color pink
weekly grey
daily is red
4hr is orange
1hr is yellow
15min is blue
5min is green if they are shown.
strength favors the higher timeframe.
2x dotted levels are origin levels where trends have or will originate. When trends break, price will target the origin of the trend. its math, when the trend breaks, the vertex breaks too so the higher timeframe level/trend that breaks, the more volatility there could be as strength in the orders flow in to fuel the move.

SP500 Intraday LONG Trade No. 2 Trade for the Day Series - #ESHSP500 Intraday LONG Trade No. 2 in The Trade of the Day Series – #ESZ2025
Looking for a move up from approx. current level (value area) via intraday continuation 📈
Expecting a rotation higher with step-by-step acceptance toward: TP1 → TP2 → TP3, + potential extension toward TP4 in case we get a final melt-up.
Let’s see how the day unfolds 👀
#ESFutures #SP500

Can buyers follow throughCan buyers follow through on the daily structure in the S&P 500 on Friday? Buyers reentered the market on Thursday but the real test will be the closing price and the level of confidence shown by these buyers with a positive close.

Inflation Impact on the Market1. Impact on Stock Market
Inflation influences stock markets in complex ways, creating both opportunities and risks for traders and investors.
a. Corporate Earnings and Profit Margins
When inflation rises, companies face higher costs for raw materials, labor, transportation, and utilities. If businesses cannot pass these costs to customers through higher prices, their profit margins shrink. Lower profits often lead to a decline in stock prices because investors expect reduced future earnings.
b. Investor Sentiment
High inflation creates uncertainty. Investors begin to worry about:
Reduced consumer spending
Declining profitability
Increased interest rates
Slower economic growth
This negative sentiment causes selling pressure in equity markets, especially in growth stocks.
c. Sector-Wise Impact
Inflation does not affect all sectors equally:
Beneficiaries: Energy, commodities, metal, mining, and FMCG often benefit because they can pass on higher costs to customers.
Losers: Technology, banking, real estate, and discretionary sectors often struggle because their valuations depend heavily on future growth. When inflation rises, the present value of future earnings decreases.
d. Value Stocks vs. Growth Stocks
Value stocks generally perform better during high inflation because they have stable cash flows today.
Growth stocks tend to underperform because higher inflation reduces the future value of their expected earnings.
2. Impact on Bond Market
Bonds are significantly affected by inflation because their returns are fixed.
a. Rising Inflation Reduces Bond Value
When inflation rises, the real return on bonds falls. For example, if a bond gives 6% interest and inflation rises to 7%, the bond has a negative real return of –1%. As a result, investors sell bonds, causing bond prices to fall and yields to rise.
b. Central Bank Response
To control inflation, central banks like the RBI typically raise interest rates. Higher interest rates push bond yields upward and reduce the attractiveness of older bonds with lower rates.
c. Impact on Long-Term Bonds
Long-term bonds suffer more during inflation because they lock in low interest rates for many years. Investors shift to short-term bonds or inflation-protected bonds.
3. Impact on Currency Market
Inflation directly influences exchange rates and currency strength.
a. Weakening Domestic Currency
When inflation rises in a country faster than its trading partners:
The domestic currency loses value
Imports become costlier
Foreign investors withdraw money
A weak currency increases inflation even more because imported goods like crude oil, electronics, and chemicals become more expensive.
b. Foreign Investment Outflows
High inflation reduces real returns for foreign investors. They move money to stable and low-inflation countries like the U.S., causing depreciation of the domestic currency.
4. Impact on Commodity Market
Commodity markets are highly sensitive to inflation because commodities are physical goods used in production.
a. Commodities Act as an Inflation Hedge
During inflation, investors prefer:
Gold
Silver
Oil
Natural Gas
Metals
These commodities usually rise in value, making them a hedge against inflation.
b. Cost-Push Inflation
When commodity prices rise, the cost of production increases for companies. This leads to:
Higher retail prices
Reduced consumer spending
Lower corporate profits
This is known as cost-push inflation, which slows economic growth.
5. Impact on Real Estate Market
Inflation influences real estate in multiple ways.
a. Rising Property Prices
Inflation increases the cost of construction materials like cement, steel, and labor. This results in:
Higher property prices
Increased rental yields
Real estate is often seen as a hedge against inflation.
b. Higher Interest Rates Affect Demand
When central banks raise interest rates:
Home loans become expensive
Demand for housing slows
Real estate transactions reduce
Thus, inflation can both push real estate prices up (due to costs) and reduce demand (due to financing costs).
6. Impact on Consumers
Inflation directly hits consumers’ pockets.
a. Reduced Purchasing Power
Consumers can buy fewer goods and services with the same amount of money. This reduces:
Savings
Consumption
Discretionary spending (luxury items)
b. Shift in Spending Patterns
Consumers prioritize essentials:
Food
Utilities
Healthcare
Transport
and reduce spending on:
Travel
Clothing
Electronics
Dining out
This shift affects sectors differently in the stock market.
7. Impact on Businesses
Companies face several challenges during inflation.
a. Higher Operating Costs
Input costs such as raw materials, transportation, and wages increase. Companies must decide whether to:
Pass higher costs to customers
Absorb the impact and reduce margins
b. Uncertain Forecasting
Inflation makes it difficult for businesses to plan:
Budgets
Future investments
Expansion strategies
High unpredictability leads to slower business growth.
c. Wage Inflation
Employees demand higher salaries to maintain living standards. Companies face increased payroll costs, which affects earnings.
8. Impact on Economic Growth
Inflation influences the broader economy through multiple channels.
a. High Inflation Slows Growth
If inflation rises too fast:
Consumption decreases
Investment slows
Borrowing becomes expensive
Business expansion reduces
This leads to slower GDP growth.
b. Risk of Stagflation
Stagflation refers to a situation where:
Inflation is high
Growth is low
Unemployment is rising
This is considered the worst-case economic scenario.
c. Central Bank Intervention
To control inflation, RBI raises interest rates and tightens monetary policy. Although this helps reduce inflation, it can slow economic momentum.
9. Impact on Investment Strategies
Traders and investors change strategies based on inflation trends.
a. Portfolio Rebalancing
Investors move money from:
Growth stocks → value stocks
Bonds → commodities
Domestic investments → foreign markets
b. Defensive Stocks Become Attractive
During inflation, sectors like:
FMCG
Utilities
Pharma
perform better because demand for their products remains stable.
Conclusion
Inflation plays a central role in shaping financial markets, economic conditions, business decisions, and investment strategies. While mild inflation indicates a healthy and growing economy, high or unpredictable inflation can create wide-ranging negative effects—market volatility, currency depreciation, reduced corporate earnings, and slower economic growth. Understanding how inflation impacts different sectors and asset classes helps investors make informed decisions and adapt their strategies based on current economic conditions.
