QUBT to hit 40-50 by mid January I am bullish on QUBT because the company just proved it is gaining real traction at the same time the US government is showing strong interest in domestic quantum and photonic technologies. QUBT now has major customers, including a top five US bank and a Fortune level defense tech company, and it has more than one point five billion dollars in cash to scale its foundry and quantum systems. The new partnership with POET opens a second high growth market in AI datacenter photonics, which gives QUBT a valuable new revenue path while still keeping quantum computing at the core of its roadmap. This combination of growing commercial demand, government alignment, and dual exposure to quantum and AI photonics creates a much stronger long term setup than the stock has ever had before.
Given the nature of volatility with quantum stocks and how their are hyper cyclical I would get some hedge puts in case for the same date at a strike of 8-9$ in case of bearish actions
Quantum Computing Inc Shs Unsponsored Brazilian Depositary Receipt Repr 1 Sh
No trades
Trade ideas

QUBT Options Play — Bearish Post-Earnings MomentumTicker: QUBT
Current Price: $10.58
Trend: Conflicting signals — slight bearish bias
Confidence: 55% (LOW)
Expiry: 2025-11-21 (7D)
Strike: $10.00
Position Size: 2% of portfolio
📊 AI & Technical Forecast
Katy AI Trajectory: $10.58 → $10.23–$10.29
RSI: 28.2 → oversold, potential bounce
MACD: –1.5499 → strong bearish momentum
ROC: –36.92% → high downward pressure
24h Move: +6.09% → pre-earnings rally
Insights:
Earnings today → high expected volatility
News: Extremely bearish post-earnings headlines (“Quantum stocks tank,” “$30B wiped out”)
Options Flow: PCR 0.50 → bullish flow, may represent hedging, not directional conviction
High beta (3.766) → extreme intraday moves possible
🎯 Trade Setup
Parameter Value
Direction PUT
Strike $10.00
Entry $0.57
Target 1 $1.14 (+100%)
Target 2 $1.71 (+200%)
Stop Loss $0.29 (–50%)
Expiry 2025-11-21
Position Size 2% portfolio
Confidence 55%
⚡ Key Advantages
Katy AI granular time series captures post-earnings consolidation
High implied volatility (16.6%) → premium opportunities
Tight 50% stop loss & small position size → limits capital at risk
Bearish momentum aligns with negative news cycle → asymmetric risk/reward
Timing Edge:
Enter post-earnings reaction to capture potential downside
Avoid pre-earnings noise and sudden spikes
🚨 Risk Notes
Conflicting signals → low conviction setup
Extreme beta (3.766) → fast intraday swings
High IV → expensive options; scale in carefully
Target 2 only if bearish momentum continues; otherwise, exit at Target 1

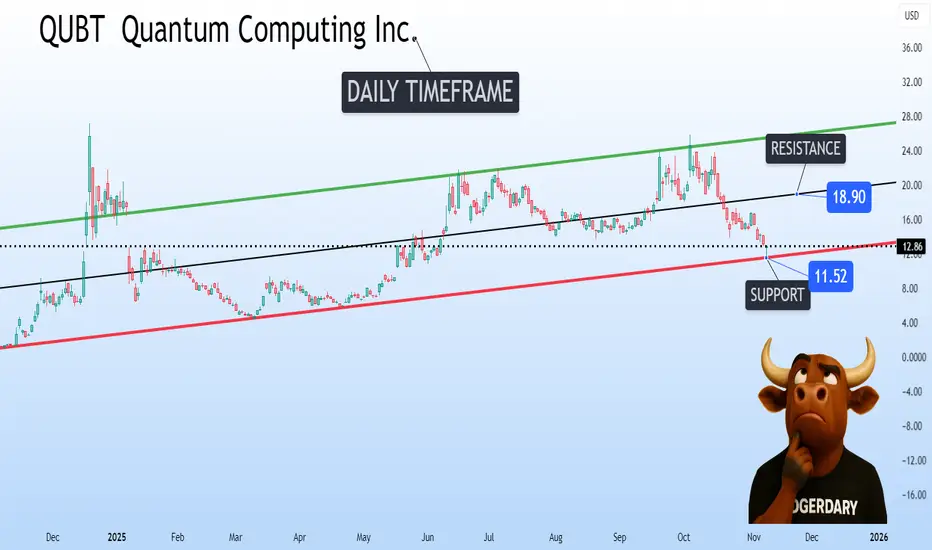
QUBT is sitting right on the edge of its ascending channelQuantum Computing Inc. NASDAQ:QUBT is sitting right on the edge of its ascending channel on the daily timeframe.
It’s testing major support near $11.52, a level that has held multiple times before.
If this zone holds, the next target sits around $18.90 where resistance awaits.
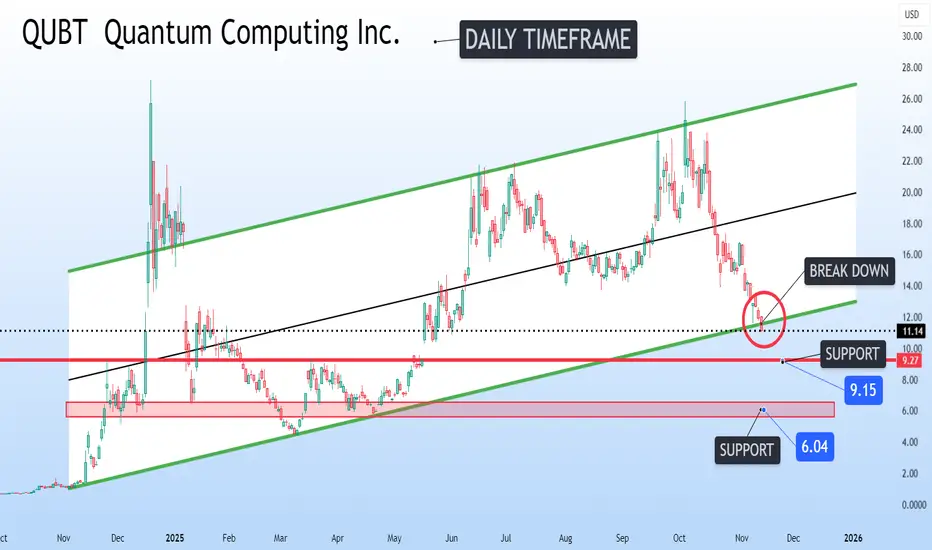
𝗤𝘂𝗮𝗻𝘁𝘂𝗺 𝗖𝗼𝗺𝗽𝘂𝘁𝗶𝗻𝗴 𝗜𝗻𝗰. Breakdown of channel𝗤𝘂𝗮𝗻𝘁𝘂𝗺 𝗖𝗼𝗺𝗽𝘂𝘁𝗶𝗻𝗴 𝗜𝗻𝗰. NASDAQ:QUBT is at a pivotal moment on the daily chart.
After months of steady movement inside a clean ascending channel, price has now broken down from the structure and is sliding toward major support levels. 𝗧𝗵𝗲 𝗳𝗶𝗿𝘀𝘁 𝗸𝗲𝘆 𝘇𝗼𝗻𝗲 𝘀𝗶𝘁𝘀 𝗮𝗿𝗼𝘂𝗻𝗱 𝟵.𝟭𝟱.
If that area gives way, the next 𝗱𝗲𝗲𝗽𝗲𝗿 𝘀𝘂𝗽𝗽𝗼𝗿𝘁 𝗰𝗼𝗺𝗲𝘀 𝗶𝗻 𝗻𝗲𝗮𝗿 𝟲.𝟬𝟰.
Taking the QUBT Here - LONGTrading Fam,
Got the BUY from my indicator here on QUBT. Even with the market acting toppy, I've got to trust this thing! I can hardly believe how accurate it has been in stocks, nearly doubling our portfolio in just over a year since implementation. No more hours and hours of studying charts, drawing trendlines and patterns, and then ...essentially guessing. When the thing alerts me to buy, I buy, and when the thing alerts me to sell, I sell (or go short). The results are there. I've been doing this all publicly so that you can observe the results right along with me and everyone else who cares. Wins are posted. Losses are posted. It works on stocks. It's horrible with crypto. Two trackers. Both telling very different stories. And I've learned. It's about high mc and high volume. If I don't have that, it just isn't as accurate. But when I do, we are on fire. Indeed, my last 18 exits from stocks have all been wins, and we have averaged 30% profit per trade. So, let's do this again!
Here on QUBT, you can see I have one trendline drawn. If we break that? I might have my first loss since March and it is probably time to sell. But since I received a buy signal from my indicator right on that line, I'm going to take the trade. I'll be shooting for just over $23 for a net profit of over 46%. My stops are set at $13.13 rn. This give me a rrr of 1:3.
Let's go!
✌️Stew

QUBT — Bullish Wave Formation or Another Trap Zone Ahead?🔬 QUBT – Quantum Computing Inc.
💸 Stock Market Profit Playbook (Swing / Day Trade)
🎯 Setup Overview
We’re looking at QUBT — the Quantum Beast of tech innovation 🧠⚙️.
The setup? A Bullish Breakout + Bullish Pullback combo that’s ready to roll if momentum confirms.
🧭 Trade Plan (Thief-Style Precision ⚔️)
💥 Breakout Entry:
If price breaks the previous neutral zone around $19.00, that’s your ignition switch 🔓 — buy above that zone once confirmation candle closes strong.
♻️ Pullback Entry:
Wait for the price to revisit the Triangular Moving Average (TMA) region near $13.00. If bulls defend that zone — that’s your wave start! 🏄♂️ Ride the bullish momentum from there.
💰 Thief Strategy (Layered Entry):
We thieves don’t chase — we layer. Place multiple buy limits like a pro sniper 🎯
First Layer ➤ $35.00
Second Layer ➤ $36.00
Third Layer ➤ $37.00
(You can extend your limit layers higher or lower based on your risk appetite and strategy.)
🛑 Stop Loss (SL):
This is my “Thief SL” @ $34.00 🧨 — but dear Ladies & Gentlemen (Thief OGs), this is not financial advice. Set your own SL based on your plan & comfort zone. Protect your pockets first, profits later! 💼
🎯 Take Profit (TP) / Target:
The Police Barricade awaits around $44.00 🚓 — strong resistance, overbought signals, and possible trap zone there!
So, our main escape point is $43.00, where smart thieves bag profits and disappear like smoke 💨💵
Note: Dear Thief OGs — I’m not recommending only my TP. Make your own move when you’re in profit.
🧩 Related Pairs / Market Correlation (For Cross-Eye Analysis 👀)
Keep these tickers in your radar when QUBT starts heating up 🔥:
NASDAQ:AMD → Tracks semiconductor + tech demand. If AMD rips, quantum stocks often follow the vibe! ⚙️
NASDAQ:NVDA → The AI overlord 👑 — any surge here can reflect positive sector sentiment toward compute innovation (including quantum).
CBOE:ARKQ → ARK’s innovation ETF 🚀 — often holds early-stage quantum exposure; its movement shows if deep-tech is gaining capital inflow.
NASDAQ:SOXX → The semiconductor index ETF. When it rallies, it confirms broad tech strength 🌐
When these tickers move in sync → that’s your quantum confirmation ripple 🌊
⚙️ How To Use This Setup (The Thief Way 🕶️)
Layer entries smartly, not emotionally.
🧠 Define SL & TP your way — mine’s just a reference.
💎 Manage exposure — if multiple layers trigger, scale wisely.
📈 Track volume + candle structure near breakout zones.
🕰️ Patience pays — let the setup prove itself.
✨ “If you find value in my analysis, a 👍 and 🚀 boost is much appreciated — it helps me share more setups with the community!”
⚠️ Disclaimer: This is thief-style trading strategy just for fun. Always DYOR (Do Your Own Research) before entering any trade.
#QUBT #QuantumComputing #StockAnalysis #SwingTrade #DayTrade #Breakout #Pullback #TradingStrategy #ThiefStyle #TechStocks #TradeSetup #ProfitPlaybook #StockMarket

QUBT [Swing]: Double Bottom + Volume = Opportunity🎯 QUBT: The Quantum Heist Setup! 💎 Double Bottom Breakout Play
📊 Asset Overview
Quantum Computing Inc. (QUBT) - Riding the quantum wave with momentum! 🌊
🔍 Technical Analysis
The chart is screaming opportunity! 📢 We've spotted a volume-weighted moving average double bottom pattern with a clean retrace hitting the 786 MA line. Bulls are flexing their muscles 💪 and the setup looks primed for an upside explosion.
Key Technical Highlights:
✅ Double bottom formation confirmed
✅ Volume spike supporting the move
✅ 786 MA acting as dynamic support
✅ Momentum indicators turning bullish
🎯 The "Thief" Strategy Playbook
🚪 Entry Zone: The Layered Approach
Thief Strategy = Smart Layering 🧠
Instead of going all-in at one price, we're using multiple limit orders (layering strategy) to build our position:
💰 Layer 1: $19.50
💰 Layer 2: $20.00
💰 Layer 3: $20.50
💰 Layer 4: $21.00
Pro Tip: You can add more layers based on your risk appetite and position size! This approach averages your entry and reduces timing risk. 🎲
🛡️ Risk Management
🚨 Stop Loss: $18.00
Important Note: This is the Thief OG stop level, but remember — your capital, your rules! 👑 Every trader's risk tolerance is different. Adjust based on your own comfort zone and account size. Trade at your own risk!
🎯 Profit Targets
🏁 Primary Target: $25.00
Why $25? Because at $26.00, we've got a "Police Barricade" 🚔🚧 — a strong resistance zone where:
Overbought conditions likely
Bull trap potential
Heavy selling pressure expected
Smart thieves escape before the sirens! 🚨 Lock in profits at $25.00 and live to trade another day.
Another Important Note: This is a suggested target level. You make the money, you take the money — at your own discretion and risk! 💵
🔗 Related Pairs to Watch
Keep an eye on these correlated quantum/tech plays:
NYSE:IONQ - Pure-play quantum computing competitor
NASDAQ:RGTI - Rigetti Computing (quantum sector)
NYSE:IBM - Traditional tech with quantum division
NASDAQ:NVDA - AI/quantum chip correlation
NASDAQ:GOOGL - Google's quantum initiatives
Correlation Play: When quantum stocks heat up, they often move together. QUBT leading could signal sector-wide momentum! 🔥
⚠️ Disclaimer
This is the "Thief Style" trading strategy — designed for entertainment and educational purposes with a fun twist! 🎭 This is NOT financial advice. Always do your own research, manage your risk, and never trade with money you can't afford to lose. Past performance doesn't guarantee future results. Trade responsibly! 🎲
🎬 Final Words
The setup is there, the levels are marked, and the quantum play is heating up! Whether you're swing trading or day trading, this layered approach gives you flexibility and control.
Remember: Markets don't care about your feelings — stick to your plan, manage your risk, and let the probabilities work in your favor over time! 🎯
✨ If you find value in my analysis, a 👍 and 🚀 boost is much appreciated — it helps me share more setups with the community!
#QUBT #QuantumComputing #StockMarket #SwingTrading #DayTrading #TechnicalAnalysis #DoubleBottom #ThiefStrategy #LayeringStrategy #TradingSetup #BullishSetup #StockTrading #QuantumStocks #TradingIdeas #PriceAction #RiskManagement

QUBT Weekly Outlook (Oct 28–31)QUBT Weekly Outlook (Oct 28–31): “Holding the Trendline — Is Quantum Computing Setting Up for a Bounce?”
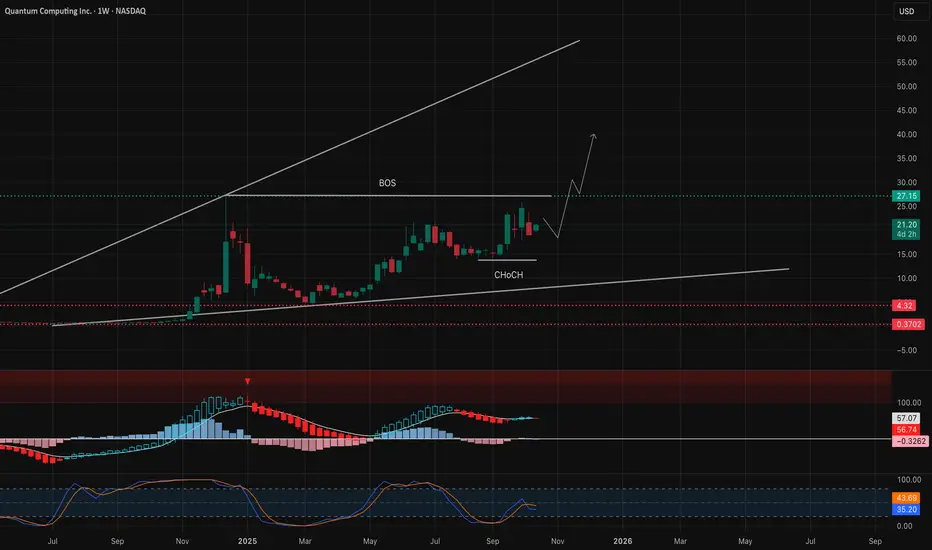
1. Weekly (1W) — Long-Term Structure
Quantum Computing Inc. (QUBT) is maintaining its long-term ascending channel after printing a strong BOS (Break of Structure) above $27 earlier this year. Recent candles show a healthy correction within this uptrend, currently retesting the $15–$16 zone, which aligns with prior structural support and the mid-trendline.
* Trend Bias: Bullish while above $11.
* Support Levels: $15 → $11 → $4
* Resistance Levels: $21 → $27 → $35
* Momentum: Weekly MACD showing early cooling, but still in positive territory.
* Stoch RSI: Deep oversold — suggesting potential reversal setup brewing.
💡 Macro view: As long as QUBT holds above $11–$12, the structure remains intact for another leg higher into $21–$27. This pullback appears to be a retest phase before potential continuation.
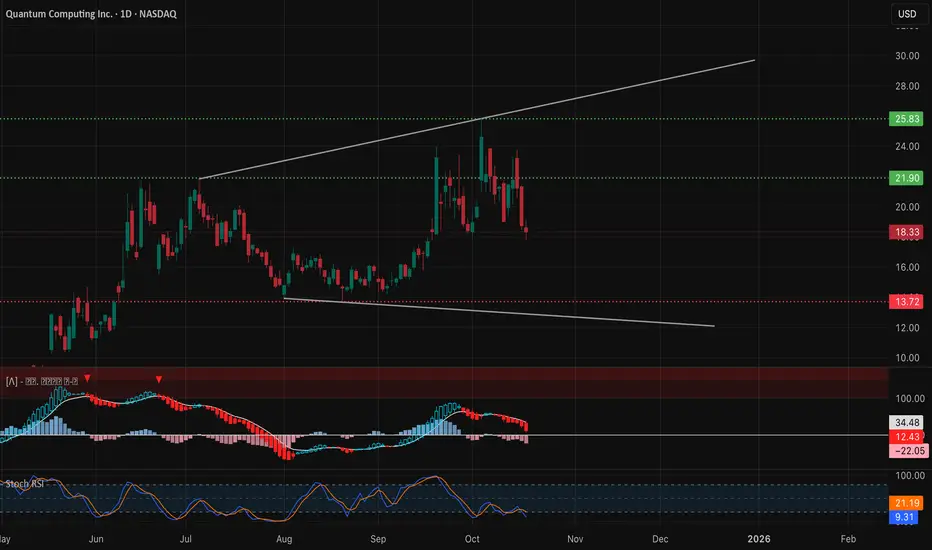
2. Daily (1D) — Retest at Demand Zone
The daily chart reveals a clear CHoCH near $27 followed by a corrective wave into a strong demand zone between $13–$15. Price is attempting to stabilize after multiple bearish candles and may be forming a base for a short-term reversal.
* Market Structure: Still corrective, but approaching potential rotation zone.
* Support: $13.7 → $11.8 → $10.9
* Resistance: $16.8 → $19.5 → $21.8
* Indicators:
* MACD remains bearish, but histogram showing smaller red bars — momentum easing.
* Stoch RSI curling upward from oversold — early signal of potential rebound.
📈 Daily insight: Watch for price reclaiming $16–$17; that would confirm a higher low and open the path toward $19–$21. A break below $13.5 would extend correction toward the $11 support zone.
3. 1-Hour (1H) — Intraday Setup
On the 1-hour chart, price has shown CHoCH → BOS recovery attempts but remains choppy near trendline support. Buyers are trying to defend the $15.5–$15.7 range with limited momentum.
* Bias: Short-term neutral to bullish if price holds above $15.
* Support: $15.3 → $14 → $13.7
* Resistance: $16.8 → $17.3 → $19
* Setup Plan:
* Bullish scalp: Above $16.00 → target $17.30–$18.00; stop below $15.30.
* Dip buy: Enter near $15 zone → aim $16.5–$17.5 bounce; stop $14.5.
* Invalidation: Breakdown below $13.7 confirms further weakness.
💬 Intraday note: MACD starting to flatten; if crossover occurs on the next few sessions, momentum reversal is likely. Stoch RSI is near the bottom band, suggesting a possible short-term push upward.
4. GEX & Options Sentiment — Gamma Compression Setup
From the GEX data overlay:
* Highest Positive NETGEX / Gamma Wall: $17–$18
* Call Walls: $17 → $21 → $25
* Put Support: $13.5 → $11.0
* IVR: 45.3 — medium, suggesting volatility compression ahead.
* Call Sentiment: Moderate bullish skew — traders positioning for a rebound.
🔍 Interpretation: As long as QUBT remains above $15, gamma flow supports a potential upward squeeze toward $17–$19. If $13.7 fails, short gamma may accelerate selling into $11–$12.
5. Suggested Option Scenarios
Bullish Scenario (Primary Bias):
* Play: 16C–18C (0–2DTE) breakout setup.
* Entry: Above $16.2 breakout confirmation.
* Targets: $17.3 → $18.5 → $19.5
* Stop: Below $15.2
Dip Entry Play:
* Play: 15C (1DTE) or 15/17 spread on bounce.
* Entry: Near $15.0–$15.5 retest.
* Target: $17 → $18.
* Stop: Below $14.
Bearish Hedge (Only below $13.7):
* Play: 13P (1DTE) targeting $12–$11.
* Stop: Back above $15.
Directional Bias
QUBT remains inside a strong long-term channel with current correction testing the key support region. Structure remains constructive for a rebound, provided $13.5–$15 holds.
🎯 Primary Bias: Bullish rebound toward $17–$19.
⚠️ Invalidation: Below $13.7 → potential drift to $11 zone.
This analysis is for educational purposes only and does not constitute financial advice. Always do your own research and manage risk before trading.

QUBT - All MAs Pointing North!QUBT - CURRENT PRICE : 21.32
Technical Analysis Summary
Trend Analysis: The 20-day SMA is sloping upward, indicating short-term bullish momentum. Both the 50-day EMA and 200-day EMA are also trending higher, confirming that the medium- and long-term trends remain positive. Price is trading above all key moving averages, reinforcing a healthy uptrend structure.
Momentum Indicator (RSI): The RSI (14) is currently around 56, which is within the bullish territory (above 50). This shows positive momentum and room for further upside before entering overbought conditions.
Volume Analysis: Recent up-moves have been accompanied by rising volume, suggesting that the buying interest is supported by strong participation from investors.
Ichimoku Cloud: The price is above the Ichimoku Cloud, confirming the bullish sentiment and strong price structure. Chikou Span is above candlesticks and cloud further strengthening bullish outlook.
ENTRY PRICE : 21.20 - 21.40
FIRST TARGET : 25.00
SECOND TARGET : 28.00
SUPPORT : 18.00

Closing QUBT ShortFinally these no revenue speculative quantum stocks are tanking.
Will be taking profit here

I have 30 reasons not to wait - long at 17.28 I really can't imagine a better illustration of why I trade the way I do than QUBT. This stock is barely above break even for the year and the 30 signals I've had generated gains collectively of +387%, including 8 double-digit percent gains on trades lasting less than a week. It is also currently still in higher highs/higher lows mode, so that is in my favor as well.
This is a stock trade not without its risks, however. This is a VERY overdone market, in my opinion, and this is a stock that had $62,000 in revenue for the entire last quarter. There is no value here, unless you're willing to wait 10 years and even then get lucky. This is strictly a price fluctuation trade. But if crypto, which doesn't even really exist, can be assigned value and someone will pay for it, then the same can be true for this, I suppose. But if the market comes to its senses while I am holding this, it WILL get ugly.
I intend to be out quickly here, as I do not want to be dancing around with it when the music stops. But the payoffs here are disproportionate so it is a risk I'm willing to take. It is important to be clear-eyed and know what you are trading here. Hope is the only intrinsic value. I will tactically add if the right scenario presents itself, but I will not get out over my skis on a stock like this one.
As always - this is intended as "edutainment" and my perspective on what I am or would be doing, not a recommendation for you to buy or sell. Act accordingly and invest at your own risk. DYOR and only make investments that make good financial sense for you in your current situation.

QUBT – Testing the Lower Channel: Oct. 21-25Will Bulls Defend $17 or Fade Into Deeper Pullback? ⚡️
🟩 Daily Timeframe – Macro Structure and Trend Overview
Quantum Computing Inc. (QUBT) has been riding a broad ascending channel since July, making multiple swing highs with consistent liquidity sweeps around $25–$27 before retracing sharply. The recent drop from $24 → $18 marks a continuation of the stock’s oscillating expansion phase — a common pattern in speculative tech plays.
Currently, price is sitting right on a critical midpoint support near $17.7–$18.3, which has acted as a pivot zone multiple times. Holding this area is key to maintaining the bullish midterm structure.
Technicals:
* MACD has flipped bearish with momentum accelerating downward, signaling short-term exhaustion.
* Stoch RSI sits near 9.3, an extreme oversold condition — suggesting potential rebound setup if volume returns.
* The overall structure remains bullish until $13.7 breaks, which is the lower channel base.
If buyers step in early week, the first recovery target sits at $21.5, followed by $25.8, where major resistance converges with the channel top.
🟦 1-Hour Timeframe – Short-Term Channel and Structure Shift
On the 1-hour chart, QUBT has been trending within a clean descending channel, showing alternating CHoCH and BOS events that signal both liquidity grabs and fading momentum.
Key structure details:
* Last CHoCH occurred near $18.6, hinting at a potential reversal but not confirmed yet.
* Price remains capped by the upper descending trendline (~$19.6).
* MACD histogram shows early bullish divergence as selling pressure weakens.
* Stoch RSI rising from 20 zone — watch for crossover above 50 for confirmation.
As long as QUBT holds above $17.8, there’s room for an intraday bounce to $19.5–$20, where short-term supply sits. But if price fails that level and reclaims below $17.1, expect continuation toward $15.8–$16 — the measured channel support.
🟨 15-Minute Timeframe – Micro Liquidity and Momentum Setup
Zooming into the 15-minute chart, QUBT shows compression right at the descending wedge apex, forming a small CHoCH near $18.6, but sellers remain active on every attempt to reclaim the upper trendline.
* BOS around $18.3 suggests localized weakness, but the lower shadows indicate buyers defending near $17.8.
* MACD trending upward with clear momentum divergence (price flat, MACD rising).
* Stoch RSI recovering from 40→60 zone, signaling early upside rotation potential.
If the next 15-minute candle closes above $18.8–$19.0, it confirms the micro breakout, likely pushing QUBT toward $19.6–$20.0 fast. A failed retest, however, could drag price back to $17.7 support for another liquidity sweep.
🎯 Trade Scenarios
Bullish Setup 🟢
* Entry: Above $18.9–$19.1 breakout confirmation.
* Targets: $20 → $21.7 → $23.8.
* Stop-Loss: Below $17.5.
* Confluence: MACD crossover + RSI > 55 + wedge breakout.
Bearish Setup 🔴
* Entry: Breakdown below $17.7–$17.5 or rejection from $19.6.
* Targets: $16 → $13.7.
* Stop-Loss: Above $19.3.
* Confluence: MACD flattening + volume drop on rally attempts.
🧭 Outlook for the Week (Oct 21–25)
QUBT is coiling for a decisive move after multiple rejections from its channel midline. The $17–$18.3 support zone is crucial — defending it could fuel a relief bounce back toward $20+. Losing it may confirm a full retest of the base channel ($13–$14) before another major leg.
Expect volatility spikes early week as quantum-related small caps often move sharply once volume clusters at support. For now, momentum favors cautious accumulation near support, not aggressive chasing.
Disclaimer:
This analysis is for educational purposes only and does not constitute financial advice. Always conduct your own research and trade responsibly.
corrective Wave C ? or are we in sub wave 1 within a 5th ? This looks like a pretty perfect pattern to short base on what I have right now. But am I right to short Wave C base on my theory? or Am I too early

QUBT: Building Strength for the Next Quantum Leg UpWeekly Structure
QUBT is showing one of the most constructive long-term setups in the small-cap quantum sector.
The weekly chart confirms a Break of Structure (BOS) earlier this year, followed by a healthy consolidation between $18–22, forming a potential accumulation range before the next expansion.
Price continues to respect the ascending trend channel, and the most recent candle printed a strong bullish reaction from the $18.50 zone, aligning with both previous resistance turned support and the mid-channel line.
The MACD remains bullish and above zero, with momentum showing signs of reacceleration. Stoch RSI is curling upward from mid-levels — a sign that the pullback phase may be ending and buyers are regaining control.
📊 Weekly Key Levels:
* 🟢 Support: $18.50 – $20.00
* 🟡 Resistance: $27.00 → breakout level
* 🚀 Extended Target: $32 – $35 range if volume expands
Daily Structure
On the daily timeframe, QUBT has been in a tight consolidation after a sharp rally.
We saw a short-term CHoCH (Change of Character) as price retested the $18–19 area, but it held perfectly above the demand zone, confirming strength.
Now, price has bounced and is approaching the $21–22 resistance, where a breakout would signal the next bullish continuation.
The MACD histogram is flattening near the zero line — a potential turning point before bullish momentum resumes.
Meanwhile, the Stoch RSI is crossing upward from oversold, confirming renewed energy on the lower timeframe.
💡 Conclusion — Is It a Good Time to Buy?
✅ Yes — selectively.
QUBT is currently sitting near the low end of its accumulation zone ($18–20), which offers an attractive risk-to-reward entry for swing or position traders.
However, a confirmation breakout above $22 with increasing volume would give stronger conviction for a momentum continuation toward $27–30.
If price dips slightly back into $18–19 again, that’s likely a buy-the-dip opportunity within structure — as long as it does not close below $17.
⚠️ Risk & Trade Idea
* Entry Zone: $18.50–20.00
* Stop-Loss: Below $17.00
* Targets: $27 → $32 → $35
* Risk/Reward: 1:3 to 1:4 (excellent positioning)
QUBT remains technically bullish across higher timeframes — momentum is cooling, not reversing.
This is the kind of setup where patience pays, especially if the quantum tech narrative continues heating up alongside IONQ and RGTI.
This analysis is for educational purposes only and not financial advice. Always do your own research and manage risk accordingly.
$QUBT pullback to $15-18 and then new leg higher?NASDAQ:QUBT looks like it's forming a short term high here at the top of the structure.
I could see the possibility of a pullback down to the $15-18 or so levels and then I think if we can hold there, it'll setup a new leg higher to break the structure.
If this happens and we do break the structure, then I think it's possible we see $32+ on next leg higher.
My bias is towards tagging the two top resistances levels before the run is fully over.

QUBT - Quantum computing for the win ? But how long ?I will absolutely not pretend to know what is currently happening in this sector despite my background in physics as this is not my domain of expertise, so take with a grain of salt everyone's opinion in this matter if they are not actively involved in this field !
Quantum computing is making headlines for now as some breakthroughs seem to be happening but with my understanding we're still some years away from commercial applications, thus any speculation should be short term and by definition, investment, long term, we're speaking probably decades !
QUBT - It's an interesting name and if current bullish move is to continue, we could get some nice returns on this name.
I'm looking for a breakout here that could hopefully take us towards 33 then 41 then who know...
I will try a first entry around 23.45$ as I'm writing this with a stop at 22.32$
If my stop gets hit I'll try a new entry on the pullback with half stop at 20.91 and the rest on a close below the blue 20EMA.
FYI - I won't lie that I'm secretly rooting and prepared for a fake break out that would then take all prices a lot lower !!!
But this view will of course depend on the the price action and certainly a tweet from Trump.

$QUBT — Early Reversal WatchQUBT sold off into the 0.786 Fib zone and found support right near the 200 EMA. We’ve now seen a strong bounce with price reclaiming short EMAs (8/21), signaling potential reversal momentum.
✅ Entry trigger: Candle close above the 200 EMA
🎯 Targets: Fib 0.382, 0.5, and 0.618 retrace levels, with full reclaim at Fib 1.0
⛔ Stop: Just under the recent swing low (1 Fib extension zone)
This fits the playbook: early reversal long @ 200 EMA + Fib confluence. One to keep on watch for continuation.

Bullflags Galore...We have had a recent pullback and consolidation, this is not the first bullflag, nor shall it be the last. I think we have enough momentum to for continuation but it may still take time. Not financial advice, DYOR.

Quantum Computing, a twilight saga.Lets go to 70 USD.
First target.
We will see how this plays out, This is not financial advice.

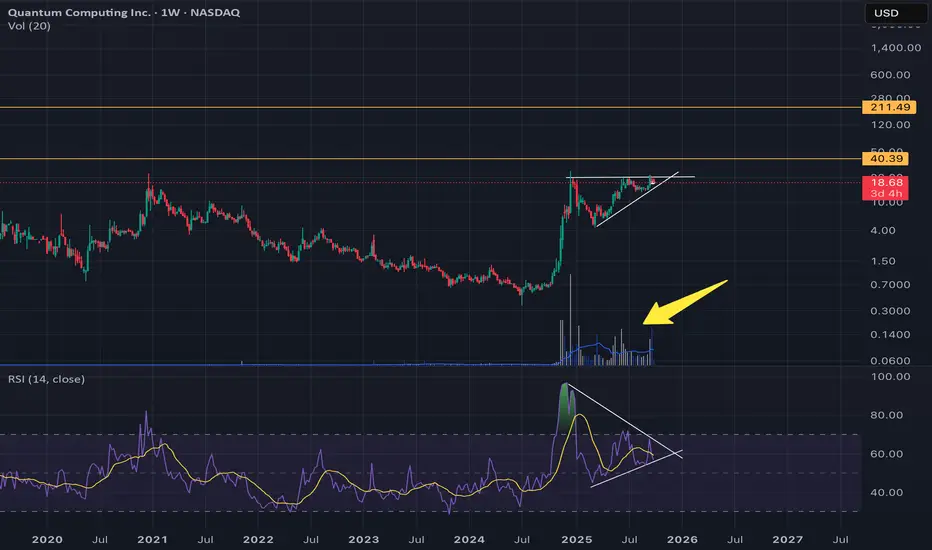
QUBT coiling on the weeklyBeen seeing these kinds of patterns a lot atm. Huge spike in volume, RSI compressing into a pennant pattern, and price consolidating under a clear resistance level.
Company has raised a decent amount of cash to burn on R&D, and there's a lot of talk rn about quantum computing being the next breakthrough tech (although the likelihood of this seems many years away).
In short, looks like it could be a super long-term, high-risk, pure-play quantum computing punt. Adding this to my watchlist to see how this plays out over the rest of this year.
NFA, DYOR.
Lmk if you agree or disagree with this idea in the comments below! Forever a student, and all that.
buy qubt @ 19-21, target 200QUBT (Quantum Computing Inc.) building momentum — a leader in quantum hardware + AI/defense applications.
Best buy zone: $19–21
Target: $100–200 in 18 months
Quantum = backbone of next-gen AI, cybersecurity & defense. 🌐⚡
#QuantumComputing #AI #DefenseTech #QUBT #StockMarket

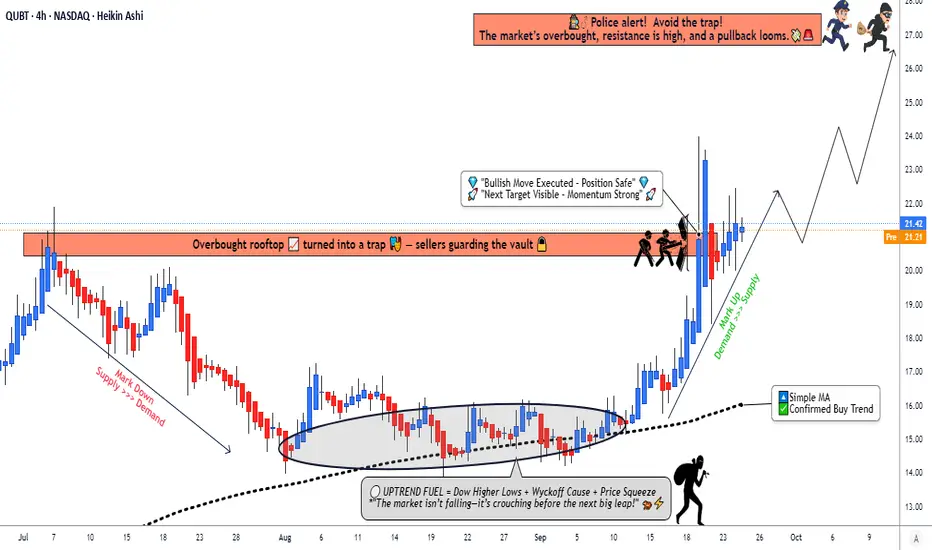
QUBT Analysis: Overbought Resistance Cleared – Next Target!💎 QUBT – Quantum Computing Inc | Market Wealth Strategy Map (Swing/Day Trade) 💎
🔥 Trend Analysis:
Bullish trend confirmed ✅
Accumulation zone + upside pressure 💹
200 SMA pullback support 🟢
Overbought resistance level breakout 🚀
🎯 Entry Plan:
You can use Thief Layer Strategy: multiple limit orders for smooth entries 🕵️♂️
Example layers: $19.00, $19.50, $20.00, $20.50, $21.00
(Adjust your own layers depending on risk appetite)
🛡️ Stop Loss:
Thief SL @ $17.00
Note: This is a guide. Set your own SL based on your risk tolerance ⚠️
💰 Target:
Police barricade acts as strong resistance 🚧
Overbought + trap zone ahead 🛑
Target: $27.00
Note: Take profits at your discretion. Your money, your rules 💵
📌 Key Pairs to Watch / Correlation:
NASDAQ:QUBT vs NASDAQ:NVDA – Tech sector alignment, high correlation in bullish runs ⚡
NASDAQ:QUBT vs NASDAQ:AMD – Quantum computing hype impacts both 🚀
NASDAQ:QUBT vs NASDAQ:SOXX (Semiconductor ETF) – Sector-wide momentum check ✅
💡 Notes for Fellow Thieves:
Strategy uses layering technique: multiple limit orders, flexibility in entries
Risk management is personal — adapt according to your style
✨ “If you find value in my analysis, a 👍 and 🚀 boost is much appreciated — it helps me share more setups with the community!”
⚠️ Disclaimer:
This is Thief Style Trading Strategy just for fun. Not financial advice. Trade responsibly.
#QUBT #QuantumComputing #SwingTrade #DayTrade #ThiefStrategy #LayeringMethod #TradingIdeas #StockAnalysis #TradingView #MarketSetup #BullishTrend #TechStocks
EMA SandwichPrice is sandwiched between the 200 EMA in orange 14.18$, and the 50 EMA in blue 15.54, price has also formed a descending triangle on a key level. Bulls need a clean break of the 50 EMA for some possible bullish activity.
