Why Most Traders Missed This Starbucks Swing Trade (SBUX)Most traders miss the forest for the trees. They spend their entire day glued to intraday charts, scalping for a few cents, and they completely ignore the bigger picture. But here’s the truth: the biggest moves, the cleanest swing trades, come from the higher timeframes — monthly and weekly charts. Today, I will break down why that matters, and we’ll use Starbucks stock, ticker SBUX, as a perfect example.
The Importance of Bigger Timeframes
When you zoom out to the monthly timeframe, you’re looking at where the real money plays — hedge funds, institutions, the smart money. These guys aren’t trading 5-minute charts. They’re building positions in massive supply and demand imbalances.
If you ignore those levels, you’re basically trading blind. It’s like trying to surf without paying attention to the tide. You might catch a wave or two, but eventually, the tide will wipe you out.”
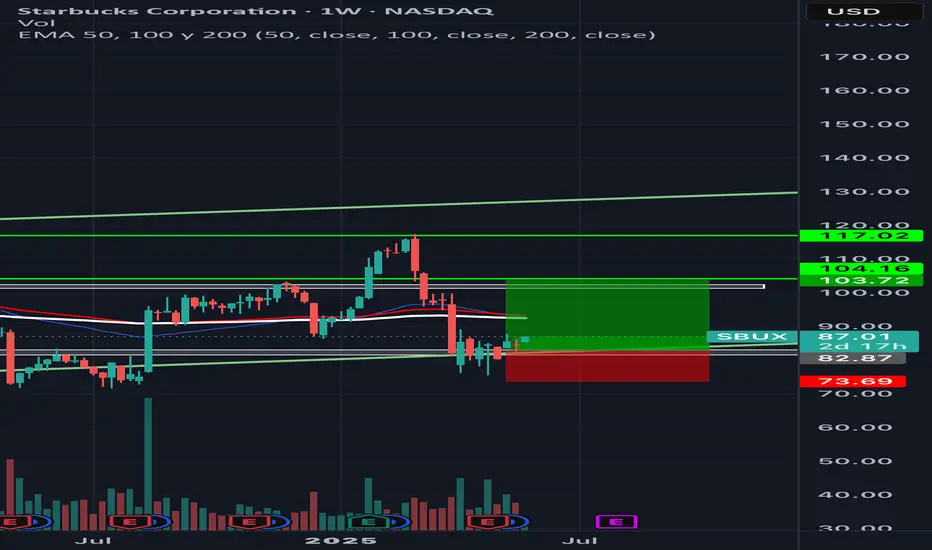
Starbucks Monthly Demand at $79.68
Let’s look at Starbucks. Right now, we’ve got a strong monthly demand imbalance of around $79.68. Price dropped into that zone, and what happens next? Buyers step in, and bullish candlesticks start forming.
This isn’t magic. This is pure supply and demand. At that price, Starbucks became too cheap for the big players to ignore. They’re scooping it up, and as a result, smaller timeframes start printing bullish price action. The monthly demand fuels the fire.
There is room to reach the tested monthly supply at $110.
SBUB34 trade ideas

Starbucks: Fresh Upside MomentumAfter a period of pronounced selling pressure, Starbucks shares have recently stabilized and shifted into an upward trend. We identify the ongoing dark green wave as a magenta three-wave move. In our view, waves (W) and (X) are complete, and we see further upside potential in the final stage of this substructure. However, we then anticipate another downward move to complete the overarching correction, which is likely to push price below the support level at $71.53. There is a 31% probability that dark green wave alt. could take precedence and drive price directly below the $71.53 support level beforehand.

Starbucks Breakout Brew!📍 Entry: Buy above $92.60 after a strong candle close.
🛑 Stop-Loss: $91.70 (below trendline & support).
🎯 Target 1: $93.20 – quick profit zone.
🎯 Target 2: $94.00 – next resistance if momentum holds.
⚡ Hook: "Perfect blend of timing, targets, and discipline."

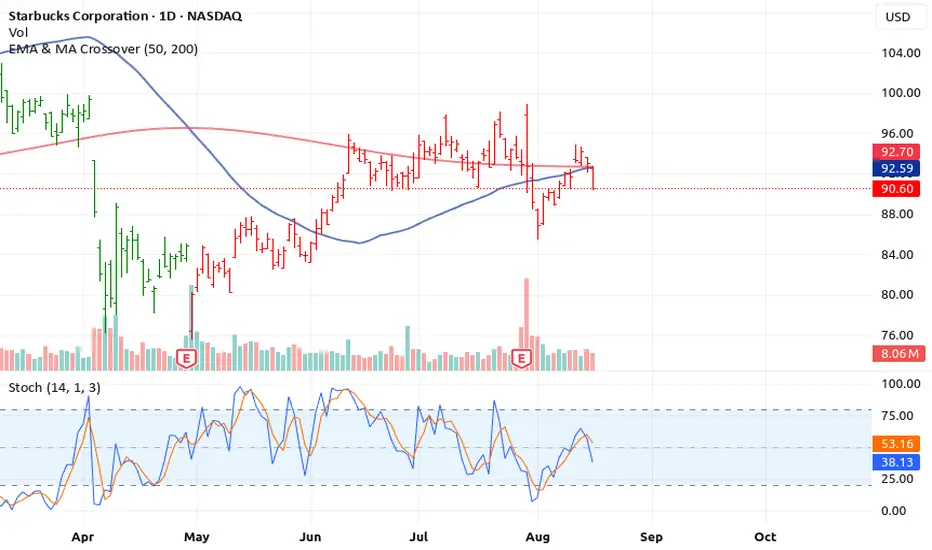
Starbucks (SBUX) – 4 Warning Signs Point to a Potential..Starbucks (SBUX) – 4 Warning Signs Point to a Potential Downturn
Traders and investors should be cautious on SBUX as multiple technical indicators are signaling a bearish outlook across different timeframes. Here’s a breakdown of the red flags:
1. Negative Volume Pressure
Recent trading sessions have shown a decline in volume on upward moves, while downward moves are backed by heavier
selling volume. This imbalance suggests that buyers are losing control, and the stock may be set for a further pullback.
2. Balance of Power (BOP) Turns Bearish
The Balance of Power (BOP) indicator, which measures buyer vs.
seller dominance, has flipped into negative territory. A bearish BOP indicates that sellers are gaining control over the market, confirming the negative volume trend.
3. EMA Crossover Signals Trend Weakness
The short-term EMA (e.g., 50 EMA) has started crossing below the
long-term EMA (e.g., 200 EMA), a classic signal of a downtrend formation. EMA crossovers are widely regarded as reliable indicators for trend direction.
4. Stochastic Divergence Confirms Bearish Momentum
Finally, the Stochastic oscillator is showing a bearish divergence, with price making higher highs while Stoch fails to confirm them.
This often precedes sharp reversals or pullbacks.
⚠️ Conclusion
All four indicators — negative volume, bearish BOP, EMA cross down, and Stochastic divergence — align to suggest that SBUX
may be heading toward a correction or short-term crash. Traders should consider tightening stops, reducing exposure, or exploring short positions in accordance with their risk strategy.
Also remember we are using the 50,200 EMA thats the rocket booster strategy
Rocket boost this content to learn more.
Disclaimer: This is technical analysis only and not financial advice. Always conduct your own research and consider your risk tolerance before making trading decisions.
Also use a simulation trading account before you trade with real money, learn risk management and profit taking strategies.
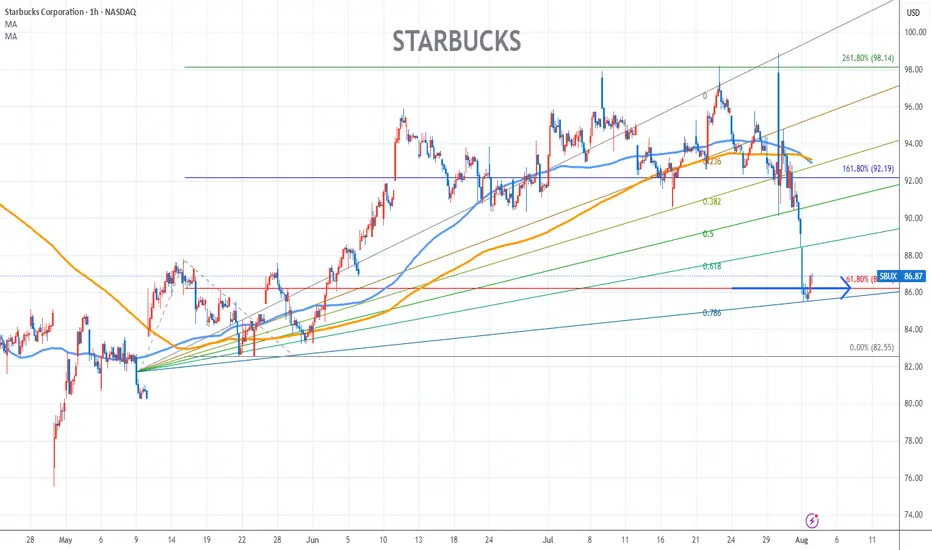
Starbucks Chart Fibonacci Analysis 080325Trading Idea
1) Find a FIBO slingshot
2) Check FIBO 61.80% level
3) Entry Point 86/61.80%
Chart time frame:B
A) 15 min(1W-3M)
B) 1 hr(3M-6M)
C) 4 hr(6M-1year)
D) 1 day(1-3years)
Stock progress:C
A) Keep rising over 61.80% resistance
B) 61.80% resistance
C) 61.80% support
D) Hit the bottom
E) Hit the top
Stocks rise as they rise from support and fall from resistance. Our goal is to find a low support point and enter. It can be referred to as buying at the pullback point. The pullback point can be found with a Fibonacci extension of 61.80%. This is a step to find entry level. 1) Find a triangle (Fibonacci Speed Fan Line) that connects the high (resistance) and low (support) points of the stock in progress, where it is continuously expressed as a Slingshot, 2) and create a Fibonacci extension level for the first rising wave from the start point of slingshot pattern.
When the current price goes over 61.80% level , that can be a good entry point, especially if the SMA 100 and 200 curves are gathered together at 61.80%, it is a very good entry point.
As a great help, tradingview provides these Fibonacci speed fan lines and extension levels with ease. So if you use the Fibonacci fan line, the extension level, and the SMA 100/200 curve well, you can find an entry point for the stock market. At least you have to enter at this low point to avoid trading failure, and if you are skilled at entering this low point, with fibonacci6180 technique, your reading skill to chart will be greatly improved.
If you want to do day trading, please set the time frame to 5 minutes or 15 minutes, and you will see many of the low point of rising stocks.
If want to prefer long term range trading, you can set the time frame to 1 hr or 1 day.
What The 3 Step Rocket Booster Strategy Is In Short SellingTrading is not easy at all.
But with practice you will get it.
These past few days have been horrible because
i was so stressed i nearly fainted away not only
my body but also my spirit.
Sleeping is your number one goal.
I dont care if you have money or not.YOU HAVE TO SLEEP.
Because of this personal sleeping campaign am
off coffee and tea.These beverages are high in caffeine.
Speaking of coffee this company NASDAQ:SBUX isn't
doing well in USA.
It looks like Gen- Z are not using coffee spots
to socailise. As a 4% decline in business
transactions was recorded.
Even-though in China this store has an
Increase of
about 6% Has been recorded
thanks to delivery options.
Gen Z Still wants to stay at home.They
dont want to go outside and mingle.
Either way look at this stock price.
The candle stick pattern looks like
the falling three soldiers.
This pattern has been favored by the MACD
crossover above the zero line
It has to be above the zero line because
It indicates that the price is in a selling season.
Another catalyst:
-Negative earnings report.
Also to put the hammer on the nail.
This price is following the rocket booster strategy
from the sell side.
SO what is the rocket booster strategy?
The price has to be below the 50 EMA
The price has to be below the 200 EMA
The price should gap down
Remember to place a limit sell stop order
@$88.34
below the lowest low of the day.
Market orders are too expensive in the long term.
Rocket boost this content to learn more.
Disclaimer:Trading is risky please learn
risk management and profit taking
strategies.Also use a simulation trading account
before before you trade with real money.

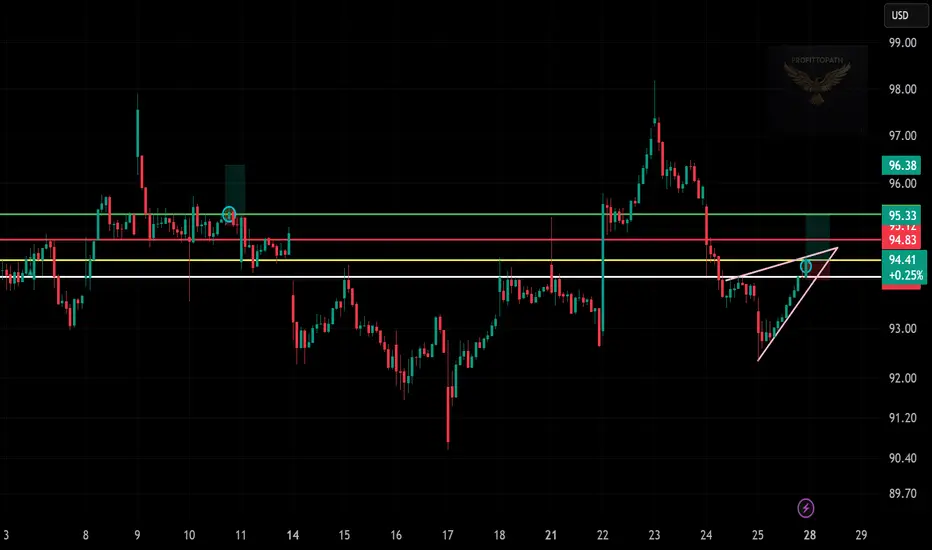
Long Trade Setup on $SBUX (Starbucks)📈
Entry: $94.41 (Breakout above mini wedge)
Stop Loss: $93.75 (Below trendline support)
Target: $96.38 (Key resistance zone)
Pattern: Rising Wedge breakout with bullish momentum
Risk-Reward Ratio: ~2.6R
Caution Zone: $94.83–$95.33 (multiple rejections in past)
SBUX Long Trade Brewing! Caught a symmetrical triangle breakout☕t 📈
Momentum is building — this could push to $96+ if it clears resistance 🚀
📍 Entry: $94.46
📉 SL: $93.70
🎯 TP1: $95.31
🎯 TP2: $96.02
Let’s see how this cup fills up! 🔥
#SBUX #StarbucksStock #BreakoutTrade #TechnicalAnalysis #StockTrader #TradingView #ProfittoPath #BullishMomentum #SmartTrading

Cup and Handle with a shot of espresso: A bullish blendSince March, Starbucks ( NASDAQ:SBUX ) has been in a sustained downtrend, gradually rounding out a base. Now, the chart is showing early signs of a trend reversal.
Yesterday, price broke out of a bull flag formation on the daily chart and is now testing the $95.50 zone — a critical neckline level of a cup and handle pattern.
✅ Bullish Scenario:
A clean break and hold above $95.50 would confirm the cup-and-handle breakout.
If confirmed, this setup could target a measured move that eventually retests all-time highs.
More conservative traders may want to wait for a back test of the $95.50 neckline as confirmation, especially given its past historical significance.
⚠️ Bearish Invalidation:
A break and hold below $95.50 would invalidate the cup-and-handle pattern, suggesting the breakout has failed.
📌 This is a purely technical idea. No fundamentals involved.
As always, Happy Hunting!
This is not financial advice. Always do your own due diligence

Consumers sentiments changing direction in ChinaFor quite some years, it was the novelty, foreign and luxury brands that sits well with many Chinese who aspires a different kind of lifestyle, thanks to the western social media influence.
Fast forward years later, with the continuing depressed property market, tepid job market and deflationary environment where many middle income consumers are reluctant to spend more than necessary on the things they like.
Take for example, coffee. China was a tea drinking culture country but Starbucks managed to overturn the tide and slowly influence many youngsters especially those in tier 1-2 cities to switch to coffee. And they succeeded...........until recently............
Looking at the chart , we can see that Luckin coffee has rally while Starbucks is fighting hard to maintain its market shares, especially in China.
Same taste but cheaper , why not ? Consumers are practical when face with uncertainties especially in the job market. They will still spend money but want to stretch the dollar unlike before. This shift in consumer sentiments means a lot to the marketeers who need to change their pricing, promotional strategies...

PDF-RDF-LDT-BBA perceived fibonacci pattern was fulfilled when SB stock was at 117USD, seeing a drop that could have given us liquidation in a matter of a month, reaching a trend line waiting for a price change fulfilling a fibonacci retracement when the price reached 76USD, giving us liquidation to buy for two months and counting

Starbucks Breakout: Bullish Triangle Targets $94.90" 🚀📈"
📝 Caption/Description:
✅ Long Trade Setup on SBUX (30-min Chart)
🔹 Entry: $91.45
🔹 Stop Loss: $90.26
🔹 Target: $94.90
🔹 R:R Ratio: ~1:2.8
🔸 Breakout from symmetrical triangle with bullish momentum
🔸 Watch resistance around $93.10 for partial profits
📊 Strategy: Breakout + Trend Continuation
🦅 Powered by ProfittoPath

Starbucks (SBUX) Breaks Resistance Starbucks (SBUX) has just broken above the key resistance level around $89.50, which previously acted as a strong support-turned-resistance zone.
SBUX ASCENDING TRIANGLEPretty clear ascending triangle forming for SBUX, still a bit early by the book especially with trumps ability to move markets. Absolutely something to keep an eye on

Sbux to $100Sbux sitting in a strong support level. I believe it will come back up $100 in the next month or two. I am not an expert just sharing my thoughts.
I did open some long term call options . Exp: 3/2026.
Starbucks Stock Chart Fibonacci Analysis 051225Trading Idea
1) Find a FIBO slingshot
2) Check FIBO 61.80% level
3) Entry Point > 85/61.80%
Chart time frame: D
A) 15 min(1W-3M)
B) 1 hr(3M-6M)
C) 4 hr(6M-1year)
D) 1 day(1-3years)
Stock progress: A
A) Keep rising over 61.80% resistance
B) 61.80% resistance
C) 61.80% support
D) Hit the bottom
E) Hit the top
Stocks rise as they rise from support and fall from resistance. Our goal is to find a low support point and enter. It can be referred to as buying at the pullback point. The pullback point can be found with a Fibonacci extension of 61.80%. This is a step to find entry level. 1) Find a triangle (Fibonacci Speed Fan Line) that connects the high (resistance) and low (support) points of the stock in progress, where it is continuously expressed as a Slingshot, 2) and create a Fibonacci extension level for the first rising wave from the start point of slingshot pattern.
When the current price goes over 61.80% level , that can be a good entry point, especially if the SMA 100 and 200 curves are gathered together at 61.80%, it is a very good entry point.
As a great help, tradingview provides these Fibonacci speed fan lines and extension levels with ease. So if you use the Fibonacci fan line, the extension level, and the SMA 100/200 curve well, you can find an entry point for the stock market. At least you have to enter at this low point to avoid trading failure, and if you are skilled at entering this low point, with fibonacci6180 technique, your reading skill to chart will be greatly improved.
If you want to do day trading, please set the time frame to 5 minutes or 15 minutes, and you will see many of the low point of rising stocks.
If want to prefer long term range trading, you can set the time frame to 1 hr or 1 day.

Swing short for StarbucksExpecting this triangular price channel to hold. If a successful breakout were to occur, I'll look for a new long position.

Bullish on SBUXCurrently sitting on a strong support area these past few weeks. It can move upward in the next few weeks, back up to around 104. *This is not trading advise just my opinion.

Starbucks Wave Analysis – 2 May 2025
- Starbucks reversed from support zone
- Likely to rise to resistance levels 85.00 and 90.00
Starbucks recently reversed up from the support zone between the key support level 76.20 (which stopped the previous wave A at the start of April) and the lower daily Bollinger Band.
The upward reversal from this support zone stopped the C-wave of the previous intermediate ABC correction (2) from the start of March.
Given the strength of the support level 76.20 and the bullish divergence on the daily Stochastic, Starbucks can be expected to rise to the next resistance levels 85.00 and 90.00.

Starbucks Stock Chart Fibonacci Analysis 042825Trading Idea
1) Find a FIBO slingshot
2) Check FIBO 61.80% level
3) Entry Point > 82.3/61.80%
Chart time frame:D
A) 15 min(1W-3M)
B) 1 hr(3M-6M)
C) 4 hr(6M-1year)
D) 1 day(1-3years)
Stock progress: A
A) Keep rising over 61.80% resistance
B) 61.80% resistance
C) 61.80% support
D) Hit the bottom
E) Hit the top
Stocks rise as they rise from support and fall from resistance. Our goal is to find a low support point and enter. It can be referred to as buying at the pullback point. The pullback point can be found with a Fibonacci extension of 61.80%. This is a step to find entry level. 1) Find a triangle (Fibonacci Speed Fan Line) that connects the high (resistance) and low (support) points of the stock in progress, where it is continuously expressed as a Slingshot, 2) and create a Fibonacci extension level for the first rising wave from the start point of slingshot pattern.
When the current price goes over 61.80% level , that can be a good entry point, especially if the SMA 100 and 200 curves are gathered together at 61.80%, it is a very good entry point.
As a great help, tradingview provides these Fibonacci speed fan lines and extension levels with ease. So if you use the Fibonacci fan line, the extension level, and the SMA 100/200 curve well, you can find an entry point for the stock market. At least you have to enter at this low point to avoid trading failure, and if you are skilled at entering this low point, with fibonacci6180 technique, your reading skill to chart will be greatly improved.
If you want to do day trading, please set the time frame to 5 minutes or 15 minutes, and you will see many of the low point of rising stocks.
If want to prefer long term range trading, you can set the time frame to 1 hr or 1 day.

SBUX Earnings📉 SBUX – Descending Flag Breakdown Confirmed
The Selloff Structure is Set. The Next Leg May Be Swift.
What we’re seeing here is a classic case of nested bearish structure across multiple timeframes:
🔻 Descending Flag (Daily & 4H)
— Continuation patterns stacked on each other
— Lower highs, lower lows compressing price toward collapse
📊 Volume Confirms
— Volume tapering inside flag = exhaustion
— Delta volume: –23.5% → distribution is real, not a fade
⚠️ No Bullish Divergence
— Momentum remains bearish
— No MACD support, no RSI rebound — nothing to slow the slide
🎯 Price Map
$83.86 = current
$64 = next major structure
$59 → ultimate support test
$53 → breakdown zone if earnings disappoint
🧠 Thesis:
This isn’t a random dip — it’s a systematic unwind.
Franchise closures, margin compression, and retail tightening are feeding a fundamental downgrade beneath a clean technical signal.
I'm positioned for further breakdown.
Earnings could be the trigger.
And I don’t want the reversal. I want the flush.
🧱🦅📉
Let the structure do its job.
#SBUX #ShortSetup #BearishFlag #BreakdownTrade #TradingViewAnalysis

$SBUX Starbucks is opening its first 3D-printed facility in Texas! This could attract more customers and boost innovation. They’re also introducing a new dress code modernizing the look and shaping the future of the brand. #Starbucks #Innovation

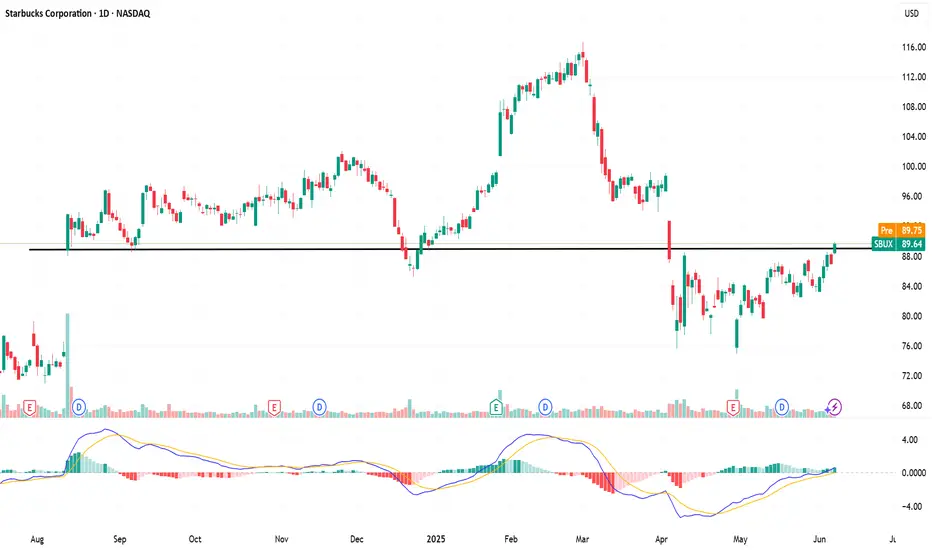
Frothy FOMO Coffee: Why Starbucks May Face a Harsh ReckoningWe may be staring down a considerable downside in Starbucks’ share price — and I suspect the decline could be severe. When a genuine recession hits — not the softened, cosmetically massaged versions we've seen bandied about — discretionary spending is the first casualty. And let us be honest: a $7 small latte, regardless of its oat milk or seasonal syrup, is the very definition of discretionary.
Inflation over the past four years has not been a natural occurrence. It is the predictable consequence of reckless fiscal policies and excessive monetary accommodation — in plain English, wasteful government spending and money printing. These policies have inflated prices across the board, and coffee is no exception.
What is perhaps underappreciated by most analysts is the brewing effect of tariffs. Come September, we will begin to see the real impact of trade friction on coffee imports from major producers such as Brazil and Colombia. Coffee futures already hit all-time highs in February. Although prices have since pulled back, I view that retreat not as relief, but as the first ominous sign that something is amiss.
Starbucks operates globally, but its margins are still vulnerable to supply chain shocks and input cost inflation. As the economic pain spreads, we should expect average consumers — not just in the US, but in Europe, Asia, and elsewhere — to make different decisions. The morning coffee ritual may remain, but the $7 takeaway will be replaced by home-brewed alternatives and budget-conscious behaviour.
I foresee the possibility of a bear flag pattern luring investors back in with a short-term rally — a classic trap, falsely interpreted as recovery. But please, do not be fooled by this. I believe Starbucks stock could drop sharply later this year, with a potential downside target around $57.80.
This will not be a gentle correction. I expect it to be brutal — marked by layoffs, store closures, and perhaps a reckoning of Starbucks’ business model itself, which is built upon the illusion of small luxuries being affordable in all seasons.
For the rational investor, this is not a time for sentiment or brand loyalty. It is a time for analysis, discipline, and preparation.
This is not investment advice. Do your own research. I could be wrong.
