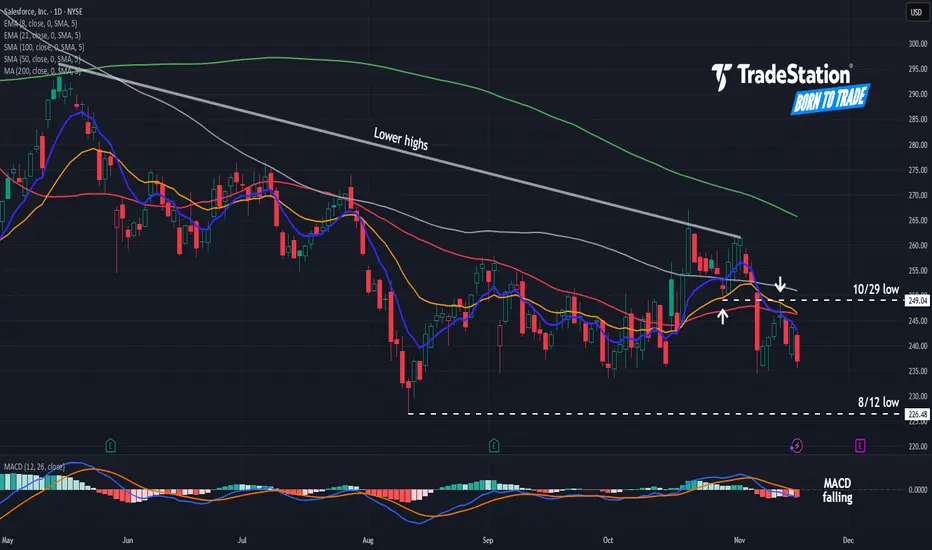
$CRM SALESFORCEA technical examination of Salesforce's ( NYSE:CRM ) price chart reveals a compelling and potentially decisive consolidation pattern currently in play. The prevailing structure points towards a bearish inclination, but it is also setting the stage for a significant breakout move in either direction.
Salesforce, Inc. Shs Unsponsored Brazilian Depositary Receipt Repr 0.04545 Sh
No trades
Key facts today
31,800.00
0.00 BRL
33.99 B BRL
207.82 B BRL
20.95 B
About Salesforce, Inc.
Sector
Industry
CEO
Marc Russell Benioff
Website
Headquarters
San Francisco
Founded
1999
ISIN
BRSSFOBDR003
FIGI
BBG00CRHRDP1
Salesforce, Inc. engages in the design and development of cloud-based enterprise software for customer relationship management. Its solutions include sales force automation, customer service and support, marketing automation, digital commerce, community management, collaboration, industry-specific solutions, and salesforce platform. The firm also provides guidance, support, training, and advisory services. The company was founded by Marc Russell Benioff and Parker Harris in 1999 and is headquartered in San Francisco, CA.
Related stocks

Salesforce May Be SlidingSalesforce has limped despite the broader market climbing. Now some traders may see risk of a bigger slide in the software company.
The first pattern on today’s chart is the series of lower highs since mid-May. That could suggest sellers outnumber buyers.
Second, the 50-day simple moving average
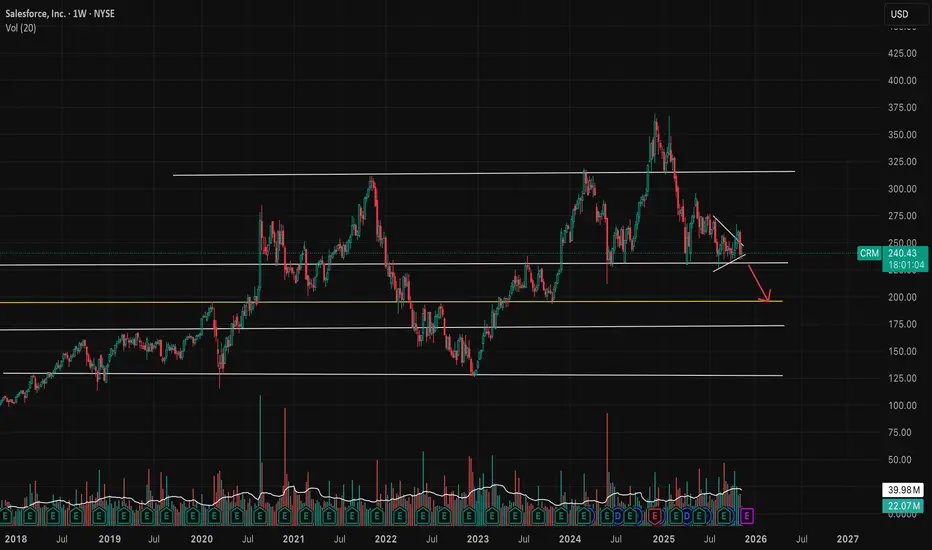
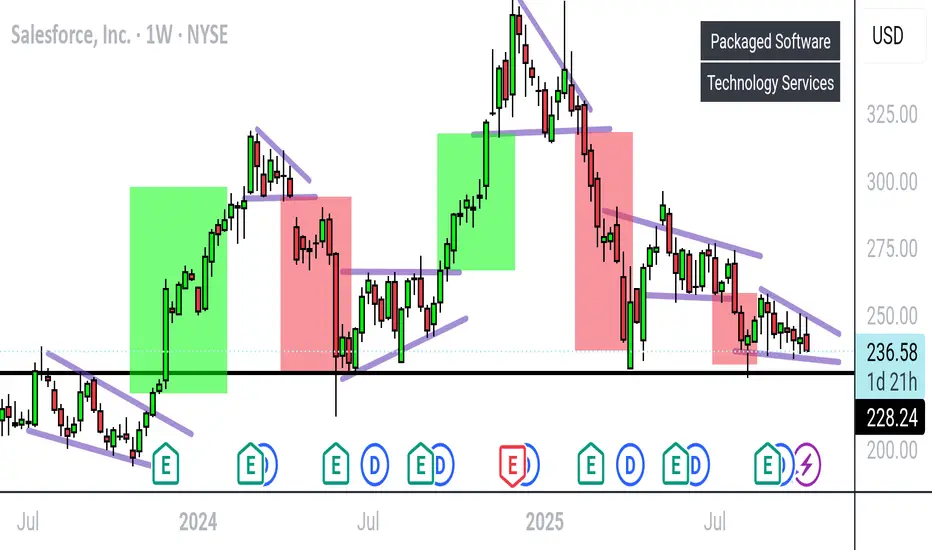
Bear flag on weekly chart, Further breakdown?- NYSE:CRM is forming bear flag on weekly chart.
- It could break down further and test some support underneath around $195
CRMThe 20-day, 50-day, and 100-day moving averages are all below the current price (~US$255), giving “buy” signals under many moving-average systems. Salesforce is a leader in the enterprise cloud-software / CRM market, and it’s pushing into AI and data-cloud initiatives—areas with potential upside if

CRM LONG TO $510 - CALL HAS LEGS, THE NUMBERS JIVE, READ ON!Salesforce (CRM) stands out in the market with strong premium valuations justified by robust financial performance, innovative AI-driven products, and disciplined capital management, all pointing toward a bullish but measured long-term outlook.
First, key valuation ratios reveal Salesforce’s high m

How to Generate More Profits During Earnings SeasonWho is in control of Price on the Day of the Earnings season CEO reports requires studying the stock chart 2-4 weeks ahead of the estimated date of the report.
Smaller Funds activity will disrupt runs intraday.
Professional Trading Companies are very active.
HFTs AI are making huge errors causing wh

Salesforce Reinvents Itself with AI and Projects Over $60BSalesforce Reinvents Itself with AI and Projects Over $60B by 2030
By Ion Jauregui – Analyst at ActivTrades
Salesforce (NYSE:CRM) has staged a true comeback in 2025, following the announcement of its ambitious forecast to surpass $60 billion in revenue by 2030. The global leader in CRM software h
CRM STOCK ANALYSIS Market Risk
Stock prices can fluctuate due to overall market movements caused by economic changes, political events, interest rate adjustments, or global crises. Even strong companies can lose value during market downturns.
Company-Specific Risk
The performance of an individual company can affect i
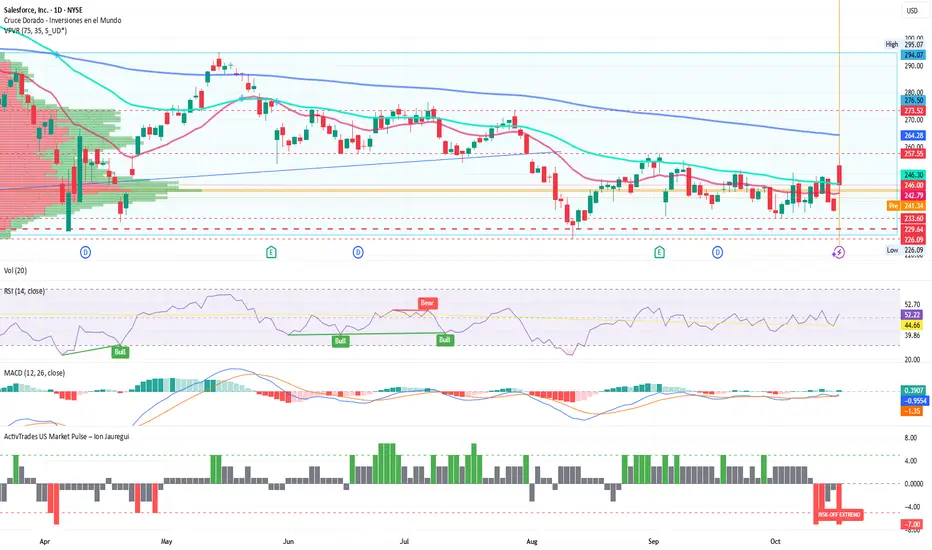
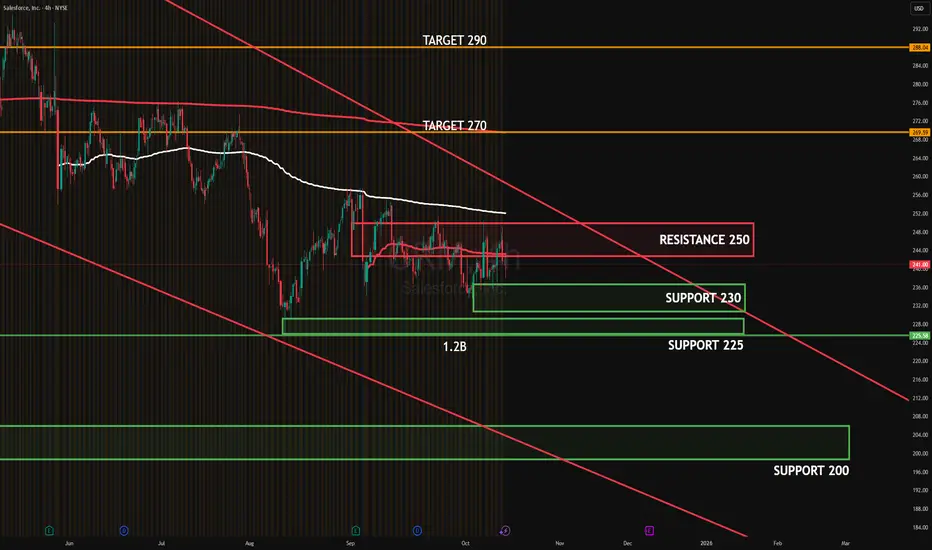
CRM OCT 2025CRM 4H: Price remains capped by 246–250 supply under the descending trendline, while buyers continue to defend 230–225 demand. The 230 test showed notable absorption (~1.2B), suggesting that institutions supported the dip; however, until 250 is reclaimed, that area acts as a distribution point.
Tar
CRM – Daily Chart | Holding Key Demand Zone Before Possible Reve⚙️ Key Levels
Zone Level Description
🔴 Major Resistance (Retail Zone) 367.09 Prior structural peak and key distribution area. Any rally back toward this level may face heavy selling pressure.
🟣 Extended Target Zone 451.81 Long-term Fibonacci extension level; full recovery point if momentum re-enter

See all ideas
Summarizing what the indicators are suggesting.
Oscillators
Neutral
SellBuy
Strong sellStrong buy
Strong sellSellNeutralBuyStrong buy
Oscillators
Neutral
SellBuy
Strong sellStrong buy
Strong sellSellNeutralBuyStrong buy
Summary
Neutral
SellBuy
Strong sellStrong buy
Strong sellSellNeutralBuyStrong buy
Summary
Neutral
SellBuy
Strong sellStrong buy
Strong sellSellNeutralBuyStrong buy
Summary
Neutral
SellBuy
Strong sellStrong buy
Strong sellSellNeutralBuyStrong buy
Moving Averages
Neutral
SellBuy
Strong sellStrong buy
Strong sellSellNeutralBuyStrong buy
Moving Averages
Neutral
SellBuy
Strong sellStrong buy
Strong sellSellNeutralBuyStrong buy
Displays a symbol's price movements over previous years to identify recurring trends.
US79466LAM6
Salesforce, Inc. 3.05% 15-JUL-2061Yield to maturity
5.64%
Maturity date
Jul 15, 2061
US79466LAL8
Salesforce, Inc. 2.9% 15-JUL-2051Yield to maturity
5.59%
Maturity date
Jul 15, 2051
US79466LAK0
Salesforce, Inc. 2.7% 15-JUL-2041Yield to maturity
5.32%
Maturity date
Jul 15, 2041
US79466LAJ3
Salesforce, Inc. 1.95% 15-JUL-2031Yield to maturity
4.24%
Maturity date
Jul 15, 2031
US79466LAH7
Salesforce, Inc. 1.5% 15-JUL-2028Yield to maturity
3.89%
Maturity date
Jul 15, 2028
US79466LAF1
Salesforce, Inc. 3.7% 11-APR-2028Yield to maturity
3.83%
Maturity date
Apr 11, 2028
See all SSFO34 bonds
Curated watchlists where SSFO34 is featured.


