Walmart Beat the S&P 500 Over 12 Months. What Its Chart SaysWalmart NYSE:WMT has been on a tear over the past year, rising 37.1% over the past 12 months vs. 16.1% for the S&P 500. What does the retail giant's technical and fundamental analysis say heading into this week's Q2 earnings report?
Let's check things out:
Walmart's Fundamental Analysis
As a former sergeant, I can tell you there's only one question commonly asked when the U.S. military sends someone to some small corner of America instead of a base with a post exchange: "Is there a Walmart nearby?"
If there is, you know you'll get whatever you need at a fair price. To many Americans, that's all that matters.
We'll see how much that applied in Q2 on Thursday, when Walmart reports earnings ahead of the opening bell.
Analysts expect the retail giant to report $0.74 on adjusted earnings per share on $174.2 billion of revenue.
That would represent 10.4% year-over-year earnings growth from the $0.67 in adjusted EPS that Walmart reported in Q2 2024, as well as about 3% in 12-month revenue gains
Of the 33 sell-side analysts that I found that cover Walmart, 24 have revised their earnings estimates higher since the quarter began, while five have revised their forecasts lower. (Four made no changes.)
Walmart's Technical Analysis
Now let's look at WMT's chart going back 10 months and running through Aug. 14:
Some real risk looks like it's present in this chart.
At first, I thought I saw what's called a "cup-with-handle" pattern, denoted by the purple curving line in the chart's center. That would be bullish technically.
But then I realized that I might be looking at a so-called "double-top" pattern of bearish reversal, as marked with the pink pyramids in the chart above.
Even if that's wrong, this chart still illustrates elevated risk for the stock. After all, the double-top pattern's downside pivot is all the way down at $80 -- a 20% haircut from the $100.70 that Walmart closed at on Monday.
That said, WMT's Relative Strength Index (or "RSI," denoted by a gray line at the chart's top) is better than neutral.
Meanwhile, the stock's daily Moving Average Convergence Divergence indicator (or "MACD," the black and gold lines and blue bars at the chart's bottom) appears to still be bullishly postured.
However, readers will see that the histogram of Walmart's 9-day Exponential Moving Average (or "EMA," marked by blue bars) appears to be headed lower towards the zero-bound.
Similarly, the stock's 12-day EMA (the black line) appears to be curling lower towards the 26-day EMA (the gold line). A crossover of those two lines would likely represent a short- to medium-term bearish signal.
(Moomoo Technologies Inc. Markets Commentator Stephen “Sarge” Guilfoyle had no position in WMT at the time of writing this column.)
This article discusses technical analysis, other approaches, including fundamental analysis, may offer very different views. The examples provided are for illustrative purposes only and are not intended to be reflective of the results you can expect to achieve. Specific security charts used are for illustrative purposes only and are not a recommendation, offer to sell, or a solicitation of an offer to buy any security. Past investment performance does not indicate or guarantee future success. Returns will vary, and all investments carry risks, including loss of principal. This content is also not a research report and is not intended to serve as the basis for any investment decision. The information contained in this article does not purport to be a complete description of the securities, markets, or developments referred to in this material. Moomoo and its affiliates make no representation or warranty as to the article's adequacy, completeness, accuracy or timeliness for any particular purpose of the above content. Furthermore, there is no guarantee that any statements, estimates, price targets, opinions or forecasts provided herein will prove to be correct.
Moomoo is a financial information and trading app offered by Moomoo Technologies Inc. In the U.S., investment products and services on Moomoo are offered by Moomoo Financial Inc., Member FINRA/SIPC.
TradingView is an independent third party not affiliated with Moomoo Financial Inc., Moomoo Technologies Inc., or its affiliates. Moomoo Financial Inc. and its affiliates do not endorse, represent or warrant the completeness and accuracy of the data and information available on the TradingView platform and are not responsible for any services provided by the third-party platform.
WALM34 trade ideas

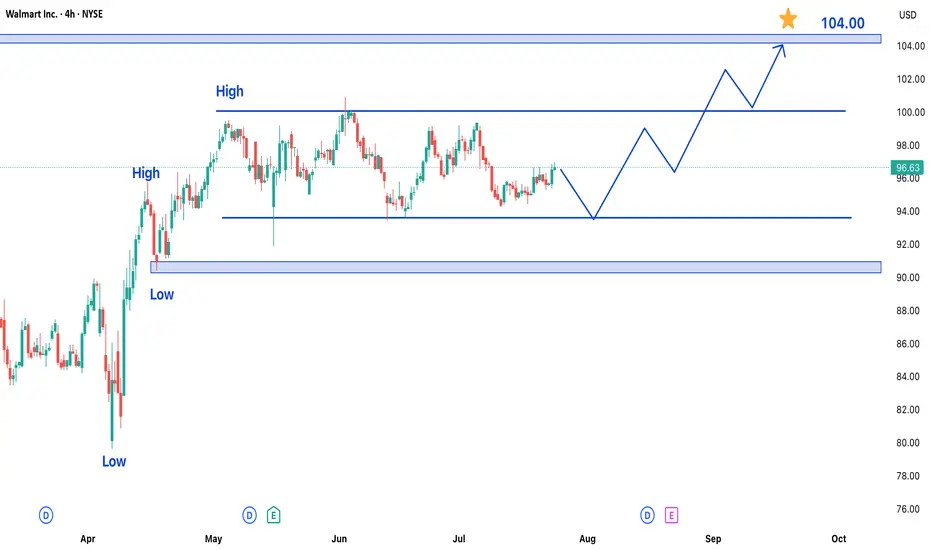
Walmart Stock Trading in Bullish Trend – Upside Potential AheadWalmart Inc. (WMT) shares are currently exhibiting a bullish trend, maintaining upward momentum over recent trading sessions. While the stock has been consolidating in a range over the past few days, the broader outlook remains positive, suggesting potential for further gains in upcoming sessions.
Key Observations:
- Established Uptrend: Walmart's price action reflects sustained buying interest, keeping the stock in a bullish phase.
- Range-Bound Consolidation: Recent sideways movement indicates a temporary pause, often a precursor to the next directional move.
- Strong Support & Resistance Levels: The stock has formed clear reference points for traders to watch.
Price Projections:
- Upside Target at $105: A breakout above the current range could propel WMT toward the $105 resistance level, representing a significant upside opportunity.
- Key Support at $90: On the downside, the $90 level has emerged as a strong support zone. Any pullback is likely to find buying interest near this area.
Market Implications:
1. Bullish Continuation Likely: The consolidation within an uptrend typically resolves in the direction of the prevailing trend—in this case, upward.
2. Breakout Potential: A decisive move above the recent range high could accelerate buying momentum toward $105.
3. Risk Management Consideration: While the bias is bullish, a drop below $90 would signal weakening momentum and potentially invalidate the near-term upside scenario.
Trading Strategy:
- Entry: Consider long positions on a confirmed breakout above the range, or on dips near $90 support.
- Stop Loss: A close below $90 would suggest a trend reversal, warranting exit from bullish positions.
- Target: $105 serves as the primary upside objective, with interim resistance levels to monitor along the way.
Final Thoughts:
Walmart’s stock appears poised for further gains, with $105 as the next key target. Traders should watch for a breakout from the current range while keeping an eye on the $90 support level for risk management. As always, confirmation through price action and volume will be crucial for validating the bullish thesis.
Impulse buying WMT is always better than impulse buying AT WMTI meant to post this Friday and something came up. I meant to post it again Saturday but the weather was too nice. I meant to post this yesterday but my computer was glitchy. So hopefully this will post this morning. And if she goes higher from here, feel free not to give me credit because I'm posting this pre-market and it's up already. I'm mainly posting this because there's always a decent chance it goes lower after the open and makes me not a cheater. But I got in Friday at the close at 96.76.
WMT has always been a favorite retail stock to trade for me, along with TSCO and CASY. I've never lost a penny trading any of them. Good times or bad, WMT always has customers. And while few would suspect it, its performance has been on par with most of the Mag 7 stocks over the last 5Y - see performance table. Whenever I need exposure to retail in my portfolio, WMT is at worst the second stock I check to see if it's on sale - and it is.
The title of this post is a bit misleading, though. I don't impulse buy WMT. WMT is a stock that I have as much backtesting data on as almost any stock I trade, data going back to 1972. With nearly 1400 real and backtested trades without a single loss, I have as much confidence I will make money on a WMT trade as almost anything out there. It may not be a huge gain, but that's not what I do. I want a consistently uptrending equity curve in my portfolio with low drawdown risk. Something as reliable as WMT is tailor made for this. Add in massive liquidity and while I pull the trigger immediately on WMT when I need retail and it's on sale, it's never on impulse. It fits what I do and I know it works.
That said, its returns with my signals this year have been pretty breathtaking (see table on the price chart). That +59% isn't compounded gains, either. That's simply adding the % gains of the 27 wins together (using equal dollar amount lots in each trade). SPY is having a good year and the WMT trades are kicking its ass.
So here I go again, shopping the sale on WMT. I may add more if a tactical opportunity presents itself, but I won't dive in quickly. I usually have a 3-day wait rule after earnings are poorly received for a stock and we are only at day 2 so far, so it could well go lower from here before it rises, and I don't want to get overexposed. Portfolio balance and risk management always take priority over quick profits for me. Adding will need the right situation, but I'm happy to do so if that situation presents itself.
As always - this is intended as "edutainment" and my perspective on what I am or would be doing, not a recommendation for you to buy or sell. Act accordingly and invest at your own risk. DYOR and only make investments that make good financial sense for you in your current situation.

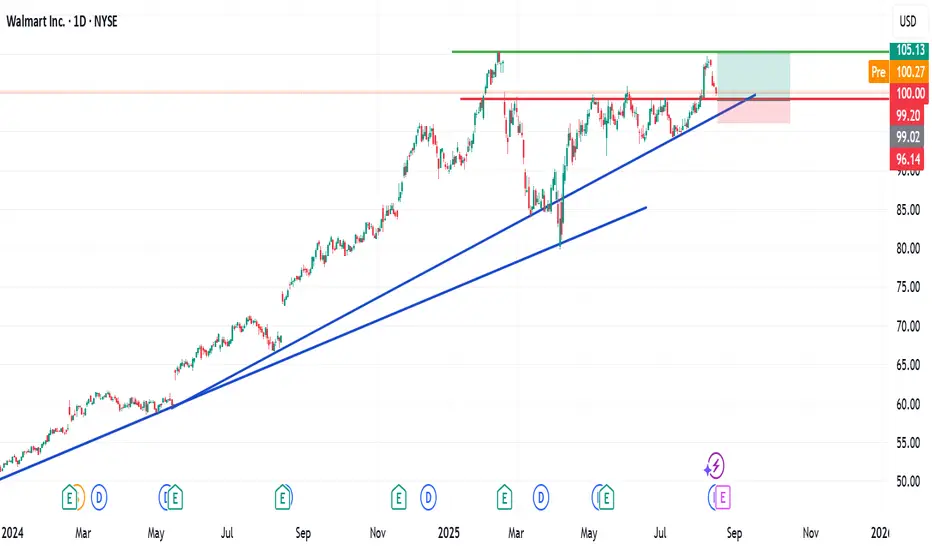
WMT - Walmart turns southI attached the A-Handle of the fork to the GAP from November 2025, because a GAP is also a Pivot.
As we see, price reacts not bad at the Centerline.
Price failed to make a new high.
Then it broke the Centerline and retested it.
No we are trading in the midst of the old accummulation zone where Buyers hung out.
A nice bounce would be a good short opportunity.
Breaking the support zone also, but with lower Risk/Reward ratio.
Observing WMT for a potential short.

Walmart Earnings Play: Cheap Calls Into Earnings
## 🚀 Walmart Earnings Play: Cheap Calls Into Earnings (Aug 21, 2025) 🚀
### 🏦 Earnings Outlook
* 📊 **Revenue Growth:** +2.5% TTM (stagnant but stable)
* ⚖️ **Margins:** Thin → Profit Margin 2.7%, Operating Margin 4.3%
* 🏷️ **Analyst Sentiment:** Still *Strong Buy*, but guidance slippage = caution
* 🛡️ **Defensive Sector:** WMT benefits from consumer staples resilience
---
### 🔎 Options Flow Insight
* 📉 **Put Activity:** Heavy flow at \$97.00 strike = hedging/defensive tone
* ⚠️ **Put/Call Skew:** Bearish leaning, but IV rising ahead of earnings
* 📈 **Opportunity:** Leverage upside surprise with cheap calls
---
### 📉 Technical Setup
* 📊 Trading **below 20D & 50D MAs** (neutral → bearish drift)
* 🔑 **Key Levels:** Support \$97, Resistance \$105
* 💥 Volume spike: 2.48x avg (earnings speculation)
---
### 🎯 Trade Setup (Earnings Play)
* 🟢 **Direction:** CALL (Bullish Bias)
* 🎯 **Strike:** \$102.00
* 💵 **Entry Price:** \$0.04
* 📅 **Expiry:** Aug 22, 2025
* 📊 **Size:** 2 contracts
* 🕒 **Entry Timing:** Pre-earnings close
📌 **Profit Target:** \$0.08 (200% 🚀)
📌 **Stop Loss:** \$0.02 (50% risk cap)
📌 **Exit Rule:** Within 2 hours of earnings OR market open to avoid decay
---
🔥 Hashtags for Reach 🔥
\#WMTEarnings #OptionsTrading #EarningsPlay #TradingSetup #SP500 #OptionsFlow #StockMarket #DayTrading #SwingTrading

My 5% upside for WalmartMy 5% upside for Walmart.
There is a likely chance that WMT may push up from this psychological $100 zone. If this happens, we may see a 5% upside as shown on my chart with a risk-reward ratio of 1:2.1.
If it, however, drops further to the trend line, I will buy more using DCA and aim for 7% TP.
Trade with care
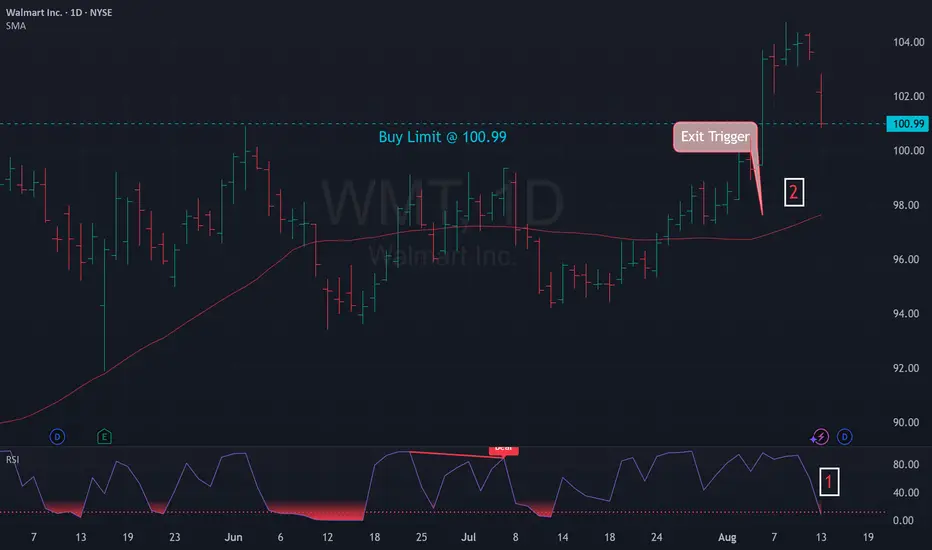
Mean Reversion Setup: WMT1. RSI in oversold region
2. Price likely to rebound back the the mean
Trade Rules:
Entry Trigger - RSI has cross below oversold region, enter limit buy at close price
Exit Trigger - Close at market when close price cross above exit trigger (Red Line)

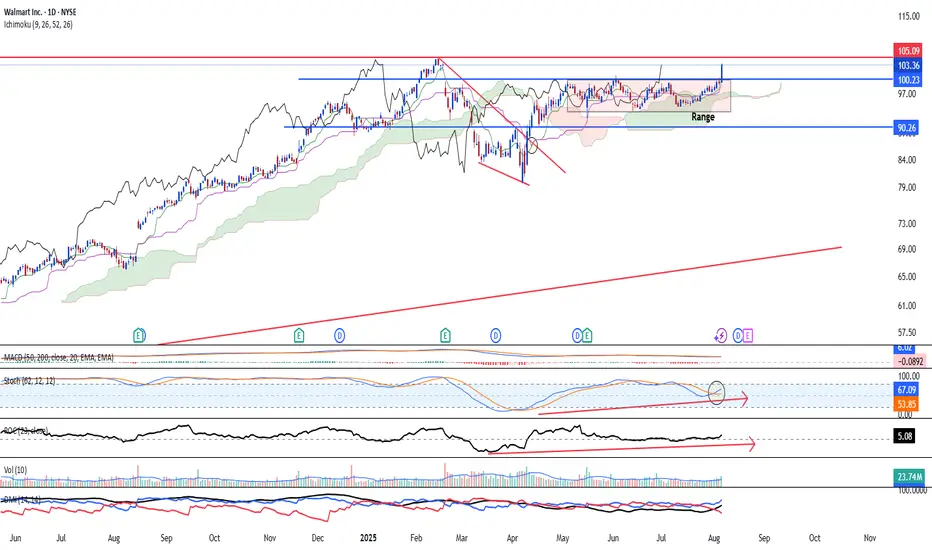
Will Walmart break into a new high NYSE:WMT Walmart has broken out of the consolidative range and is entering into a new high going forward. Major uptrend remain intact and ichimoku is showing a three bullish golden cross.
Long-term MACD is flat while Stochastic Oscillator has been rising steadily and formed a crossover above the 50 midpoint level. 23-period ROC is back into the positive zone. Volume has been rising steadily and expansion is healthy.
Key support is at 91.00. Target will be at 114 in the near-term and 135 over the longer-term period.
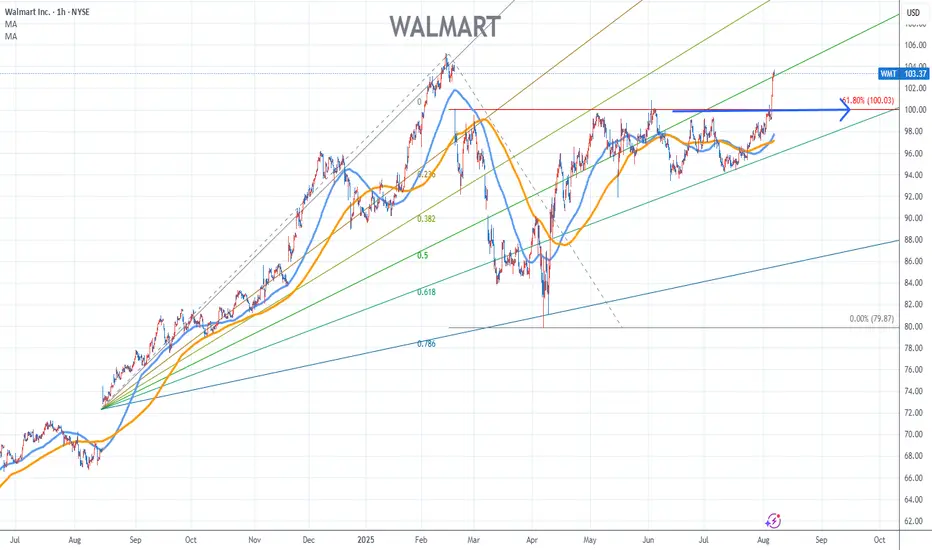
Walmart Stock Chart Fibonacci Analysis 080625Trading Idea
1) Find a FIBO slingshot
2) Check FIBO 61.80% level
3) Entry Point > 100/61.80%
Chart time frame:B
A) 15 min(1W-3M)
B) 1 hr(3M-6M)
C) 4 hr(6M-1year)
D) 1 day(1-3years)
Stock progress:A
A) Keep rising over 61.80% resistance
B) 61.80% resistance
C) 61.80% support
D) Hit the bottom
E) Hit the top
Stocks rise as they rise from support and fall from resistance. Our goal is to find a low support point and enter. It can be referred to as buying at the pullback point. The pullback point can be found with a Fibonacci extension of 61.80%. This is a step to find entry level. 1) Find a triangle (Fibonacci Speed Fan Line) that connects the high (resistance) and low (support) points of the stock in progress, where it is continuously expressed as a Slingshot, 2) and create a Fibonacci extension level for the first rising wave from the start point of slingshot pattern.
When the current price goes over 61.80% level , that can be a good entry point, especially if the SMA 100 and 200 curves are gathered together at 61.80%, it is a very good entry point.
As a great help, tradingview provides these Fibonacci speed fan lines and extension levels with ease. So if you use the Fibonacci fan line, the extension level, and the SMA 100/200 curve well, you can find an entry point for the stock market. At least you have to enter at this low point to avoid trading failure, and if you are skilled at entering this low point, with fibonacci6180 technique, your reading skill to chart will be greatly improved.
If you want to do day trading, please set the time frame to 5 minutes or 15 minutes, and you will see many of the low point of rising stocks.
If want to prefer long term range trading, you can set the time frame to 1 hr or 1 day.
WMT eyes on $95.68 above 93.38 below: Double Golden fibs are KEYWMT has been orbitting this Double Golden zone.
$95.68 is a Golden Genesis, $83.38 a Golden Covid.
This is the "highest gravity" cluster any asset can have.
This is a very important landmark in this stock's lifetime.
==================================================
.

Walmart's Bullish Possibilities Walmarts wedging, with a gap to fill above from earnings, and buying volume is starting to pick up after being low during the chop. Buying volume may continue to rotate into Walmart and send it up. Nfa

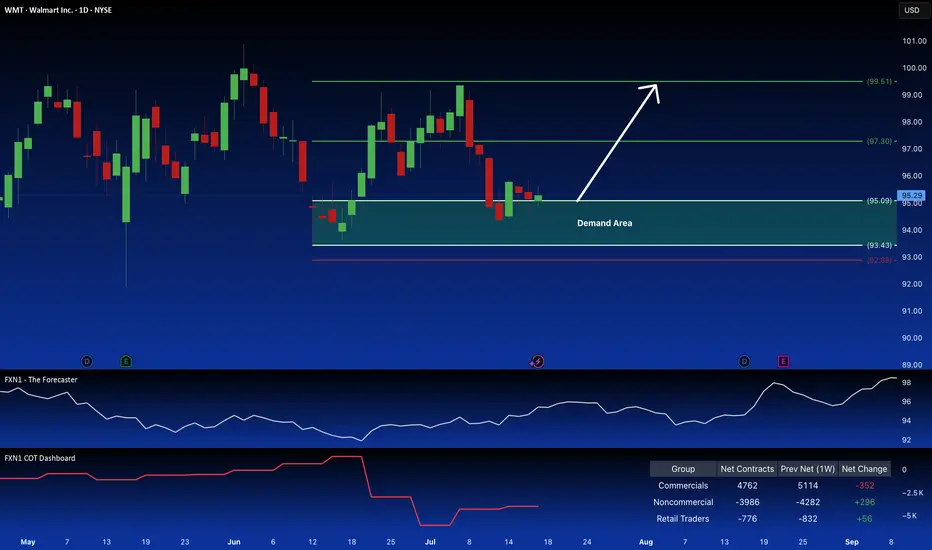
Walmart: Long Position Attractive on Demand ZoneWalmart Inc. presents a compelling long opportunity. The price action is reclaiming a key demand zone, suggesting a continuation of the current uptrend, a pattern reinforced by seasonal factors. Further bolstering the bullish case is the observed increase in large speculator positions.
✅ Please share your thoughts about WMT in the comments section below and HIT LIKE if you appreciate my analysis. Don't forget to FOLLOW ME; you will help us a lot with this small contribution.
Sell with the CEOWalmart CEO is selling a chuck of his stocks at this golden opportunity. Target price and stop loss indicated on the chart. This might take months to mature.
Walmart Stock Trading in Bullish Trend - Upside Potential AheadWalmart Inc. (WMT) shares are currently exhibiting a bullish trend, maintaining upward momentum over recent trading sessions. While the stock has been consolidating in a range over the past few days, the broader outlook remains positive, suggesting potential for further gains in upcoming sessions.
Key Observations:
- Established Uptrend: Walmart's price action reflects sustained buying interest, keeping the stock in a bullish phase.
- Range-Bound Consolidation: Recent sideways movement indicates a temporary pause, often a precursor to the next directional move.
- Strong Support & Resistance Levels: The stock has formed clear reference points for traders to watch.
Price Projections:
- Upside Target at $105: A breakout above the current range could propel WMT toward the $105 resistance level, representing a significant upside opportunity.
- Key Support at $90: On the downside, the $90 level has emerged as a strong support zone. Any pullback is likely to find buying interest near this area.
Market Implications:
1. Bullish Continuation Likely: The consolidation within an uptrend typically resolves in the direction of the prevailing trend—in this case, upward.
2. Breakout Potential: A decisive move above the recent range high could accelerate buying momentum toward $105.
3. Risk Management Consideration: While the bias is bullish, a drop below $90 would signal weakening momentum and potentially invalidate the near-term upside scenario.
Trading Strategy:
- Entry: Consider long positions on a confirmed breakout above the range, or on dips near $90 support.
- Stop Loss: A close below $90 would suggest a trend reversal, warranting exit from bullish positions.
- Target: $105 serves as the primary upside objective, with interim resistance levels to monitor along the way.
Final Thoughts:
Walmart’s stock appears poised for further gains, with $105 as the next key target. Traders should watch for a breakout from the current range while keeping an eye on the $90 support level for risk management. As always, confirmation through price action and volume will be crucial for validating the bullish thesis.

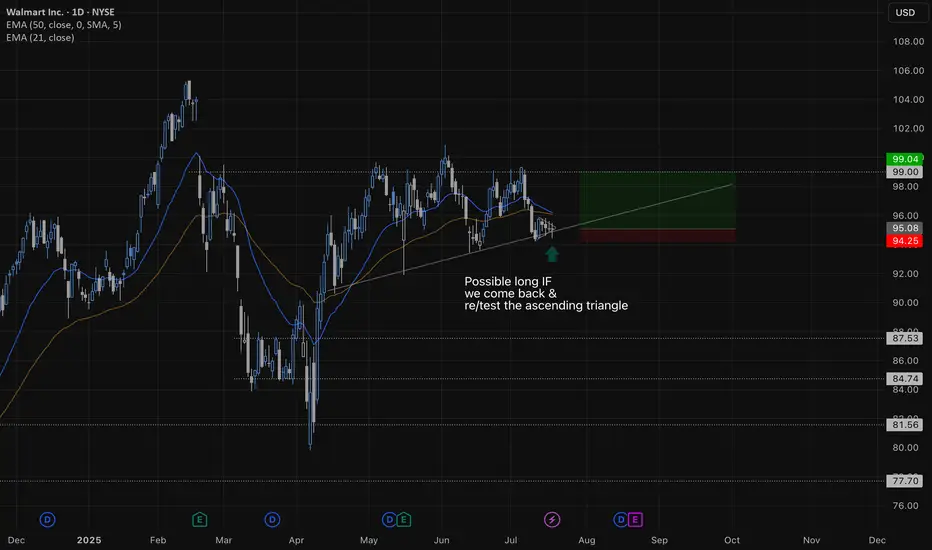
Walmart Long Taking Walmart long here, got a nice ascending triangle on the daily. We have 4 nice rejecting from the bottom trend line with nice consolidation on the daily. This was a 1h wedge and played it pretty aggressive expecting a break to the upside. I could have waited for a 1h break giving me more confirmation but I like the daily and the.
Stocks SPOT ACCOUNT: WMT stocks Buy Trade with Take ProfitStocks SPOT ACCOUNT: NYSE:WMT stocks my buy trade with take profit.
This is my SPOT Accounts for Stocks Portfolio.
Trade shows my Buying and Take Profit Level.
Spot account doesn't need SL because its stocks buying account.
Looks good Trade.
Disclaimer: only idea, not advice

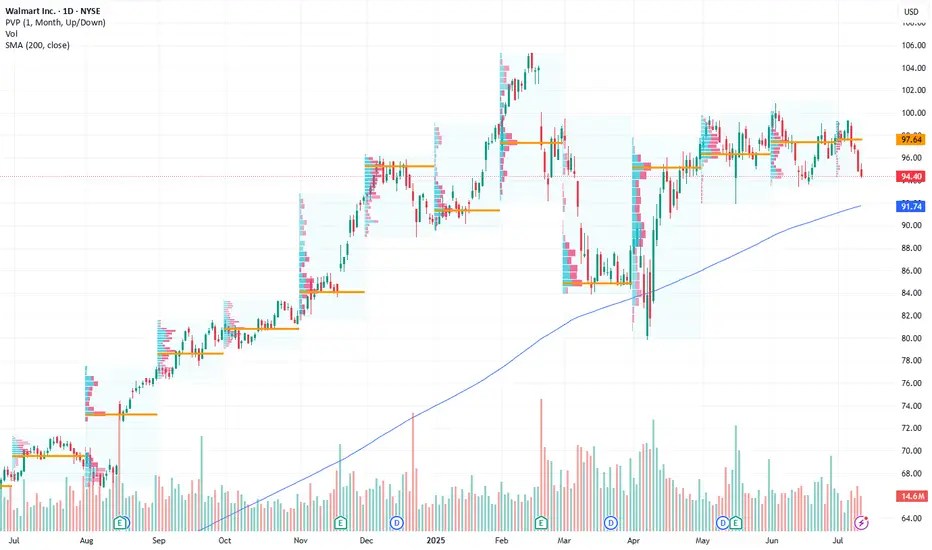
Walmart: Retail Giant Positioned for Growth Amid Bullish MomentuCurrent Price: $94.40
Direction: LONG
Targets:
- T1 = $98.20
- T2 = $101.80
Stop Levels:
- S1 = $92.10
- S2 = $90.40
**Wisdom of Professional Traders:**
This analysis synthesizes insights from thousands of professional traders and market experts, leveraging collective intelligence to identify high-probability trade setups. The wisdom of crowds principle suggests that aggregated market perspectives from experienced professionals often outperform individual forecasts, reducing cognitive biases and highlighting consensus opportunities in Walmart.
**Key Insights:**
Walmart continues to demonstrate resilience within the retail sector, benefiting from strong consumer spending trends. Its position at the 200-day simple moving average (SMA) indicates a key technical support level, providing investors with an attractive entry point for potential upside. As e-commerce gains momentum, Walmart’s operational strengths, bolstered by strategic pricing and logistics, emphasize its long-term growth potential. Consumer discretionary spending remains robust despite inflationary pressures, solidifying Walmart's steady trajectory.
The company's push into hybrid models of shopping, blending in-store and online experiences, has given it a significant edge over competitors. With strong leadership and strategic investments in technology and supply chain efficiencies, Walmart has proactively positioned itself for sustained profitability.
**Recent Performance:**
In recent sessions, Walmart’s price has shown resilience by maintaining stability at the $94 range, aligning closely with its 200-day SMA. Despite broader market volatility, bullish sentiment in the retail sector has supported investor confidence. Comparatively, Walmart has showcased better performance than many of its peers in controlling costs while expanding its digital footprint.
**Expert Analysis:**
Market experts view Walmart as a bellwether of the retail industry. Its ability to balance cost leadership with quality offerings underscores a competitive advantage. This analysis shows optimism for Walmart's e-commerce investments and operational efficiency. Technical indicators such as a narrowing Bollinger band suggest potential volatility expansion, which combined with recent upward price action, hints at possible bullish momentum. Indicators of increasing relative strength support the potential for breakout levels.
**News Impact:**
Retail activity has been positively influenced by consumer interest in savings-focused platforms, with Walmart emerging as a primary destination. Events like Amazon Prime Day indirectly bolster competition, driving visibility toward Walmart's comparable discount strategies. Additionally, Walmart's robust supply chain measures have ensured product availability, catering to high consumer expectations and supporting its market credibility.
**Trading Recommendation:**
With Walmart holding key technical support levels and benefiting from strong consumer trends, a long position appears substantiated. Traders should consider entering near the current price with stops placed below $92 for risk mitigation. Price targets at $98.20 and $101.80 reflect meaningful upside potential spurred by favorable market dynamics and Walmart’s strategic initiatives.
WMT is ready for another phase of the price discoveryThis Week (July 8 - 12):
Support: The 20-day moving average around $96.70 is the first floor. Below that, the key range support is at $95.00.
Resistance: The top of the range and the all-time high around $101.50 is the ceiling that needs to break.
Next Month (July):
Support: The main support for the entire structure is the $95.00 level. A break below that would be a major warning sign.
Resistance: If we break above $101.50, there is no overhead resistance. We would be in "blue sky territory," with a projected target near $108.

WMT : Potential Diamond Top BreakoutDiamond top pattern identified with potential breakout above $98.90 and downside support at the 9 & 20 ema of 97.47 and 97.09. Anticipated rate cuts and seasonal rotation may drive this above the breakout threshold.

Exact Entry Levels & Profit Potential (July 3, 2025)🎯 Market Structure Breakdown – Exact Entry Levels & Profit Potential (July 3, 2025)
📊 In today’s session, I revisit the market for the second time – and you’ll see why I’m ruling out some setups altogether. There’s value in looking twice. What did I miss earlier? It's all in the structure.
I break down price action step by step, highlight precise entry zones, and show where the real potential for movement lies. Clean levels, no guessing.
⚠️ Note: I don’t trade the first 10 seconds – all orders are placed after 9:30:10 and I'm looking for entries only until 11:30:00.
👉 Check out the full breakdown and stay ahead of the game.
NASDAQ:AMZN
NYSE:ANET
NASDAQ:AVGO
NYSE:BA
NASDAQ:COIN
NASDAQ:CZR
NYSE:DELL
NASDAQ:GOOG
NASDAQ:MSFT
NASDAQ:AMD
NASDAQ:RKLB
NASDAQ:SBUX
NASDAQ:SMCI
NYSE:VRT
NASDAQ:NVDA

Long Position Targeting Key Resistance LevelsCurrent Price: $97.27
Direction: LONG
Targets:
- T1 = $100.25
- T2 = $102.50
Stop Levels:
- S1 = $95.50
- S2 = $94.25
**Wisdom of Professional Traders:**
This analysis synthesizes insights from thousands of professional traders and market experts, leveraging collective intelligence to identify high-probability trade setups. The wisdom of crowds principle suggests that aggregated market perspectives from experienced professionals often outperform individual forecasts, reducing cognitive biases and highlighting consensus opportunities in Walmart.
**Key Insights:**
Walmart continues to outperform in the Consumer Defensive sector, showcasing resilience in both stable and adverse market conditions. Experts have highlighted the stock's inclusion among bullish setups for the upcoming week, reinforcing optimism surrounding its operational strength, demand consistency, and ability to withstand broader economic volatility. These factors make Walmart a compelling candidate for potential near-term upside.
**Recent Performance:**
Walmart has maintained solid momentum, benefiting from strength within the Consumer Defensive sector, which remains a preferred choice among investors during uncertain economic phases. The stock has positioned itself as a safe harbor amid broader market volatility, garnering attention alongside peer staples like Costco and Pepsi.
**Expert Analysis:**
Consensus among market analysts paints a favorable outlook for Walmart, rooted in its enduring competitive edge, operational reliability, and robust consumer demand. The bullish sentiment ahead aligns with Walmart's ability to cater to investors seeking both stability and moderate growth in uncertain conditions. Analysts’ perspectives suggest the stock may trend upward, particularly if it breaches next week’s projected resistance levels.
**News Impact:**
While no major recent announcements have been flagged, Walmart's sector resilience combined with market enthusiasm for its strategic positioning signals optimism. Investors should remain alert for potential catalysts such as earnings reports, operational strategy updates, or changes in consumer spending that could influence performance. Walmart’s reputation as a core staple positions it well for consistent interest and demand.
**Trading Recommendation:**
The positive sentiment surrounding Walmart’s operational strength and sector resilience makes it a strong candidate for a LONG position with an upside potential to the next resistance levels. With robust performance in uncertain conditions, Walmart presents traders with an opportunity for growth with defined risk parameters provided by the stop-loss levels.

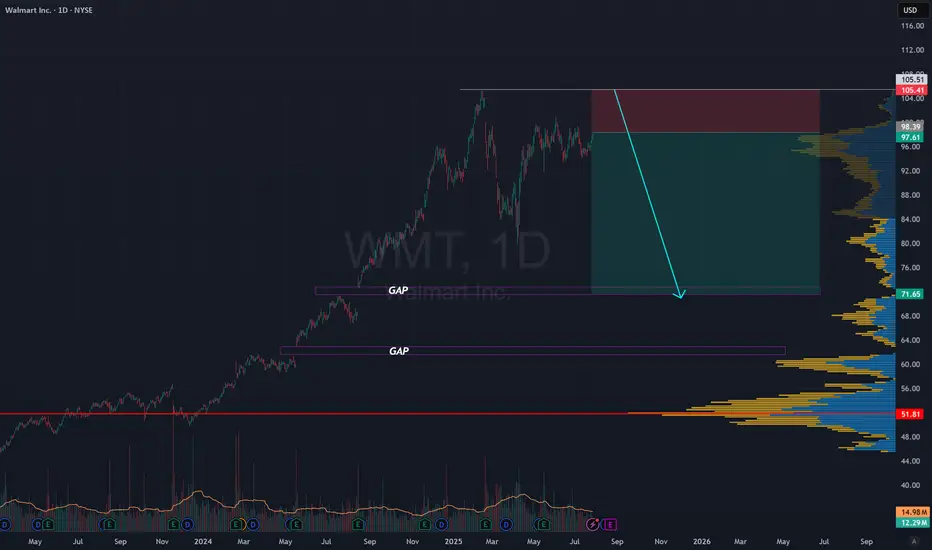
goes up to 100USD then Drop to 70USD for first step.It could eventually reach $100, but then, like most stocks on the US stock market, it will fall and fall to $70 in the first stage.
