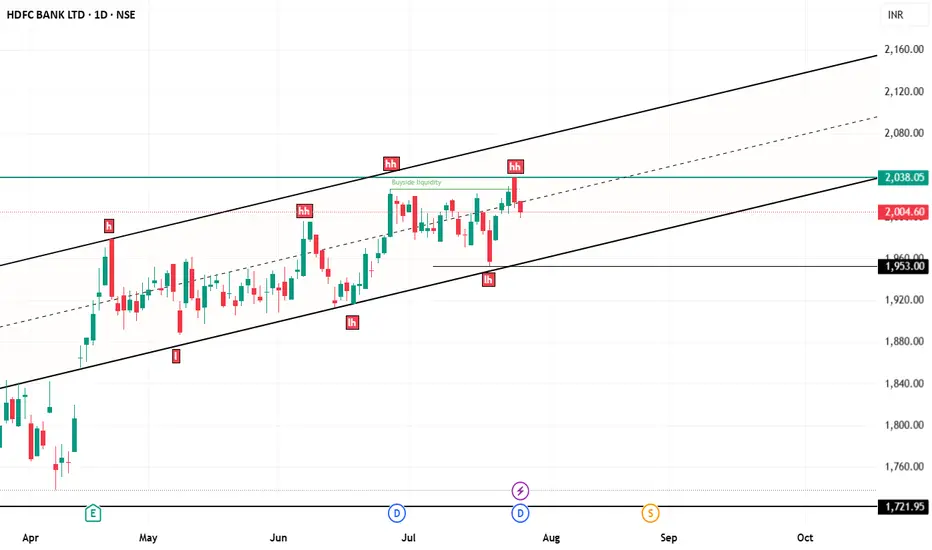
hdfc bank chart analysishdfc bank chart here in your screen
price working in parallel channel and 2038 is most important level for upside rise...
if 2038 break out with powerful vollume and candle then again we can see rally.
but a pattern here that is higer high and lower low...
HDB/N trade ideas
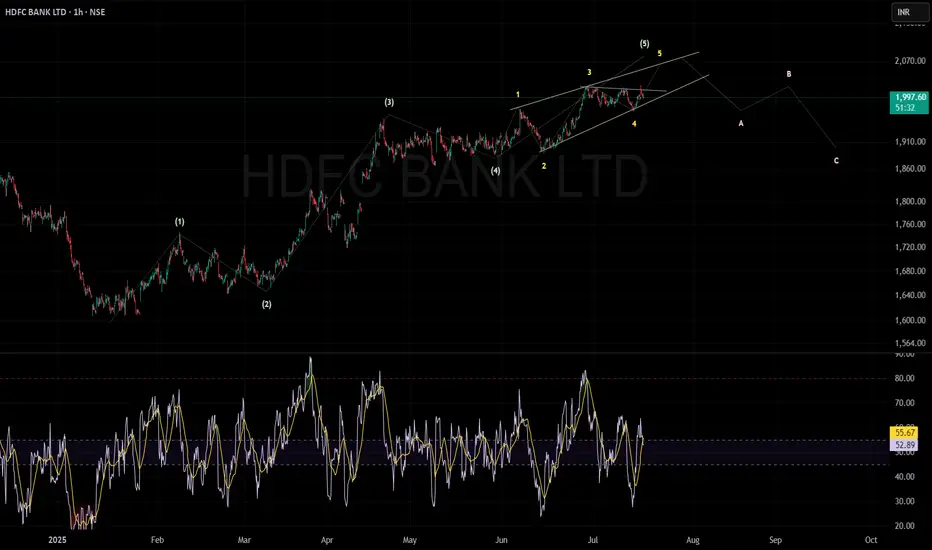
HDFC BANK can move 5th wave upHDFC Bank is currently in the last (5th) wave of an uptrend. This wave is moving inside a narrow, rising wedge pattern called an ending diagonal.
The price can move higher towards ₹2,050–₹2,100 before the trend finishes.
If the price breaks below the bottom of the wedge pattern (ending diagonal), it could confirm a trend reversal, likely leading to a correction.
After the peak, the chart suggests a three-step drop (A, B, and C waves), with possible support around ₹1,910 and then ₹1,850.
The RSI (Relative Strength Index) is around 53, meaning the trend isn't overbought or oversold yet.
In short: The uptrend is close to ending. Watch for a break below the wedge—this could start a move down toward ₹1,910 first, then maybe ₹1,850.
Risk Management in Options TradingTrading options can be exciting and rewarding—but it's also full of risks. Without proper risk management, even the best strategies can lead to heavy losses. In this comprehensive guide, we'll dive deep into how to manage risk in options trading, covering everything from the basics to advanced techniques.
1. Understanding Risk in Options Trading
Before we dive into managing risk, it’s crucial to understand where risk comes from in options trading. Options are complex instruments that behave differently than stocks. The key sources of risk include:
A. Price Movement (Delta Risk)
When the price of the underlying stock moves up or down, the value of the option changes. This is known as Delta risk. A call option gains value when the stock goes up, and a put gains value when it goes down.
B. Time Decay (Theta Risk)
Options lose value over time. Even if the stock price doesn’t move, the option could still lose value as the expiration date approaches. This is known as Theta decay or time decay.
C. Volatility (Vega Risk)
Volatility reflects how much a stock moves. High volatility increases an option's premium. But if implied volatility falls, the value of your option might drop—even if your price prediction is correct.
D. Interest Rates and Dividends (Rho and Dividend Risk)
Although less impactful, interest rates and dividend changes can also influence option prices. These are more important for longer-dated options.
2. Why Is Risk Management Critical in Options?
Options give traders leverage—a small investment can control a large position. While this magnifies profits, it also increases losses. Many beginners fall into the trap of chasing big gains, only to blow up their accounts when trades go wrong.
Good risk management doesn’t eliminate risk—it helps you survive bad trades and stay in the game long enough for your edge to work.
3. Core Principles of Options Risk Management
Here are the foundational principles every options trader should follow:
A. Never Risk More Than You Can Afford to Lose
It sounds obvious, but many traders ignore this. Only use disposable capital, not money meant for rent, bills, or emergencies.
B. Position Sizing
This is one of the most powerful tools in risk management. Don’t bet your entire capital on a single trade. A common rule is to risk 1-2% of your capital on any trade. That way, even a string of losing trades won’t wipe you out.
C. Diversify Your Trades
Avoid putting all your trades on the same stock or sector. Diversification can reduce risk from unexpected news events or market shocks.
D. Know Your Maximum Loss
Before entering any trade, calculate your maximum potential loss. With long calls and puts, your loss is limited to the premium paid. But with short options or complex strategies like spreads, losses can be higher or even unlimited.
4. Practical Risk Management Techniques
A. Use Stop-Loss Orders (Where Applicable)
While options don’t always behave like stocks, you can still set a mental or physical stop-loss based on:
Percentage loss (e.g., exit if the option loses 50%)
Underlying price level (e.g., exit if stock breaks below a key level)
Time decay (e.g., exit 5 days before expiration to avoid Theta crush)
❗ Note: Stop-losses can be tricky with options because of wide bid-ask spreads. It’s important to use limit orders or mental stops to avoid slippage.
B. Avoid Naked Options (Especially Selling)
Selling naked calls or puts can expose you to unlimited risk. Unless you have a large account and full understanding, stick to defined-risk strategies like:
Spreads (credit/debit)
Iron condors
Butterflies
Covered calls
Protective puts
C. Hedge Your Positions
Hedging is like buying insurance. You can reduce risk by combining options in a way that limits losses.
Example:
If you sell a naked put, you can turn it into a bull put spread by buying a lower strike put. This limits your downside if the stock crashes.
D. Use Probability and Greeks
Understanding the "Greeks" can help you analyze risk exposure:
Greek What it Measures Risk Managed
Delta Price sensitivity Directional risk
Theta Time decay Time-related loss
Vega Volatility impact Volatility exposure
Gamma Delta’s change rate Acceleration of price impact
Rho Interest rate impact (minor risk)
Knowing your Greeks allows you to adjust trades when risks become too high.
5. Options Strategies for Risk Management
Some strategies are naturally more “risky,” while others are designed to limit downside. Let’s look at popular risk-managed strategies:
A. Covered Call
You own 100 shares of a stock and sell a call option. This gives you income (premium) and limits upside risk.
Risk: Stock falls
Reward: Premium + upside to strike price
B. Protective Put
You buy a put while holding the stock. It protects you from downside losses, like insurance.
Risk: Cost of put (premium)
Reward: Unlimited upside; limited downside
C. Vertical Spreads (Credit and Debit)
These involve buying and selling options at different strikes.
Bull Call Spread: Buy call + sell higher call
Bear Put Spread: Buy put + sell lower put
Both strategies have limited risk and reward, making them ideal for risk-conscious traders.
D. Iron Condor
You sell a call spread and a put spread on the same stock. Profitable when the stock stays in a defined range.
Risk: Limited to width of spread minus premium
Reward: Net credit received
This is a great strategy for sideways markets and offers good risk/reward if managed well.
6. Managing Risk Over Time
A. Adjusting Trades
If a trade moves against you, you don’t always have to take the loss. You can:
Roll the option to a later expiration
Adjust strikes to collect more credit or redefine risk
Convert to a spread or different strategy
However, be careful not to over-manage trades, which can lead to complex and risky positions.
B. Avoid Trading Around Events
Earnings announcements, Fed meetings, and budget declarations can cause huge volatility spikes. Option premiums are often inflated before such events. If you trade them, keep position size small and use defined-risk trades only.
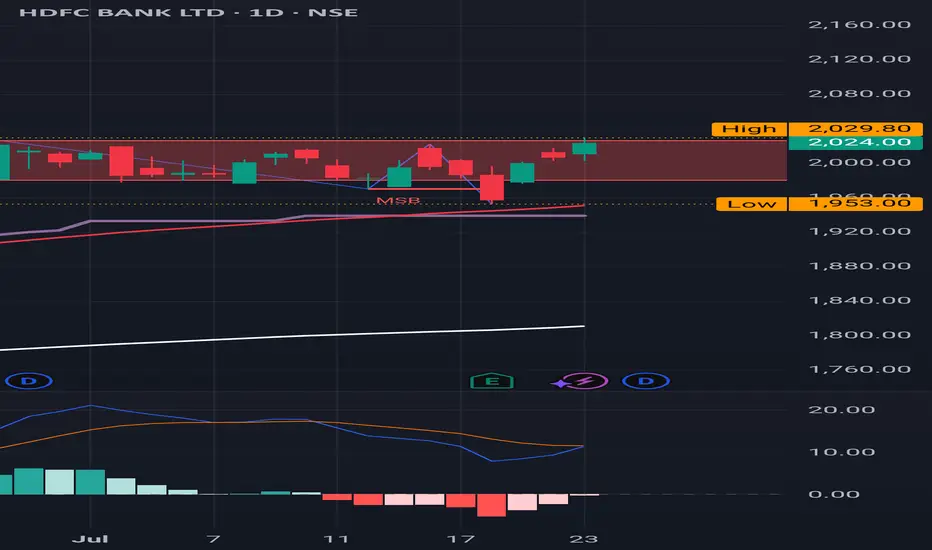
HDFC Bank : Sitting at a major Red Band Resistance
HDFC Bank : Sitting at a major Red Band Resistance
Daily Time Frame.
( Not a Buy / Sell Recommendation
Do your own due diligence ,Market is subject to risks, This is my own view and for learning only .)
hdfc bank on side way formation hdfc bang today formed a negative pattern can go in consolidation for a while trendline support is good and needs to sustain above it for positive trend hold

HDFC Bank BuyHDFC Bank bounced back from its trend line. also break above a consolidating range. Buy @CMP (2015) with SL of 1960 and a target of 2500.

hdfc bank reportbullish pattern with candle pattern. every time support 1905 level, but no break to 1876
HDFC BANK - Will Go up?So my indian friends yet again has asked for this discretion, I feel the gap will be filled today or slow chop, the move is due to the ceasefire, since the last time i posted, it went very high

HDFCBANK - For my Indian Viewers!So an Indian Viewer has asked for this, so looking onto it, the heavyweight of sector NIFTY would see a move as stated!

HDFC Accumulation Breakdown Setup?HDFC seems to be building an accumulation range with:
Range High: ₹1955
Range Low: ₹1908
Currently, price is consolidating within this zone. I'm biased to the sell side for now, expecting a potential breakdown below the ₹1908 level.
⚠️ No confirmation yet — it's a “wait and watch” scenario. A strong close below the range low could trigger momentum selling.
💬 What's your view on this setup?

HDFC Bank ExitHDFC Bank 1933 is overbought. Support 1 @1893 and support 2 at 1818.
For investment it is trading at 20 PE and would be look good at 17.3 PE which would be 1600.

HDFC BANK ANALYSIS – 1H TIMEFRAMENSE:HDFCBANK
Symmetrical Triangle Pattern Forming
A breakout or breakdown is likely soon. Price is consolidating within the triangle range.
HDFC BANK ANALYSIS ON 1 HOUR TIME FRAME
IMPORTANT LEVELS TO WATCH:
Resistance: 1941 – 1958 – 1970
Support: 1913 – 1898 – 1885
📌 Chart Pattern: Price is forming a symmetrical triangle which indicates a potential breakout or breakdown.
A breakout above 1941.75 (purple line) can trigger a bullish move.
A breakdown below 1913.25 (purple line) can attract sellers.
📌 Wait for a breakout confirmation before entering a trade.
👉🏻 @thetradeforecast

Bullish on HDFC BANKHDFC BANK has been showing a Bullish price action off late.
The stock was consolidating since 23Apr-25 and if you notice the price action, there has been clear HL formation.
This has also led to a triangular pattern formation and now we have a breakout.
While I was short on HDFC, I have cut that position now with a loss and taken long.
EQ Target - 2200 level
OPT Target - 2025 level (June series)
P.S. Not a recommendation. Pls do your own due diligence.

HDFC BANK S/R for 19/5/25Support and Resistance Levels:
Support Levels: These are price points (green line/shade) where a downward trend may be halted due to a concentration of buying interest. Imagine them as a safety net where buyers step in, preventing further decline.
Resistance Levels: Conversely, resistance levels (red line/shade) are where upward trends might stall due to increased selling interest. They act like a ceiling where sellers come in to push prices down.
Breakouts:
Bullish Breakout: When the price moves above resistance, it often indicates strong buying interest and the potential for a continued uptrend. Traders may view this as a signal to buy or hold.
Bearish Breakout: When the price falls below support, it can signal strong selling interest and the potential for a continued downtrend. Traders might see this as a cue to sell or avoid buying.
MA Ribbon (EMA 20, EMA 50, EMA 100, EMA 200) :
Above EMA: If the stock price is above the EMA, it suggests a potential uptrend or bullish momentum.
Below EMA: If the stock price is below the EMA, it indicates a potential downtrend or bearish momentum.
Trendline: A trendline is a straight line drawn on a chart to represent the general direction of a data point set.
Uptrend Line: Drawn by connecting the lows in an upward trend. Indicates that the price is moving higher over time. Acts as a support level, where prices tend to bounce upward.
Downtrend Line: Drawn by connecting the highs in a downward trend. Indicates that the price is moving lower over time. It acts as a resistance level, where prices tend to drop.
Disclaimer:
I am not a SEBI registered. The information provided here is for learning purposes only and should not be interpreted as financial advice. Consider the broader market context and consult with a qualified financial advisor before making investment decisions.

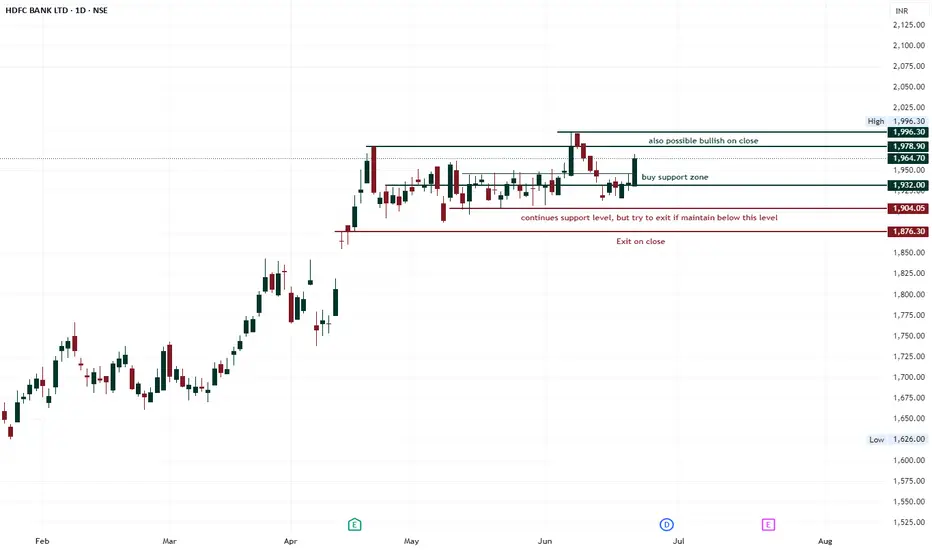
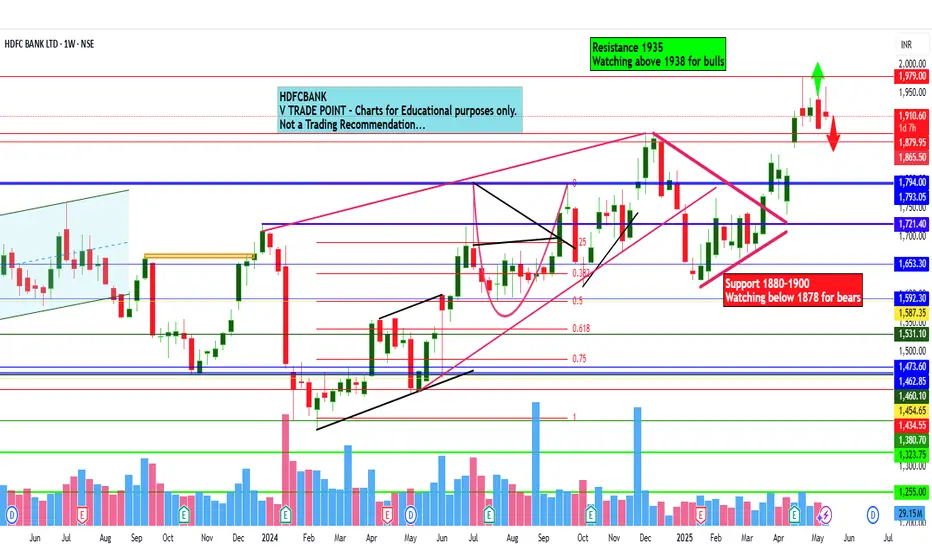
HDFC Bank Ltd view for Intraday 15th May #HDFCBANK HDFC Bank Ltd view for Intraday 15th May #HDFCBANK
Resistance 1935 Watching above 1938 for upside momentum.
Support area 1880-1900 Below 1900 ignoring upside momentum for intraday
Watching below 1878 for downside movement...
Above 1900 ignoring downside move for intraday
Charts for Educational purposes only.
Please follow strict stop loss and risk reward if you follow the level.
Thanks,
V Trade Point
HDFC Bank Ltd view for Intraday 2nd May #HDFCBANK HDFC Bank Ltd view for Intraday 2nd May #HDFCBANK
Resistance 1935 Watching above 1938 for upside movement...
Support area 1910 Below 1920 ignoring upside momentum for intraday
Watching below 1908 for downside movement...
Above 1920 ignoring downside move for intraday
Charts for Educational purposes only.
Please follow strict stop loss and risk reward if you follow the level.
Thanks,
V Trade Point

Shorted HDFC BANKBanking sector is now overbought. It is NIFTY that is now catching up with BN. God knows when that will happen.
For now, HDFC BANK looks like the first from the index that's showing weakness.
Clear rejection from the Highs.
LH formations noticed.
There's also a massive gap that needs to be filled which was created between 11th April close and 15th April open. I've shorted HDFC BANK.
TGT - 1840
SL - 1960
P.S. Not a recommendation. Pls do your own due diligence.

HDFC BANK 1M HDFC Bank appears to be forming a double bottom pattern, indicating the potential for a breakout above the ₹2,200 level in the future.
Disclaimer: The information provided is for educational and informational purposes only and should not be considered as financial advice. Investing in the stock market involves risk, and past performance is not indicative of future results. Please consult with a certified financial advisor or conduct your own research before making any investment decisions. We are not responsible for any losses incurred as a result of using this information. Stock market investments are subject to market risks; read all related documents carefully.

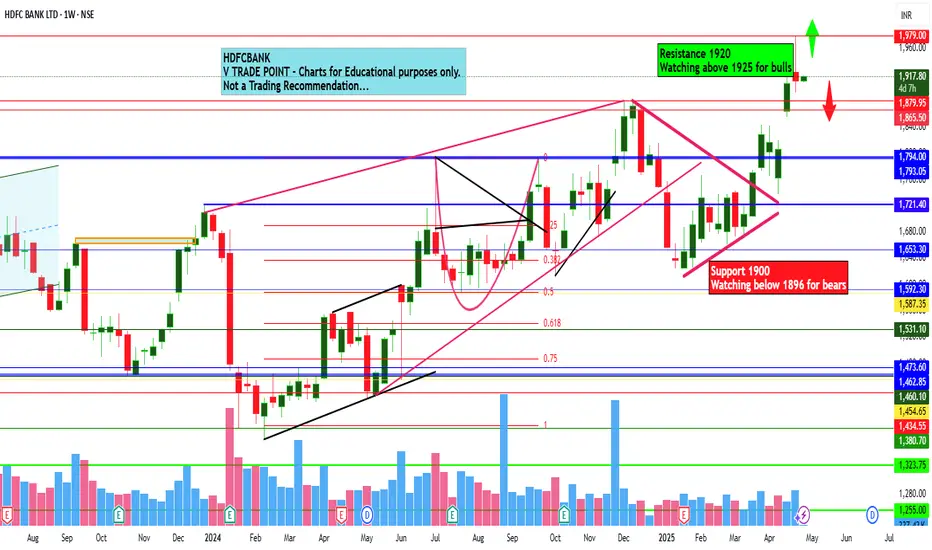
HDFC Bank Ltd view for Intraday 28th April #HDFCBANK HDFC Bank Ltd view for Intraday 28th April #HDFCBANK
Resistance 1920-1925 Watching above 1926 for upside movement...
Support area 1900 Below 1900 ignoring upside momentum for intraday
Watching below 1896 for downside movement...
Above 1920 ignoring downside move for intraday
Charts for Educational purposes only.
Please follow strict stop loss and risk reward if you follow the level.
Thanks,
V Trade Point
Hdfc bank up movement 2000Hdfc bank up movement 2000
HDFC Bank has been on an impressive upward trajectory, hitting a market capitalization of ₹15 trillion and becoming India’s third most valuable company. The stock has surged 12% in the last six days, reaching a record high of ₹1,970.6

HDFC Bank Ltd view for Intraday 22nd April #HDFCBANK HDFC Bank Ltd view for Intraday 22nd April #HDFCBANK
Resistance 1950 Watching above 1953 for upside movement...
Support area 1900 Below 1920 ignoring upside momentum for intraday
Watching below 1896 for downside movement...
Above 1920 ignoring downside move for intraday
Charts for Educational purposes only.
Please follow strict stop loss and risk reward if you follow the level.
Thanks,
V Trade Point

HDFC BANK S/R for 21/4/25Support and Resistance Levels:
Support Levels: These are price points (green line/shade) where a downward trend may be halted due to a concentration of buying interest. Imagine them as a safety net where buyers step in, preventing further decline.
Resistance Levels: Conversely, resistance levels (red line/shade) are where upward trends might stall due to increased selling interest. They act like a ceiling where sellers come in to push prices down.
Breakouts:
Bullish Breakout: When the price moves above resistance, it often indicates strong buying interest and the potential for a continued uptrend. Traders may view this as a signal to buy or hold.
Bearish Breakout: When the price falls below support, it can signal strong selling interest and the potential for a continued downtrend. Traders might see this as a cue to sell or avoid buying.
MA Ribbon (EMA 20, EMA 50, EMA 100, EMA 200) :
Above EMA: If the stock price is above the EMA, it suggests a potential uptrend or bullish momentum.
Below EMA: If the stock price is below the EMA, it indicates a potential downtrend or bearish momentum.
Trendline: A trendline is a straight line drawn on a chart to represent the general direction of a data point set.
Uptrend Line: Drawn by connecting the lows in an upward trend. Indicates that the price is moving higher over time. Acts as a support level, where prices tend to bounce upward.
Downtrend Line: Drawn by connecting the highs in a downward trend. Indicates that the price is moving lower over time. It acts as a resistance level, where prices tend to drop.
Disclaimer:
I am not a SEBI registered. The information provided here is for learning purposes only and should not be interpreted as financial advice. Consider the broader market context and consult with a qualified financial advisor before making investment decisions.

HDFC BANK: Consolidation Breakout of 48 months - is wait over?With Nifty reaching to 26k without the participation of HDFC bank made many investors un-comfortable.
However now, Looks like the wait is about to over as Monthly Consolidation for almost 48 Months - 4 years is visibly broken but yet to give confirmation on candle close.
If the April 2025 candle closes above consolidate area then it will further increase the possibility of 30% up move.
DISC: Only for education purposes. Please consult your financial advisor before making any decision.
