PG (Procter & Gamble): A Textbook Rebound Setup📈 PG (Procter & Gamble): A Textbook Rebound Setup
Summary :
Procter & Gamble just bounced right at a key support zone. The setup offers a low-risk entry with a tight stop and solid upside potential.
Idea :
This is one of those charts that look like they came straight out of a technical analysis
Next report date
—
Report period
—
EPS estimate
—
Revenue estimate
—
125.17 MXN
299.64 B MXN
1.58 T MXN
2.34 B
About Procter & Gamble Company (The)
Sector
Industry
CEO
Jon R. Moeller
Website
Headquarters
Cincinnati
Founded
1837
FIGI
BBG000HW5GC6
The Procter & Gamble Company is focused on providing branded consumer packaged goods to the consumers across the world. The Company operates through five segments: Beauty; Grooming; Health Care; Fabric & Home Care, and Baby, Feminine & Family Care. The Company sells its products in approximately 180 countries and territories primarily through mass merchandisers, grocery stores, membership club stores, drug stores, department stores, distributors, baby stores, specialty beauty stores, e-commerce, high-frequency stores and pharmacies. It offers products under the brands, such as Olay, Old Spice, Safeguard, Head & Shoulders, Pantene, Rejoice, Mach3, Prestobarba, Venus, Cascade, Dawn, Febreze, Mr. Clean, Bounty and Charmin.
Related stocks

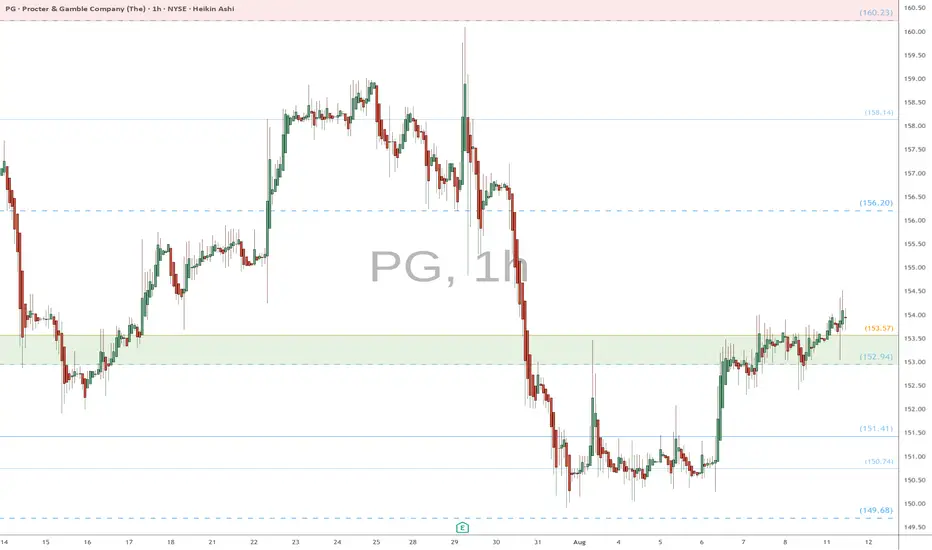
PG watch $152.94-153.57: well proven support Zone needs to hold PG trying to paint a local bottom after earnings dump.
Seems ready to break out of a fib zone at $152.94-153.57
Entering small long now, will add upon retest break higher.
PG Bullish Swing Setup | Breakout Brewing Above $161!🚀 PG Swing Setup: Bullish Breakout Loading? 🔥 (2025-08-21)
📊 Multi-Model Consensus Summary
📈 Momentum: Mixed — RSI fading, but 5-day & 10-day trends show bullish push
💵 Volume: Weak (1.0x avg) → no strong institutional conviction yet
⚖️ Options Flow: Neutral (C/P = 1.0)
🌪 Volatility: VIX 16.60

PG Approaching Oversold Discount Zone Ahead of Q4 Earnings BTFD?📝 Procter & Gamble (NYSE: PG) is trading at $153.73 (-10.8% YTD), lagging the S&P 500’s +6.5% YTD gain. Despite recent weakness, a confluence of technical support, dividend resilience, and a looming catalyst could signal a tactical entry. Let’s break it down:
🔍 Fundamentals & Catalysts
Q4 Earnings

$PG - Charting is Therapeutic NYSE:PG forming solid base at $159 support after 15% pullback from Feb highs.
Strong fundamentals intact with 19% profit margins in Q3. Recent analyst actions positive RBC upgraded to BUY in April, Evercore just raised PT to $190 (19% upside).
Defensive consumer staple with reliable dividend (65

Bullish $PGNYSE:PG forming solid base at $159 support after 15% pullback from Feb highs. Strong fundamentals intact with 19% profit margins in Q3. Recent analyst actions positive - RBC upgraded to BUY in April, Evercore just raised PT to $190 (19% upside). Defensive consumer staple with reliable dividend (65%

Can P&G Weather the Economic Storm?Procter & Gamble, a global leader in consumer goods, currently faces significant economic turbulence, exemplified by recent job cuts and a decline in its stock value. The primary catalyst for these challenges stems from the Trump administration's tariff policies, which have directly impacted P&G's s

Procter&Gamble: Short-Term Strength Still Fits the PlanPG has extended its rally, pushing turquoise wave C higher. While some selling pressure is starting to show, we’re sticking with our primary view: the stock should still break above $180.43 to complete beige wave b before turning lower. However, in our 37% likely alternative scenario, beige wave al

PG eyes on $165-166: proven Major Resistance to Pump or DumpPG trying to recover from the tariff bottom.
Currently testing a major Resistance zone.
Look for Dip to Green zone or Break-n-Retest.

Go DefensiveUncertain and relatively bearish market at the moment, I expect "boring" defensive stocks such as PG to be the safety play for most investors.
I think this will bounce to $180.
Not financial advice, good luck to all :)

See all ideas
Summarizing what the indicators are suggesting.
Neutral
SellBuy
Strong sellStrong buy
Strong sellSellNeutralBuyStrong buy
Neutral
SellBuy
Strong sellStrong buy
Strong sellSellNeutralBuyStrong buy
Neutral
SellBuy
Strong sellStrong buy
Strong sellSellNeutralBuyStrong buy
An aggregate view of professional's ratings.
Neutral
SellBuy
Strong sellStrong buy
Strong sellSellNeutralBuyStrong buy
Neutral
SellBuy
Strong sellStrong buy
Strong sellSellNeutralBuyStrong buy
Neutral
SellBuy
Strong sellStrong buy
Strong sellSellNeutralBuyStrong buy
Displays a symbol's price movements over previous years to identify recurring trends.
A3LX0K
PROCTER & GAMBLE CO 2024-29.04.28Yield to maturity
—
Maturity date
Apr 29, 2028
PG4969928
Procter & Gamble Company 3.6% 25-MAR-2050Yield to maturity
—
Maturity date
Mar 25, 2050
PG5351505
Procter & Gamble Company 1.9% 01-FEB-2027Yield to maturity
—
Maturity date
Feb 1, 2027
PG4040131
Procter & Gamble Company FRN 15-AUG-2063Yield to maturity
—
Maturity date
Aug 15, 2063
PG.HH
Procter & Gamble Company FRN 09-NOV-2057Yield to maturity
—
Maturity date
Nov 9, 2057
PG.GW
Procter & Gamble Company 5.5% 01-FEB-2034Yield to maturity
—
Maturity date
Feb 1, 2034
PG4969926
Procter & Gamble Company 3.0% 25-MAR-2030Yield to maturity
—
Maturity date
Mar 25, 2030
PG5740492
Procter & Gamble Company 4.55% 29-JAN-2034Yield to maturity
—
Maturity date
Jan 29, 2034
PG4969925
Procter & Gamble Company 2.8% 25-MAR-2027Yield to maturity
—
Maturity date
Mar 25, 2027
PG5740493
Procter & Gamble Company 4.35% 29-JAN-2029Yield to maturity
—
Maturity date
Jan 29, 2029
PG6065520
Procter & Gamble Company 4.05% 01-MAY-2030Yield to maturity
—
Maturity date
May 1, 2030
See all PG bonds
Curated watchlists where PG is featured.


Frequently Asked Questions
The current price of PG is 2,950.62 MXN — it has decreased by −0.99% in the past 24 hours. Watch PROCTER & GAMBLE CO stock price performance more closely on the chart.
Depending on the exchange, the stock ticker may vary. For instance, on BMV exchange PROCTER & GAMBLE CO stocks are traded under the ticker PG.
PG stock has risen by 1.85% compared to the previous week, the month change is a 0.36% rise, over the last year PROCTER & GAMBLE CO has showed a −10.59% decrease.
We've gathered analysts' opinions on PROCTER & GAMBLE CO future price: according to them, PG price has a max estimate of 3,496.24 MXN and a min estimate of 2,857.14 MXN. Watch PG chart and read a more detailed PROCTER & GAMBLE CO stock forecast: see what analysts think of PROCTER & GAMBLE CO and suggest that you do with its stocks.
PG stock is 1.09% volatile and has beta coefficient of 0.18. Track PROCTER & GAMBLE CO stock price on the chart and check out the list of the most volatile stocks — is PROCTER & GAMBLE CO there?
Today PROCTER & GAMBLE CO has the market capitalization of 6.97 T, it has increased by 1.28% over the last week.
Yes, you can track PROCTER & GAMBLE CO financials in yearly and quarterly reports right on TradingView.
PROCTER & GAMBLE CO is going to release the next earnings report on Oct 15, 2025. Keep track of upcoming events with our Earnings Calendar.
PG earnings for the last quarter are 27.76 MXN per share, whereas the estimation was 26.66 MXN resulting in a 4.11% surprise. The estimated earnings for the next quarter are 35.92 MXN per share. See more details about PROCTER & GAMBLE CO earnings.
PROCTER & GAMBLE CO revenue for the last quarter amounts to 391.84 B MXN, despite the estimated figure of 390.93 B MXN. In the next quarter, revenue is expected to reach 417.64 B MXN.
PG net income for the last quarter is 67.81 B MXN, while the quarter before that showed 77.24 B MXN of net income which accounts for −12.20% change. Track more PROCTER & GAMBLE CO financial stats to get the full picture.
Yes, PG dividends are paid quarterly. The last dividend per share was 19.82 MXN. As of today, Dividend Yield (TTM)% is 2.60%. Tracking PROCTER & GAMBLE CO dividends might help you take more informed decisions.
PROCTER & GAMBLE CO dividend yield was 2.56% in 2025, and payout ratio reached 62.63%. The year before the numbers were 2.32% and 63.61% correspondingly. See high-dividend stocks and find more opportunities for your portfolio.
As of Aug 24, 2025, the company has 109 K employees. See our rating of the largest employees — is PROCTER & GAMBLE CO on this list?
EBITDA measures a company's operating performance, its growth signifies an improvement in the efficiency of a company. PROCTER & GAMBLE CO EBITDA is 435.28 B MXN, and current EBITDA margin is 27.94%. See more stats in PROCTER & GAMBLE CO financial statements.
Like other stocks, PG shares are traded on stock exchanges, e.g. Nasdaq, Nyse, Euronext, and the easiest way to buy them is through an online stock broker. To do this, you need to open an account and follow a broker's procedures, then start trading. You can trade PROCTER & GAMBLE CO stock right from TradingView charts — choose your broker and connect to your account.
Investing in stocks requires a comprehensive research: you should carefully study all the available data, e.g. company's financials, related news, and its technical analysis. So PROCTER & GAMBLE CO technincal analysis shows the neutral today, and its 1 week rating is sell. Since market conditions are prone to changes, it's worth looking a bit further into the future — according to the 1 month rating PROCTER & GAMBLE CO stock shows the neutral signal. See more of PROCTER & GAMBLE CO technicals for a more comprehensive analysis.
If you're still not sure, try looking for inspiration in our curated watchlists.
If you're still not sure, try looking for inspiration in our curated watchlists.