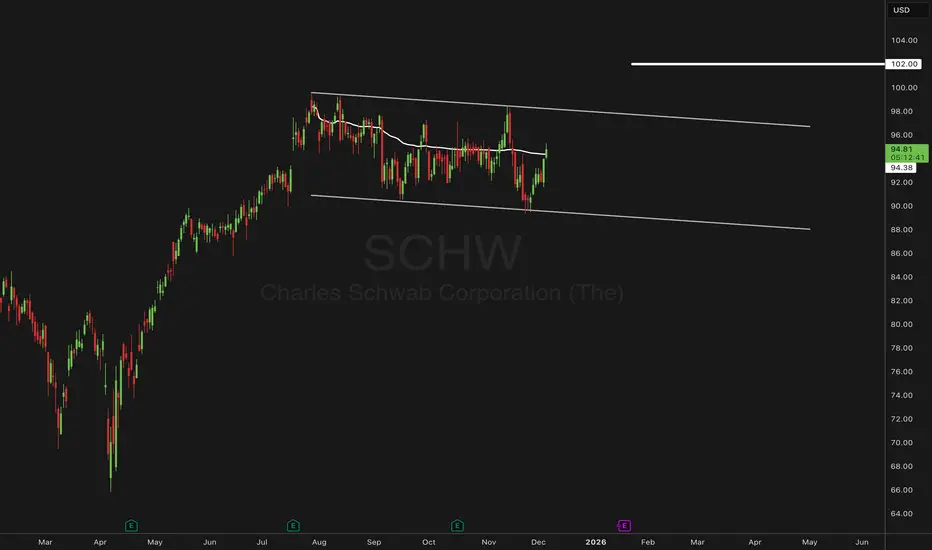
SCHW | Bull-Flag Structure & AVWAP Break with a 102 TargetSCHW has been trading inside a broad bull-flag channel since late summer. This week’s price action broke above the anchored VWAP, a level that has repeatedly acted as a mean-reversion barrier during this consolidation. The breakout shifts focus toward the upper boundary of the flag and the next area
Charles Schwab Corp
No trades
Key facts today
Next report date
—
Report period
—
EPS estimate
—
Revenue estimate
—
78.37 MXN
123.89 B MXN
542.06 B MXN
1.68 B
About Charles Schwab Corporation (The)
Sector
Industry
CEO
Richard A. Wurster
Website
Headquarters
Westlake
Founded
1986
ISIN
US8085131055
FIGI
BBG007KJPQB3
The Charles Schwab Corp. is a savings and loan holding company, which engages in the provision of wealth management, securities brokerage, banking, asset management, custody, and financial advisory services. It operates through the Investor Services and Advisor Services segments. The Investor Services segment includes retail brokerage, investment advisory, and banking and trust services to individual investors, retirement plan and business services, as well as other corporate brokerage services, to businesses and employees. The Advisor Services segment provides custodial, trading, banking and trust, and support services to independent registered investment advisors, independent retirement advisors, and recordkeepers. The company was founded by Charles Robert Schwab in 1986 and is headquartered in Westlake, TX.
Related stocks
SCHW watch $95.31-95.72: Key Resistance zone holding up new ATHSSCHW is testing a key resistance zone at $95.31-95.72
Looking for a Break-n-Retest to start the next leg up.
Next move should go into new All Time HIgh prices.
.
Previous Analsys that caught a PREFECT Dip-Buy
Hit BOOST and FOLLOW for more such PRECISE and TIMELY charts.
========================

I Found Where $73M in Volume Got Stuck### Market Structure & Footprint Discovery
Charles Schwab presents a compelling institutional accumulation setup with an extraordinarily rare footprint pattern. Six consecutive trading sessions have established their Point of Control (highest volume node) between $92.11-$92.41, creating what foot

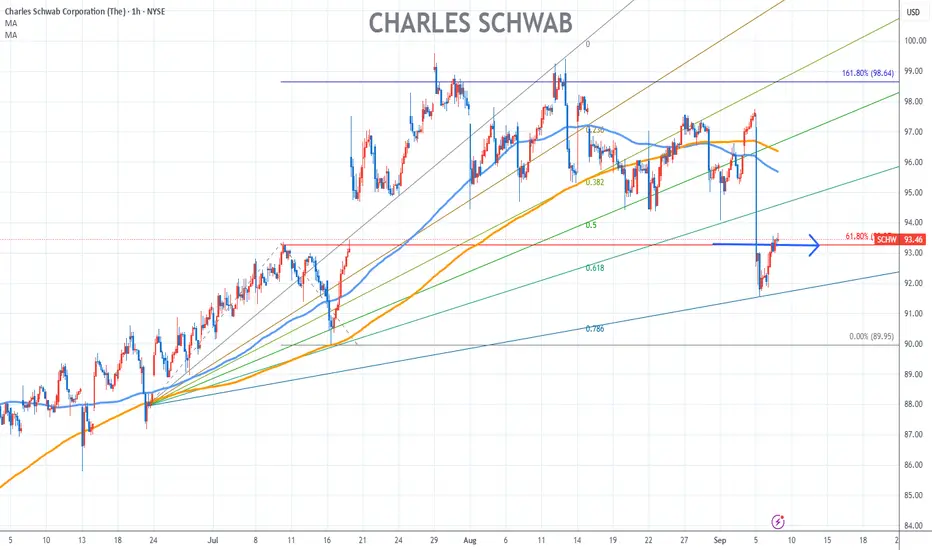
Charles Schwab Stock Chart Fibonacci Analysis 090825Trading Idea
1) Find a FIBO slingshot
2) Check FIBO 61.80% level
3) Entry Point > 93.5/61.80%
Chart time frame:C
A) 15 min(1W-3M)
B) 1 hr(3M-6M)
C) 4 hr(6M-1year)
D) 1 day(1-3years)
Stock progress:A
A) Keep rising over 61.80% resistance
B) 61.80% resistance
C) 61.80% support
D) Hit the bottom
E
$SCHW - Trade Idea for 8/15DAILY - 3-1 SETUP
WEEKLY - 3-1-2U REV
MONTH - INSIDE CANDLE
QUARTER 3-2U
This is something you could scale into as well depending on the risk you are willing to take.

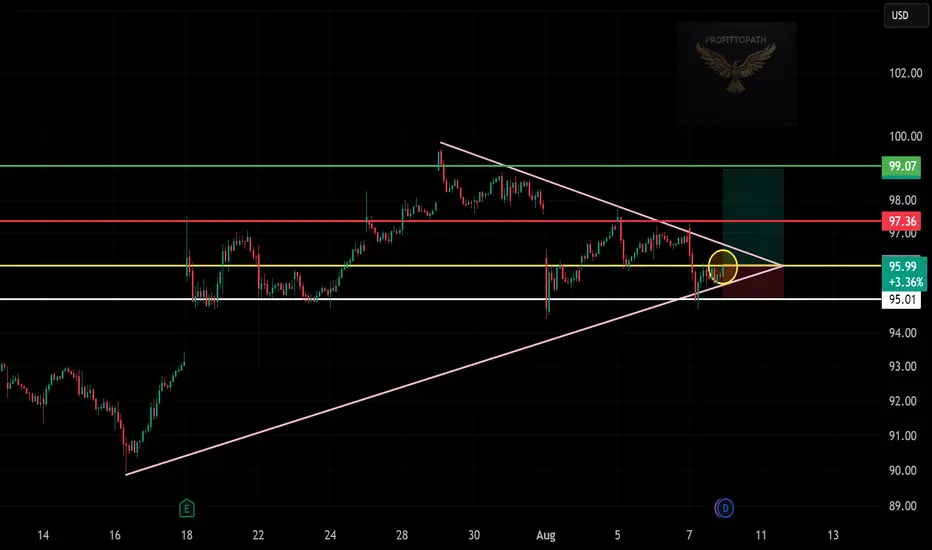
SCHW Long Setup!📈
Price forming bullish breakout from wedge 📊
📍 Entry: ~$95.99
🎯 Target: $99.07
🛑 SL: $95.01
Watching for volume to confirm upside move 🚀
Charls Schwab Long TradeSeems good here, goal is to go for ATH otherwise risk to reward is not worth.
Looks promising but pullback to VAH is possible
SCHW heads up into $83: major resistance that could mark a TOP?SCHW has been rising with the financials tide after Trump win.
Now testing a major resistance of Golden Genesis + Covid fib.
Looking for a pullback or Break-and-Retest for the next move.
$ 82.54 - 83.55 is the exact zone of interest.
$ 75.74 - 76.03 below is the first strong support.
$ 95.42 - 95.7

Charles Schwab ($SCHW) Upgraded by Morgan Stanley to Overweight Morgan Stanley has taken new rating actions on financial exchanges and brokers as markets face heightened uncertainty. The investment bank highlighted concerns over economic growth, sticky inflation, and interest rate paths. Recession fears and tariff-induced volatility have also rattled investor co

SCHW $86 Next? Or Double top flush? SCHW to $86 by March 18th? Or flush under $79? Looks like it is bouncing on key levels looking left. Volume is lower than its 30D AVG. $81.80 is the level i will be watching to reject or push through. GL!

See all ideas
Summarizing what the indicators are suggesting.
Neutral
SellBuy
Strong sellStrong buy
Strong sellSellNeutralBuyStrong buy
Neutral
SellBuy
Strong sellStrong buy
Strong sellSellNeutralBuyStrong buy
Neutral
SellBuy
Strong sellStrong buy
Strong sellSellNeutralBuyStrong buy
An aggregate view of professional's ratings.
Neutral
SellBuy
Strong sellStrong buy
Strong sellSellNeutralBuyStrong buy
Neutral
SellBuy
Strong sellStrong buy
Strong sellSellNeutralBuyStrong buy
Neutral
SellBuy
Strong sellStrong buy
Strong sellSellNeutralBuyStrong buy
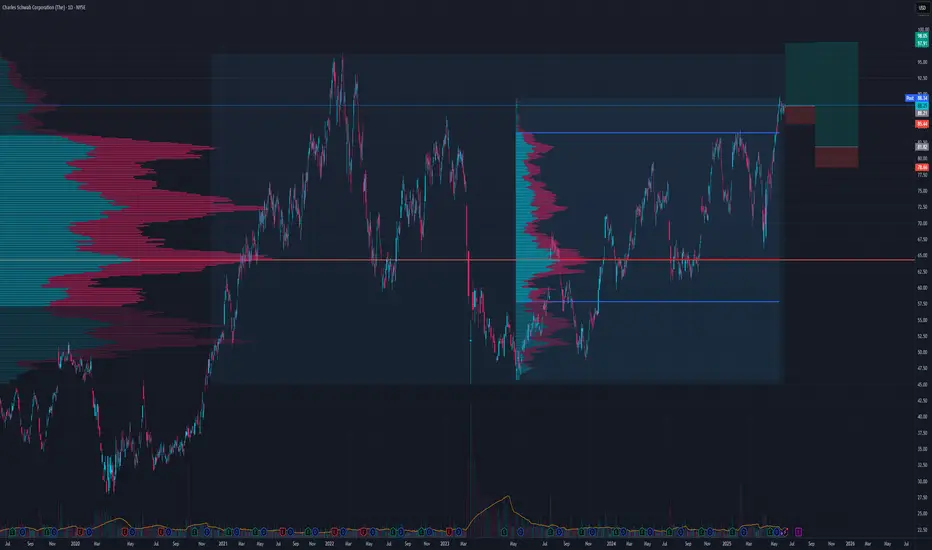
Displays a symbol's price movements over previous years to identify recurring trends.
T
SCHW4487839
TD Ameritrade Holding Corporation 3.3% 01-APR-2027Yield to maturity
4.78%
Maturity date
Apr 1, 2027
SCHW5372110
Charles Schwab Corporation 2.9% 03-MAR-2032Yield to maturity
4.49%
Maturity date
Mar 3, 2032
SCHW4310070
Charles Schwab Corporation 3.45% 13-FEB-2026Yield to maturity
4.49%
Maturity date
Feb 13, 2026
T
SCHW4871985
TD Ameritrade Holding Corporation 2.75% 01-OCT-2029Yield to maturity
4.42%
Maturity date
Oct 1, 2029
SCHW5245904
Charles Schwab Corporation 1.95% 01-DEC-2031Yield to maturity
4.38%
Maturity date
Dec 1, 2031
SCHW5183443
Charles Schwab Corporation 2.3% 13-MAY-2031Yield to maturity
4.25%
Maturity date
May 13, 2031
SCHW5639824
Charles Schwab Corporation 5.875% 24-AUG-2026Yield to maturity
4.22%
Maturity date
Aug 24, 2026
SCHW5093526
Charles Schwab Corporation 0.9% 11-MAR-2026Yield to maturity
4.20%
Maturity date
Mar 11, 2026
SCHW4836967
Charles Schwab Corporation 3.25% 22-MAY-2029Yield to maturity
4.18%
Maturity date
May 22, 2029
SCHW5093527
Charles Schwab Corporation 1.65% 11-MAR-2031Yield to maturity
4.11%
Maturity date
Mar 11, 2031
SCHW5183442
Charles Schwab Corporation 1.15% 13-MAY-2026Yield to maturity
4.06%
Maturity date
May 13, 2026
See all SCHW bonds
Curated watchlists where SCHW is featured.


Frequently Asked Questions
The current price of SCHW is 1,735.00 MXN — it hasn't changed in the past 24 hours. Watch Charles Schwab Corp stock price performance more closely on the chart.
Depending on the exchange, the stock ticker may vary. For instance, on BMV exchange Charles Schwab Corp stocks are traded under the ticker SCHW.
SCHW stock has risen by 4.13% compared to the previous week, the month change is a −0.29% fall, over the last year Charles Schwab Corp has showed a 4.58% increase.
We've gathered analysts' opinions on Charles Schwab Corp future price: according to them, SCHW price has a max estimate of 2,531.42 MXN and a min estimate of 1,639.05 MXN. Watch SCHW chart and read a more detailed Charles Schwab Corp stock forecast: see what analysts think of Charles Schwab Corp and suggest that you do with its stocks.
SCHW reached its all-time high on Jan 14, 2022 with the price of 1,960.75 MXN, and its all-time low was 385.69 MXN and was reached on Nov 21, 2014. View more price dynamics on SCHW chart.
See other stocks reaching their highest and lowest prices.
See other stocks reaching their highest and lowest prices.
SCHW stock is 0.00% volatile and has beta coefficient of 1.10. Track Charles Schwab Corp stock price on the chart and check out the list of the most volatile stocks — is Charles Schwab Corp there?
Today Charles Schwab Corp has the market capitalization of 3.05 T, it has increased by 2.34% over the last week.
Yes, you can track Charles Schwab Corp financials in yearly and quarterly reports right on TradingView.
Charles Schwab Corp is going to release the next earnings report on Jan 20, 2026. Keep track of upcoming events with our Earnings Calendar.
SCHW earnings for the last quarter are 24.01 MXN per share, whereas the estimation was 22.86 MXN resulting in a 5.05% surprise. The estimated earnings for the next quarter are 24.36 MXN per share. See more details about Charles Schwab Corp earnings.
Charles Schwab Corp revenue for the last quarter amounts to 112.47 B MXN, despite the estimated figure of 110.20 B MXN. In the next quarter, revenue is expected to reach 112.72 B MXN.
SCHW net income for the last quarter is 43.23 B MXN, while the quarter before that showed 39.88 B MXN of net income which accounts for 8.39% change. Track more Charles Schwab Corp financial stats to get the full picture.
Yes, SCHW dividends are paid quarterly. The last dividend per share was 4.95 MXN. As of today, Dividend Yield (TTM)% is 1.15%. Tracking Charles Schwab Corp dividends might help you take more informed decisions.
Charles Schwab Corp dividend yield was 1.35% in 2024, and payout ratio reached 33.48%. The year before the numbers were 1.45% and 39.39% correspondingly. See high-dividend stocks and find more opportunities for your portfolio.
As of Dec 11, 2025, the company has 32.1 K employees. See our rating of the largest employees — is Charles Schwab Corp on this list?
EBITDA measures a company's operating performance, its growth signifies an improvement in the efficiency of a company. Charles Schwab Corp EBITDA is 252.15 B MXN, and current EBITDA margin is 45.09%. See more stats in Charles Schwab Corp financial statements.
Like other stocks, SCHW shares are traded on stock exchanges, e.g. Nasdaq, Nyse, Euronext, and the easiest way to buy them is through an online stock broker. To do this, you need to open an account and follow a broker's procedures, then start trading. You can trade Charles Schwab Corp stock right from TradingView charts — choose your broker and connect to your account.
Investing in stocks requires a comprehensive research: you should carefully study all the available data, e.g. company's financials, related news, and its technical analysis. So Charles Schwab Corp technincal analysis shows the buy rating today, and its 1 week rating is buy. Since market conditions are prone to changes, it's worth looking a bit further into the future — according to the 1 month rating Charles Schwab Corp stock shows the strong buy signal. See more of Charles Schwab Corp technicals for a more comprehensive analysis.
If you're still not sure, try looking for inspiration in our curated watchlists.
If you're still not sure, try looking for inspiration in our curated watchlists.