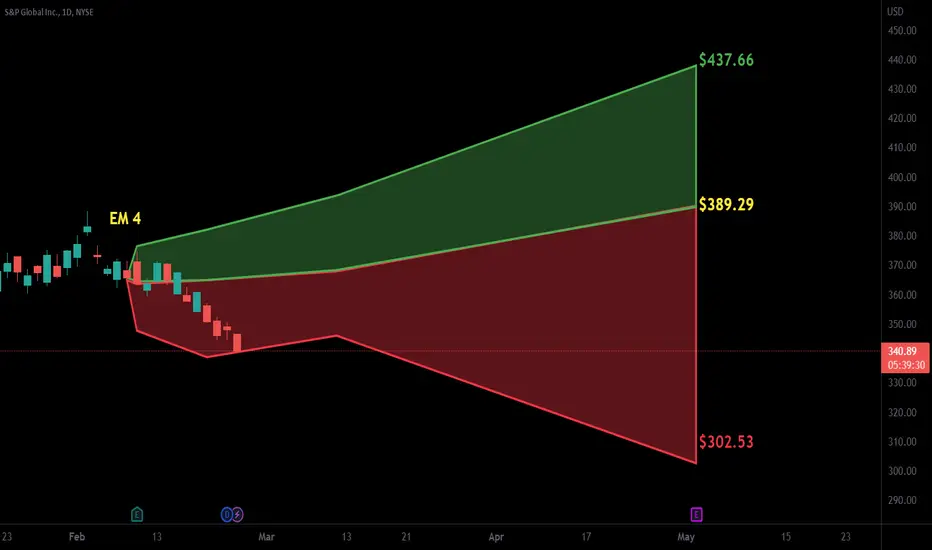
S&P Global Inc. short position Hi traders,
The price is approaching the previous all time high and we believe that it´s area where we can expect the profit taking therefore it can be the entry for a short position.
If we get rejection at the previous all time high, the pullback will be likely before any further uptrend continua
Next report date
—
Report period
—
EPS estimate
—
Revenue estimate
—
252.40 MXN
80.31 B MXN
296.23 B MXN
302.35 M
About S&P Global Inc.
Sector
Industry
CEO
PikLing Martina Cheung
Website
Headquarters
New York
Founded
1917
ISIN
US78409V1044
FIGI
BBG000L9NY51
S&P Global, Inc. engages in the provision of transparent and independent ratings, benchmarks, analytics, and data to the capital and commodity markets worldwide. It operates through the following segments: Market Intelligence, Ratings, Commodity Insights, Mobility, Indices, and Engineering Solutions. The Market Intelligence segment provides multi-asset-class data and analytics integrated with purpose-built workflow solutions. The Ratings segment is involved in credit ratings, research, and analytics, offering investors and other market participants information, ratings, and benchmarks. The Commodity Insights segment focuses on information and benchmark prices for the commodity and energy markets. The Mobility segment offers solutions serving the full automotive value chain including vehicle manufacturers, automotive suppliers, mobility service providers, retailers, consumers, and finance and insurance companies. The Engineering Solutions segment engages in advanced knowledge discovery technologies, research tools, and software-based engineering decision engines to advance innovation, maximize productivity, improve quality, and reduce risk. The company was founded by James H. McGraw and John A. Hill in 1917 and is headquartered in New York, NY.


SPGI - WeeklySPGI- currently down 28% from the ATH, and still in its downtrend.
Has reached and held support at 327. Might see another touch of 327 before attempt to change the trend by gaining yellow (360.55)
Targets in orange if 360.55 is gained as support.
If support is lost then targeting below in cyan.


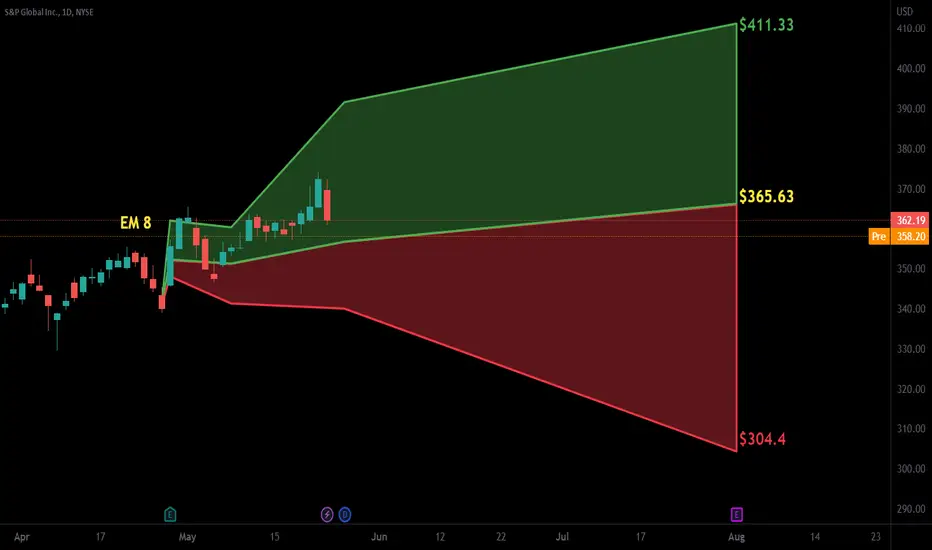

SPGI. LONG IDEA.2ND stock trading idea!!
Open = 360.00
Target/TP = 390.00
SL= 350.00
Opening level = 360.00 Marks the Beginning for a possible bullish trend (primary/starting level)
Closing level = 390.00 A key level in the overall trend.
(THIS IDEA IS MAINLY BASED ON TECHNICALS)
(this is a personal idea based

See all ideas
Summarizing what the indicators are suggesting.
Neutral
SellBuy
Strong sellStrong buy
Strong sellSellNeutralBuyStrong buy
Neutral
SellBuy
Strong sellStrong buy
Strong sellSellNeutralBuyStrong buy
Neutral
SellBuy
Strong sellStrong buy
Strong sellSellNeutralBuyStrong buy
An aggregate view of professional's ratings.
Neutral
SellBuy
Strong sellStrong buy
Strong sellSellNeutralBuyStrong buy
Neutral
SellBuy
Strong sellStrong buy
Strong sellSellNeutralBuyStrong buy
Neutral
SellBuy
Strong sellStrong buy
Strong sellSellNeutralBuyStrong buy
Displays a symbol's price movements over previous years to identify recurring trends.
SPGI5374660
S&P Global Inc. 2.9% 01-MAR-2032Yield to maturity
6.99%
Maturity date
Mar 1, 2032
SPGI5552181
S&P Global Inc. 3.9% 01-MAR-2062Yield to maturity
5.47%
Maturity date
Mar 1, 2062
SPGI5552944
S&P Global Inc. 3.7% 01-MAR-2052Yield to maturity
5.43%
Maturity date
Mar 1, 2052
SPGI4629902
S&P Global Inc. 4.5% 15-MAY-2048Yield to maturity
5.40%
Maturity date
May 15, 2048
SPGI5374669
S&P Global Inc. 4.75% 01-AUG-2028Yield to maturity
5.39%
Maturity date
Aug 1, 2028
SPGI5028482
S&P Global Inc. 2.3% 15-AUG-2060Yield to maturity
5.33%
Maturity date
Aug 15, 2060
SPGI4914621
S&P Global Inc. 3.25% 01-DEC-2049Yield to maturity
5.31%
Maturity date
Dec 1, 2049
SPGI4378998
S&P Global Inc. 6.55% 15-NOV-2037Yield to maturity
5.28%
Maturity date
Nov 15, 2037
See all SPGI bonds
VOO
Vanguard S&P 500 ETFWeight
0.27%
Market value
3.75 B
USD
SPY
SPDR S&P 500 ETFWeight
0.26%
Market value
1.81 B
USD
VUG
Vanguard Growth ETFWeight
0.49%
Market value
1.67 B
USD
VIG
Vanguard Dividend Appreciation ETFWeight
0.71%
Market value
824.94 M
USD
CSPX
iShares Core S&P 500 UCITS ETFWeight
0.26%
Market value
363.49 M
USD
GSPX
iShares Core S&P 500 UCITS ETFWeight
0.26%
Market value
363.49 M
USD
0A3D
iShares Core S&P 500 UCITS ETFWeight
0.26%
Market value
363.49 M
USD
Explore more ETFs
Frequently Asked Questions
The current price of SPGI is 9,136.00 MXN — it has increased by 4.76% in the past 24 hours. Watch S&P Global, Inc. stock price performance more closely on the chart.
Depending on the exchange, the stock ticker may vary. For instance, on BMV exchange S&P Global, Inc. stocks are traded under the ticker SPGI.
SPGI stock has risen by 1.74% compared to the previous week, the month change is a 1.76% rise, over the last year S&P Global, Inc. has showed a −6.77% decrease.
We've gathered analysts' opinions on S&P Global, Inc. future price: according to them, SPGI price has a max estimate of 12,548.80 MXN and a min estimate of 10,001.86 MXN. Watch SPGI chart and read a more detailed S&P Global, Inc. stock forecast: see what analysts think of S&P Global, Inc. and suggest that you do with its stocks.
SPGI reached its all-time high on Feb 19, 2025 with the price of 11,268.00 MXN, and its all-time low was 2,574.00 MXN and was reached on Feb 9, 2017. View more price dynamics on SPGI chart.
See other stocks reaching their highest and lowest prices.
See other stocks reaching their highest and lowest prices.
SPGI stock is 5.24% volatile and has beta coefficient of 0.86. Track S&P Global, Inc. stock price on the chart and check out the list of the most volatile stocks — is S&P Global, Inc. there?
Today S&P Global, Inc. has the market capitalization of 2.74 T, it has increased by 0.02% over the last week.
Yes, you can track S&P Global, Inc. financials in yearly and quarterly reports right on TradingView.
S&P Global, Inc. is going to release the next earnings report on Feb 5, 2026. Keep track of upcoming events with our Earnings Calendar.
SPGI earnings for the last quarter are 86.71 MXN per share, whereas the estimation was 80.94 MXN resulting in a 7.13% surprise. The estimated earnings for the next quarter are 78.96 MXN per share. See more details about S&P Global, Inc. earnings.
S&P Global, Inc. revenue for the last quarter amounts to 71.27 B MXN, despite the estimated figure of 70.21 B MXN. In the next quarter, revenue is expected to reach 71.86 B MXN.
SPGI net income for the last quarter is 21.56 B MXN, while the quarter before that showed 20.11 B MXN of net income which accounts for 7.21% change. Track more S&P Global, Inc. financial stats to get the full picture.
Yes, SPGI dividends are paid quarterly. The last dividend per share was 17.93 MXN. As of today, Dividend Yield (TTM)% is 0.78%. Tracking S&P Global, Inc. dividends might help you take more informed decisions.
S&P Global, Inc. dividend yield was 0.73% in 2024, and payout ratio reached 29.47%. The year before the numbers were 0.82% and 43.72% correspondingly. See high-dividend stocks and find more opportunities for your portfolio.
As of Nov 3, 2025, the company has 42.35 K employees. See our rating of the largest employees — is S&P Global, Inc. on this list?
EBITDA measures a company's operating performance, its growth signifies an improvement in the efficiency of a company. S&P Global, Inc. EBITDA is 137.91 B MXN, and current EBITDA margin is 48.65%. See more stats in S&P Global, Inc. financial statements.
Like other stocks, SPGI shares are traded on stock exchanges, e.g. Nasdaq, Nyse, Euronext, and the easiest way to buy them is through an online stock broker. To do this, you need to open an account and follow a broker's procedures, then start trading. You can trade S&P Global, Inc. stock right from TradingView charts — choose your broker and connect to your account.
Investing in stocks requires a comprehensive research: you should carefully study all the available data, e.g. company's financials, related news, and its technical analysis. So S&P Global, Inc. technincal analysis shows the neutral today, and its 1 week rating is sell. Since market conditions are prone to changes, it's worth looking a bit further into the future — according to the 1 month rating S&P Global, Inc. stock shows the buy signal. See more of S&P Global, Inc. technicals for a more comprehensive analysis.
If you're still not sure, try looking for inspiration in our curated watchlists.
If you're still not sure, try looking for inspiration in our curated watchlists.