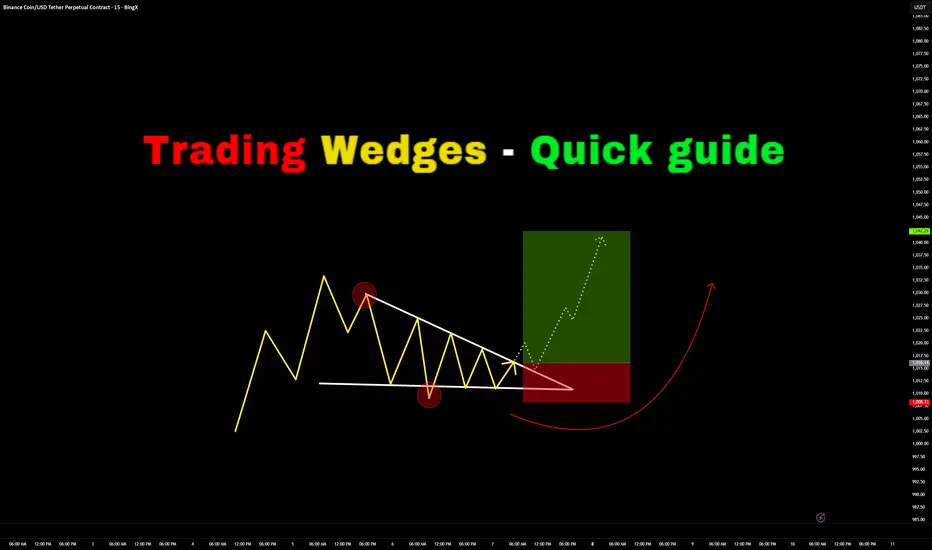
Trading Wedges - Quick Guide in 5 StepsWelcome back everyone to another guide, today we will speed run "Trading wedges" in a quick 5 step guide. Be sure to like, follow and join the community!
1) Identify the wedges:
- Falling Wedge
- Rising Wedge
- Symmetrical Wedge (Triangle)
2) Identify Breakout Direction:
- Falling Wedge > Bulli
Lingrid | BNBUSDT Bearish Opportunity After Resistance RejectionBINANCE:BNBUSDT is once again reacting to the descending channel border, where prior rallies have consistently faded, reinforcing the broader bearish rhythm. Price briefly pushed into the 900 zone but showed rejection, suggesting the move may be corrective rather than a shift in sentiment. The stru

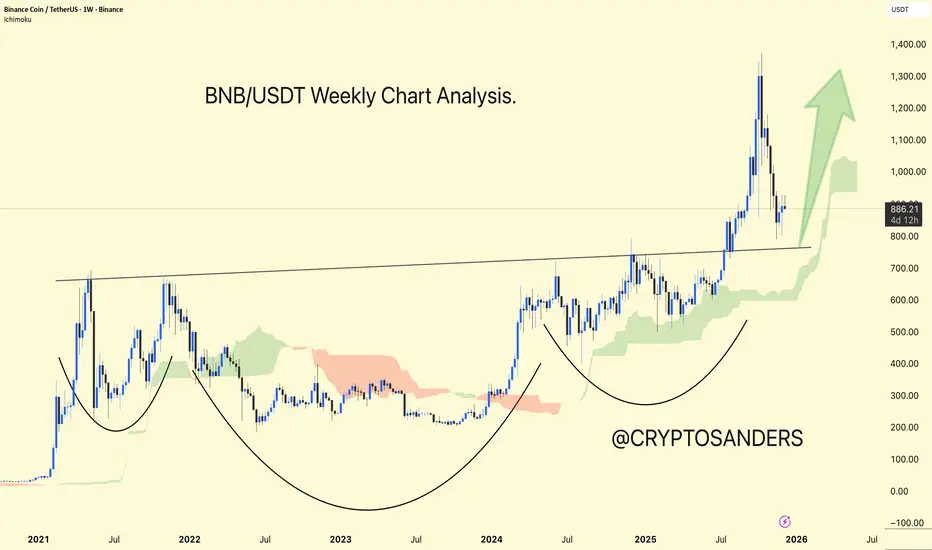
BNB/USDT Weekly Chart Analysis.BNB/USDT is trading in the range of 800 to 900 and remains within a larger bullish structure, but on higher timeframes, the price is still below a significant resistance band in the 1,160–1,180 zone.
Recent technical analysis indicates that BNB is trading above its key moving averages, with most in
FireHoseReel | BNB Daily Analysis #19🔥 Welcome To FireHoseReel !
Let’s dive into BinanceCoin (BNB) analysis.
👀 BNB 4H Overview
BNB is currently moving inside a consolidation box on the 4H timeframe, with volume steadily decreasing inside this range. A breakout from either the top or bottom of the box could trigger a strong move. Price

TECHNICAL ANALYSIS BNB/USDT1️⃣ Market Structure and Trend
The chart shows a long-term uptrend, confirmed by a very clean ascending trendline (orange), which has been acting as dynamic support for over a year.
After a strong breakout to ~1380, the price began a correction but still hasn't broken the higher low structure → th

BNB ready for breakout of channel 16% gain toward 1050$Hi,
The support and resistances on the chart are based on the previous data and weekly candlesticks,
BINANCE:BNBUSDT is in the descending channel now and close to the resistance side if it holds this
position and these last support the potential of 16% gain is logical toward 1050$.
And breakout of

BNBUSDT the resistance Broke wait for volume and pumpAs observed on the chart, BNBUSDT has executed a decisive breakout above its descending channel, indicating a potential trend reversal. The price is now consolidating in a range, which is typical behavior following a significant breakout as the market digests the move and builds a new support base.

Strong Support and Resistance Area: 533.90-793.86
Hello, fellow traders!
Follow us to get the latest information quickly.
Have a great day!
-------------------------------------
(BNBUSDT 1D Chart)
The 533.90-793.86 area is a strong support and resistance area. A decline below this area is highly likely to trigger a long-term downtrend.
Theref

BNB/USDT : Rise or continue to fall?Hello friends
considering the downtrend we have and we have identified it, you can see that the power is in the hands of the sellers and every high it hits is a selling opportunity.
But there is one point, and that is this triangle that the price has formed. If it continues the trend, it is very


See all ideas
Summarizing what the indicators are suggesting.
Oscillators
Neutral
SellBuy
Strong sellStrong buy
Strong sellSellNeutralBuyStrong buy
Oscillators
Neutral
SellBuy
Strong sellStrong buy
Strong sellSellNeutralBuyStrong buy
Summary
Neutral
SellBuy
Strong sellStrong buy
Strong sellSellNeutralBuyStrong buy
Summary
Neutral
SellBuy
Strong sellStrong buy
Strong sellSellNeutralBuyStrong buy
Summary
Neutral
SellBuy
Strong sellStrong buy
Strong sellSellNeutralBuyStrong buy
Moving Averages
Neutral
SellBuy
Strong sellStrong buy
Strong sellSellNeutralBuyStrong buy
Moving Averages
Neutral
SellBuy
Strong sellStrong buy
Strong sellSellNeutralBuyStrong buy
Displays a symbol's price movements over previous years to identify recurring trends.
Curated watchlists where BNBUSDT.P is featured.

Interest-earning crypto wallets: Put your digital money to work
12 No. of Symbols

Proof of Stake: Seeking validation?
26 No. of Symbols
See all sparks