An Example of Trading a Coin (Token) You're Hesitant to Trade
Hello, fellow traders!
By "Following," you'll always get the latest information quickly. Have a great day today.
-------------------------------------
There are coins (tokens) that are showing positive trends, but are reluctant to trade.
BNB and TRX are two such coins.
(BNBUSDT 1W chart)
(TR
Related pairs
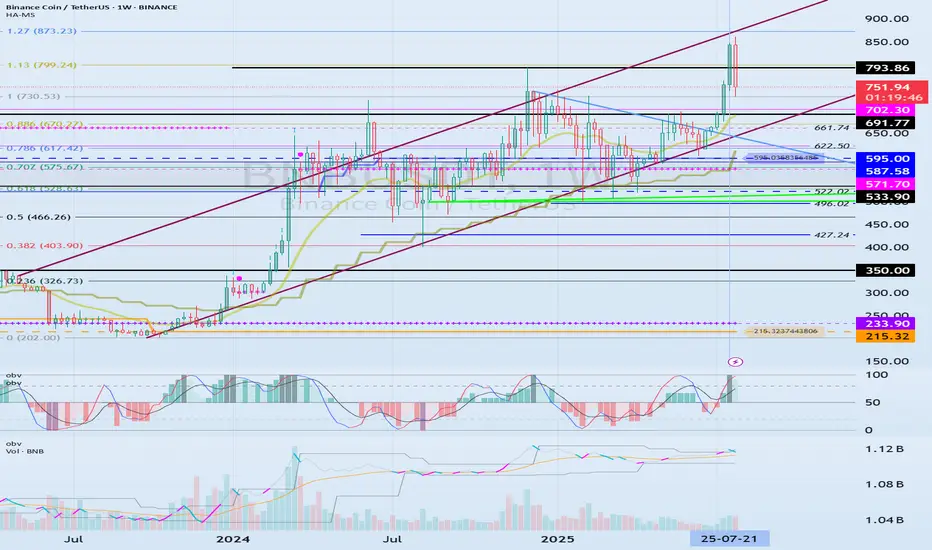
DeGRAM | BNBUSD held the support line📊 Technical Analysis
● BNBUSD rebounded from the purple rising support line and is now forming higher lows above the 750 support, aligning with the long-term channel base.
● The price structure suggests a bullish continuation toward 808.5 and 847.3 if price holds above 750, with a zigzag consolida

BNBUSDT 4H Review🔍 Technical Structure
📉 Descending Channel (orange lines)
The price was moving in a clear downtrend within the channel.
A breakout from the channel to the top occurred, which is a potentially bullish signal.
The price is currently testing a level above the channel—a classic retarget (retest) of th

Lingrid | BNBUSDT Potential Bullish ContinuationThe price perfectly fulfilled my previous idea . BINANCE:BNBUSDT is rebounding from a higher low along the upward trendline, maintaining its position within the broader bullish channel. After the recent retracement from the peak at resistance, price has stabilized above 750, suggesting accumulat

BNB - the strangest coin on the market? Almost no one trades it, and volumes have been falling for the second year in a row. But at the same time, it is the only token on the market that is in an upward flag. It is showing an even stronger trend than Bitcoin.
Yes, we are talking about BNB. Here's why you should pay attention to this tok

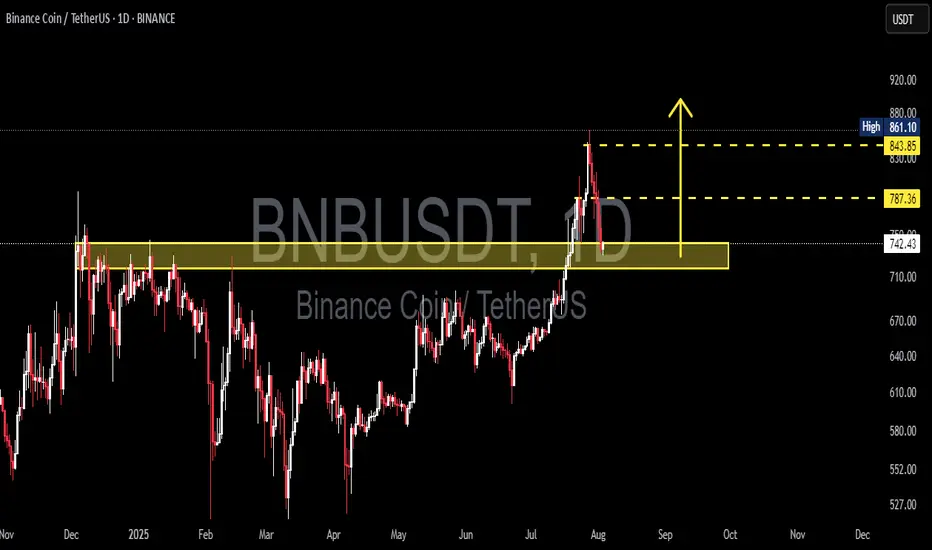
BNBUSDT Critical Retest in Progress📊 Comprehensive Analysis:
BNB/USDT has finally managed to break out of a major consolidation range that lasted over 6 months, with the key resistance zone between $730 and $750 acting as a strong ceiling since late 2024.
The breakout in late July 2025 was supported by a noticeable increase in volu
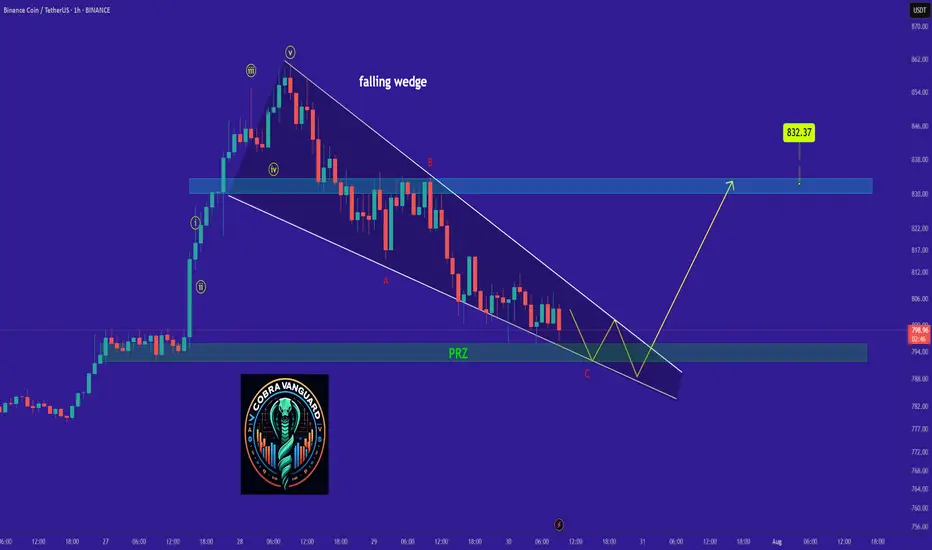
BNB's Situation (1h) !!!The BNB is in a Bullish phase by a Falling Wedge Pattern.
A falling wedge indicates the potential for price to reach to $830.
Note if the PRZ ZONE is broken downwards with the strength of Bearish candles , this analysis of ours will be failed.
Best regards CobraVanguard.💚
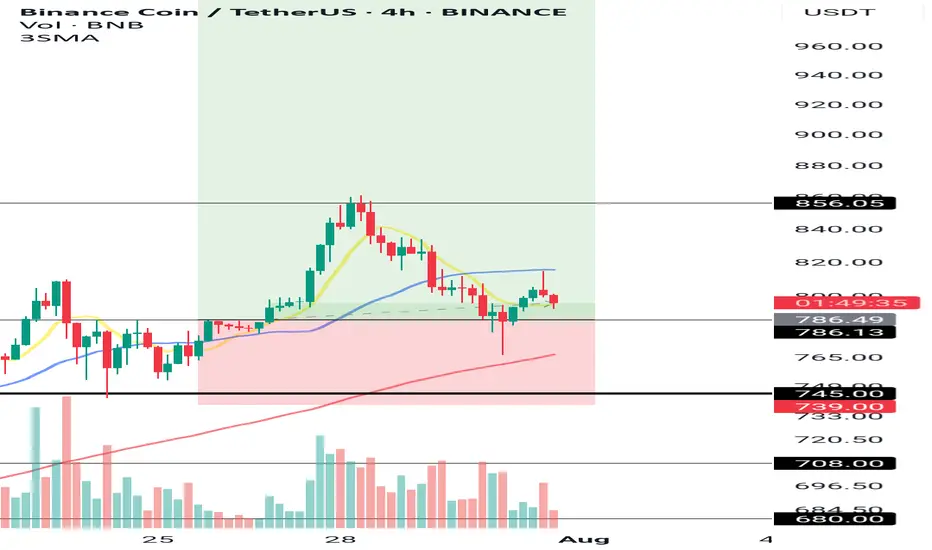
Binance Coin (BNB): Buyers Secured The 200EMABNB recently had a decent downside movement, where after reaching the 200 EMA line, buyers quickly reached and took control over that zone.
What we see here is proper upside pressure and bullish dominance, which can lead us back to the $850 area.
Swallow Academy

BNB Structural Analysis – Decision Zone & Bullish Setup Ahead!💎🚀 BNB Structural Analysis – Decision Zone & Bullish Setup Ahead! 🔥♦️
🔍 Dow Theory + Index Review + Market Structure Breakdown
✅ Like 💥 Follow 💬 Comment to keep this content coming daily!
👋 Hey traders! Welcome to our daily crypto routine:
📅 Every Day:
🔹 BTC + ETH technical updates
🔹 Full market s
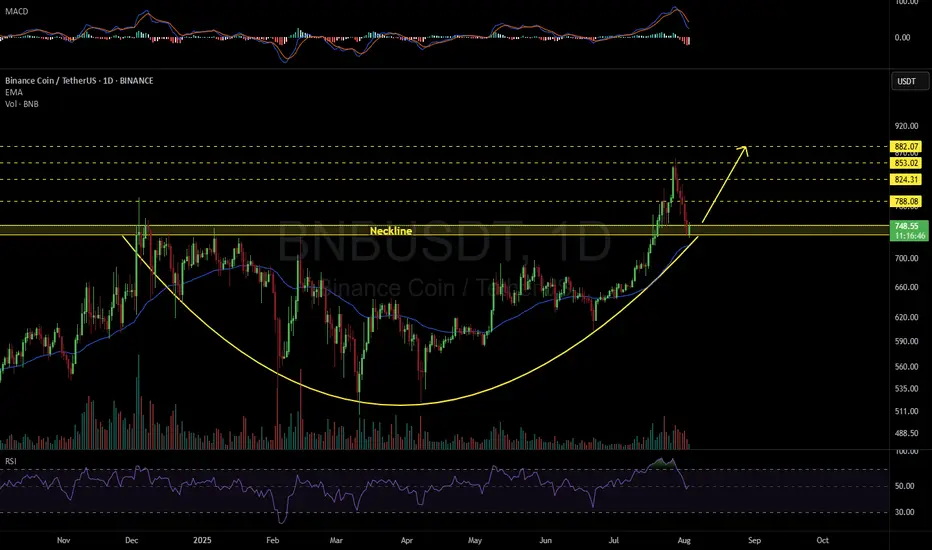
BNBUSDT 1D#BNB can continue its upward movement if — and only if — it holds above the neckline and confirms it as support.
If that happens, the potential targets are:
🎯 $788.08
🎯 $824.31
🎯 $853.02
🎯 $882.07
⚠️ As always, use a tight stop-loss and apply proper risk management.
See all ideas
Summarizing what the indicators are suggesting.
Oscillators
Neutral
SellBuy
Strong sellStrong buy
Strong sellSellNeutralBuyStrong buy
Oscillators
Neutral
SellBuy
Strong sellStrong buy
Strong sellSellNeutralBuyStrong buy
Summary
Neutral
SellBuy
Strong sellStrong buy
Strong sellSellNeutralBuyStrong buy
Summary
Neutral
SellBuy
Strong sellStrong buy
Strong sellSellNeutralBuyStrong buy
Summary
Neutral
SellBuy
Strong sellStrong buy
Strong sellSellNeutralBuyStrong buy
Moving Averages
Neutral
SellBuy
Strong sellStrong buy
Strong sellSellNeutralBuyStrong buy
Moving Averages
Neutral
SellBuy
Strong sellStrong buy
Strong sellSellNeutralBuyStrong buy
Displays a symbol's price movements over previous years to identify recurring trends.
Curated watchlists where BNBUSDT is featured.

Interest-earning crypto wallets: Put your digital money to work
12 No. of Symbols

Proof of Stake: Seeking validation?
26 No. of Symbols
See all sparks
Frequently Asked Questions
The current price of Binance Coin / TetherUS (BNB) is 774.81 USDT — it has risen 2.34% in the past 24 hours. Try placing this info into the context by checking out what coins are also gaining and losing at the moment and seeing BNB price chart.
Binance Coin / TetherUS price has fallen by −4.00% over the last week, its month performance shows a 16.55% increase, and as for the last year, Binance Coin / TetherUS has increased by 59.79%. See more dynamics on BNB price chart.
Keep track of coins' changes with our Crypto Coins Heatmap.
Keep track of coins' changes with our Crypto Coins Heatmap.
Binance Coin / TetherUS (BNB) reached its highest price on Jul 28, 2025 — it amounted to 861.10 USDT. Find more insights on the BNB price chart.
See the list of crypto gainers and choose what best fits your strategy.
See the list of crypto gainers and choose what best fits your strategy.
Binance Coin / TetherUS (BNB) reached the lowest price of 0.50 USDT on Nov 6, 2017. View more Binance Coin / TetherUS dynamics on the price chart.
See the list of crypto losers to find unexpected opportunities.
See the list of crypto losers to find unexpected opportunities.
The safest choice when buying BNB is to go to a well-known crypto exchange. Some of the popular names are Binance, Coinbase, Kraken. But you'll have to find a reliable broker and create an account first. You can trade BNB right from TradingView charts — just choose a broker and connect to your account.
Crypto markets are famous for their volatility, so one should study all the available stats before adding crypto assets to their portfolio. Very often it's technical analysis that comes in handy. We prepared technical ratings for Binance Coin / TetherUS (BNB): today its technical analysis shows the buy signal, and according to the 1 week rating BNB shows the buy signal. And you'd better dig deeper and study 1 month rating too — it's buy. Find inspiration in Binance Coin / TetherUS trading ideas and keep track of what's moving crypto markets with our crypto news feed.
Binance Coin / TetherUS (BNB) is just as reliable as any other crypto asset — this corner of the world market is highly volatile. Today, for instance, Binance Coin / TetherUS is estimated as 2.03% volatile. The only thing it means is that you must prepare and examine all available information before making a decision. And if you're not sure about Binance Coin / TetherUS, you can find more inspiration in our curated watchlists.
You can discuss Binance Coin / TetherUS (BNB) with other users in our public chats, Minds or in the comments to Ideas.