BNBUSDT trade ideas
Binance Coin (BNB): Looking For Another Bounce ZoneBNB has had a decent upside movement since the last time we touched the zone of EMA, where the price got recently rejected near the local resistance zone.
As we got rejected, we are seeing further downside movement and pressure, so we are looking for another movement toward the EMAs, where we will be looking for similar MSB like last time we touched those zones.
We set few entry zones that we will be keeping an eye on; once we reach them, we are going to look for MSB and then another movement towards the resistance area.
Swallow Academy

Bnb long to $870Just now opened a long position on bnb
Aiming for the higher highs at $870
Sl: 844.10

BNB Bullish Setup – Breakout on the Horizon?#BNB has been moving in a perfect bullish trend, consistently printing new highs and showing strong momentum.
On the 4H timeframe, price has tested the 860–868 zone multiple times – this is our key resistance level to watch.
Currently, #BNB is forming a bullish flag pattern, which often acts as a continuation signal in strong uptrends.
Bullish Confirmation Plan:
Wait for a clean breakout above the flag and resistance zone (860–868).
On a successful retest of support, we can look for long entries.
Always apply proper risk management to protect capital.
Key Levels to Watch:
Resistance: 860–868 (major breakout zone)
Support: Recent flag lower boundary
If #BNB breaks this zone with volume, we could see a strong continuation towards new highs.
What do you think? Is BNB gearing up for another rally? Drop your thoughts below and let’s discuss!
#BNB #Crypto #Altcoins #TradingStrategy #Bullish #Breakout #CryptoTrading #BNBAnalysis #CryptoCommunity #TradingView
BnBBnb usdt daily analysis
Time frame daily
Risk rewards ratio >2.3 👈👈
Target 1005$
Try to breaks the last high
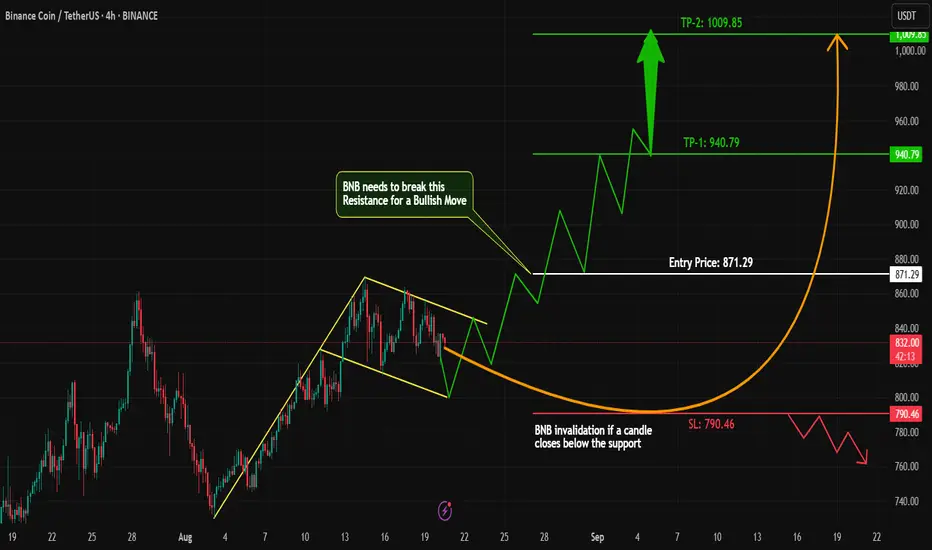
BNB/USDT Binance Coin Breakout to 990?BINANCE:BNBUSDT is setting up for a bullish breakout on the 4-hour chart , with an entry zone between 812-820 near the support zone and rising trendline. First target at 890 aligns with initial resistance, while the second target at 990 could push into new highs if momentum builds. Set a stop loss at 790.5 on a close below to manage risk tightly.
A surge above 830 with strong volume could confirm this move, driven by Binance ecosystem news and crypto market recovery.
Watch BNB chain activity and overall sentiment as key catalysts. This setup looks promising for traders eyeing the rebound—what’s your play?
Do you see this BNB breakout happening? Share your thoughts!
#BNBUSDT #BinanceCoin #CryptoSignals #TechnicalAnalysis #TradingView #DayTrading #MarketAnalysis

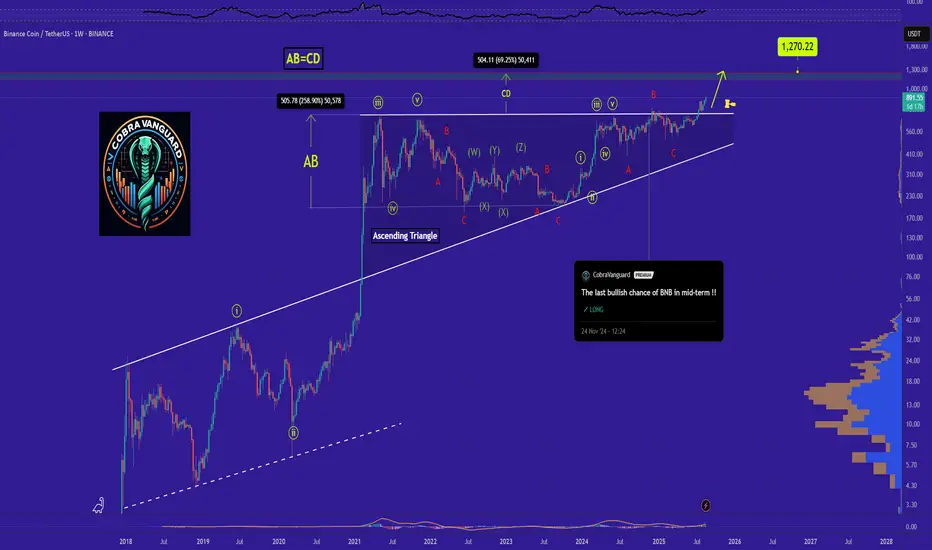
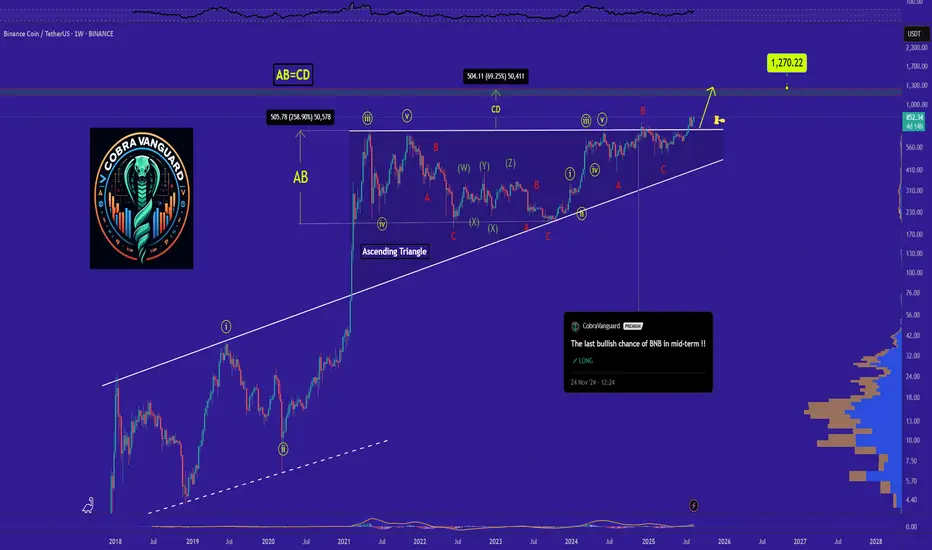
Do you think I'm joking ???As I said, BNB broke the triangle, it could surge to $1000 , and you still think I'm joking!!
The price is currently supported well, which can increase the price.
Stay Awesome , CobraVanguard
Previous analysis
Lingrid | BNBUSDT Buying Opportunity Following Pullbacks The price perfectly fulfilled my previous idea . BINANCE:BNBUSDT is pulling back toward the upward trendline support after forming a higher low, keeping the bullish structure intact. Price action suggests buyers may step in near the 814 zone, aiming for a rebound toward 915 resistance within the channel. Holding above 800 would maintain the second impulse leg toward the projected 920 target. Momentum continuation aligns with the overall uptrend trajectory.
📉 Key Levels
Buy trigger: Break above 860
Buy zone: 814 – 850
Target: 915 – 920
Invalidation: Close below 800
💡 Risks
Failure to hold trendline support at 800
Weak breakout above 860 leading to a bull trap
Increased selling pressure near 915 resistance
If this idea resonates with you or you have your own opinion, traders, hit the comments. I’m excited to read your thoughts!

Trendline BreakoutA perfect case study on CRYPTOCAP:BNB today 👇
🔹 Trendline breakout confirmed
🔹 Target hit smoothly
🔹 Trailing SL extended profits
Takeaway → In trading, risk mgmt + exit strategy > entry.

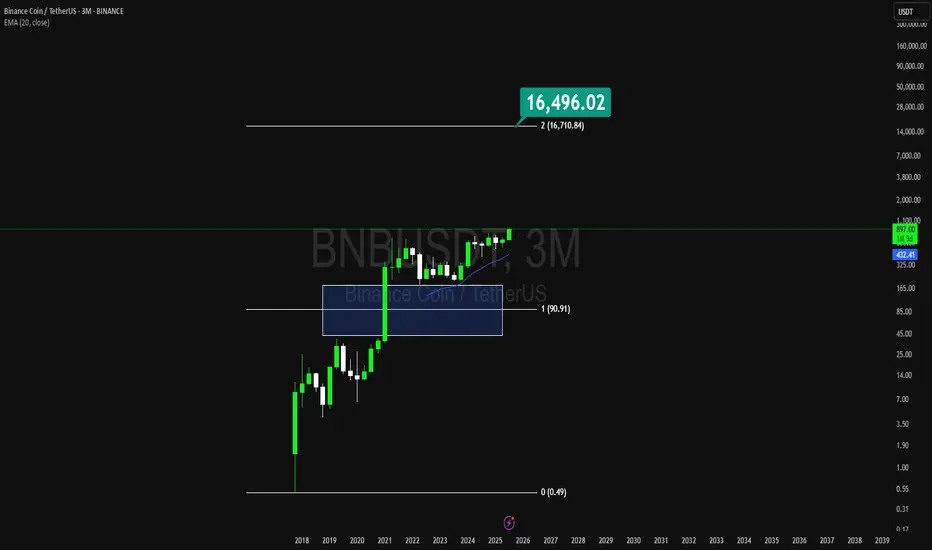
BNB TargetBinance's target based on the measured Gap, based on the middle gap, is around $15,000 to $16,000.
Binance coin broke through the previous resistance ┆ HolderStatBYBIT:BNBUSDT has broken through previous resistance after months of consolidation and wedge formations. Momentum remains bullish, and with price holding above $800, the next key target sits at $950. The chart structure favors continued gains if buyers maintain control.

Binance coin has dropped from $860 ┆ HolderStatOKX:BNBUSDT on the 6h chart shows a double top near 880, a sign of temporary weakness. However, the market is holding above the $800 critical level. Past triangle and sideways patterns hint at continued accumulation, with upside potential once 860 is cleared.

BNB - Bread and BreadIts not AirBnB its oly bread with no butter and u know where u can get the butter atleast

BNB Wave Analysis – 18 August 2025- BNB reversed from strong resistance level 859.00
- Likely to fall to support level 810.00
BNB cryptocurrency recently reversed from the resistance zone located between the strong resistance level 859.00 and the upper daily Bollinger Band.
The downward reversal from this resistance zone is likely to form the daily Japanese candlesticks reversal pattern Bearish Engulfing.
Given the strength of the resistance level 859.00 and the overbought daily Stochastic, BNB cryptocurrency can be expected to fall to the next support level 810.00 (low of the earlier wave ii).


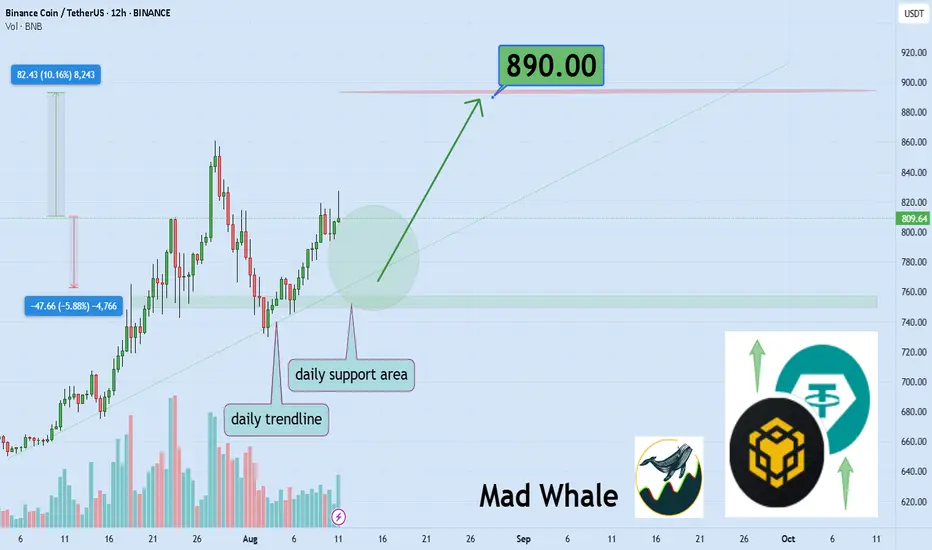
Binance Testing Support, Poised for 10% Rally to $890Hello✌️
Let’s analyze Binance’s price action both technically and fundamentally 📈.
🔍Fundamental analysis:
CEA Industries bought 200K BNB ($160M) in July 2025 as part of a $500M reserve plan, joining other firms adding BNB to their treasuries.
Institutional buying could tighten supply and support BNB toward the $1,000 mark if demand grows. 📈
📊Technical analysis:
BINANCE:BNBUSDT is testing a strong daily support and a key monthly trendline 📉. If these levels hold, a 10% upside move toward $890 is likely 🚀.
✨We put love into every post!
Your support inspires us 💛 Drop a comment we’d love to hear from you! Thanks, Mad Whale
LONG BNBMulti-Timeframe Bullish Confirmation: Weekly, daily, and 4h charts all show sustained uptrend, with price above key EMAs and strong momentum across time horizons.
Strong Institutional and Ecosystem Support: Recent news highlights large institutional acquisitions and expanding Binance ecosystem utility, affirming BNB’s foundational role in crypto infrastructure.
Clear Technical Targets: Fibonacci extensions and previous highs give a well-defined price objective, with $1,250 as the thesis target and technical resistance only modestly overhead.
Robust Risk Management: Stop loss placed at $626—safely below major technical supports and past swing lows—protects capital while allowing room for volatility.
Healthy Market Structure: No signs of euphoria or volume blow-off, just steady liquidity and rising relative volume, consistent with sustainable growth phases.
Positive Macro and Altcoin Context: Alts have very healthy momentum and inflation as well as risk assets are grinding higher.
Compelling Risk-Reward Profile: Thesis offers an asymmetric opportunity (~1.86 R/R), fitting for a patient multi-week/month position with clear upside and measured downside.

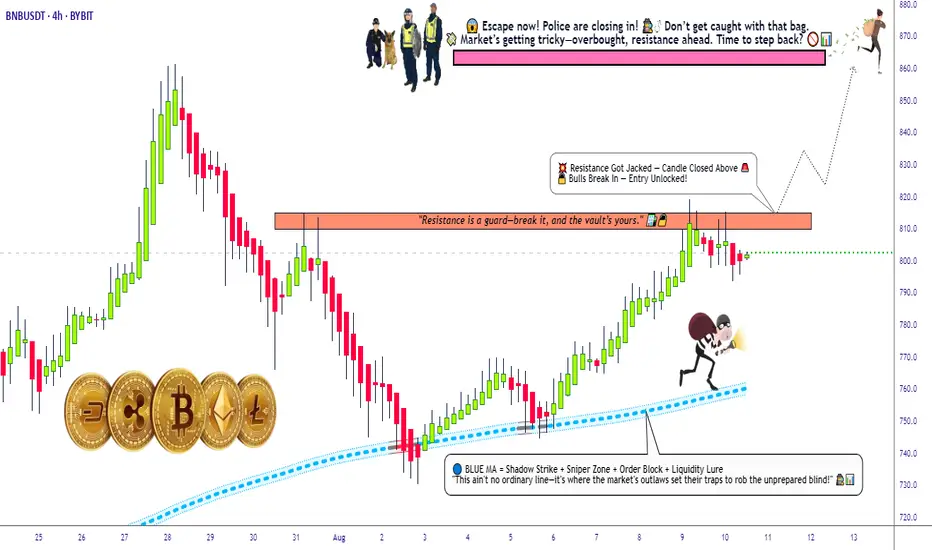
BNB Breakout Masterplan | Police Trap Near Target – Exit Early💎BNB/USDT – The Binance Coin Breakout Heist @820💎
🚨🛡️ Thieves Assemble! 🛡️🚨
The BNB vault doors are about to swing open at 820.0 – and we’re first in line to snatch the loot! This isn’t just a trade; it’s a full-blown breakout robbery plan!
📌 Asset: BNB/USDT "Binance Coin vs Tether"
📌 Plan: Bullish Breakout
📌 Entry: Any price level (load up those layered limit orders like a pro safecracker 🗝️)
📌 Stop Loss: 783.0 (Hide your tracks here if the mission fails)
📌 Target: 860.0 – but remember… the POLICE are waiting near the target 🚓💨, so exit before they close in!
🎯 Mission Brief:
Our technical recon shows BNB is ready to blast past resistance @820.0 – powered by momentum, liquidity traps, and a bit of fear in the bear camp. We layer orders like stacking gold bars, letting the market hand us profit bags one by one.
🛑 Stop Loss Protocol:
Place it with precision at 783.0. Adjust according to your order size & risk appetite – this is no place for sloppy work.
💰 Profit Extraction:
860.0 is the jackpot zone – but if the heat gets too close, escape earlier with your bags full. Use trailing SL to secure the loot.
⚠️ Market Surveillance Alert:
Avoid entering during high-impact news – too many sirens. 🚨
Lock in profits once the market gives you the chance – don’t get greedy.
Scalpers: Only rob on the long side; bears are heavily armed.
💥 Support the crew – Boost this idea so our robbery team grows stronger! Every boost makes us richer in both clout and coin. 🏴☠️💎
Stay sharp, move fast, and escape clean.
We’ll meet again for the next big market heist. 🤑🚀

DeGRAM | BNBUSD above the channel📊 Technical Analysis
● BNBUSD has broken the upper boundary of its upward channel twice, confirming strong bullish momentum.
● Current consolidation above 820.15 support within the channel suggests potential continuation toward the 880–920 resistance area.
💡 Fundamental Analysis
● BNB ecosystem growth accelerates as DeFi projects and cross-chain integrations boost network usage, with Binance expanding its regulated market presence.
✨ Summary
Bullish above 820.15; targets 880 → 920. Invalidation below 800.
-------------------
Share your opinion in the comments and support the idea with a like. Thanks for your support!

BNB at the top of Bullish Channel
As it shown, BNB is around top line of Channel ad get ready to drop

Technical analysis for BNB/USDT1. Overall Trend (Price Action & Market Structure)
• Long-term trend: Strong bullish trend — since March 2025, price broke out of a long consolidation zone (~550–680 USDT) and is now hitting new highs.
• Mid-term trend: After breaking out from the accumulation range, price is forming a sequence of Higher Highs (HH) and Higher Lows (HL).
• Key supports: ~786 USDT (breakout zone + 0.786 Fib), 720 USDT (previous local top).
• Key resistances: Current resistance zone ~860–880 USDT. Next target: ~975–980 USDT (1.618 Fib).
⸻
2. Fibonacci Analysis
From the drawn retracement:
• Price has broken above 0.786 and is now trading beyond the 1.0 Fib.
• Fibonacci extensions:
• 1.272: ~920 USDT
• 1.618: ~975–980 USDT → likely target if momentum stays intact.
• Current price action suggests the market could aim for 1.618 within the coming weeks if no major correction occurs.
⸻
3. Volume
• Breakout from consolidation was supported by increasing volume — confirming strong buying interest.
• Recent bullish candles have moderate volume — not yet euphoric, but demand is clearly exceeding supply.
• If near 880–900 USDT we see large-volume candles with long upper wicks, this could signal distribution.
⸻
4. RSI (Momentum)
• Daily RSI is around ~72 → market is entering overbought territory.
• Two possible scenarios:
• Continuation: RSI can remain overbought during strong trends (overbought can stay overbought).
• Correction: RSI dropping below 70 with bearish divergence forming against price.
⸻
5. Chart Patterns
• Breakout from a wide rectangle range (550–680 USDT).
• Current move resembles a mark-up phase with a possible mini-flag on H4.
• No clear signs of Wyckoff-style distribution yet.
⸻
6. EMAs / SMAs
(Not visible on your chart, but based on typical setups in such a trend):
• EMA20 and EMA50 on D1 are strongly spread apart — confirming bullish momentum.
• Price is far above EMA200 → long-term trend remains healthy.
⸻
7. Scenarios
Bullish:
• Holding above 820–830 USDT → attack on 920 USDT, then 975–980 USDT (1.618 Fib).
• RSI may stay >70 for several days, historically giving BNB an extra few % of gains.
Bearish:
• Drop below 820 USDT → retest of 786 USDT support.
• Break of 786 → deeper correction towards 720 USDT (breakout retest).
⸻
8. Summary
• Trend: Strong bullish trend, momentum still favors buyers.
• Key levels:
• Support: 786 → 720 USDT
• Resistance: 880 → 920 → 975–980 USDT
• Risks: Possible pullback at RSI >70, especially if volume spikes and large upper wicks appear.

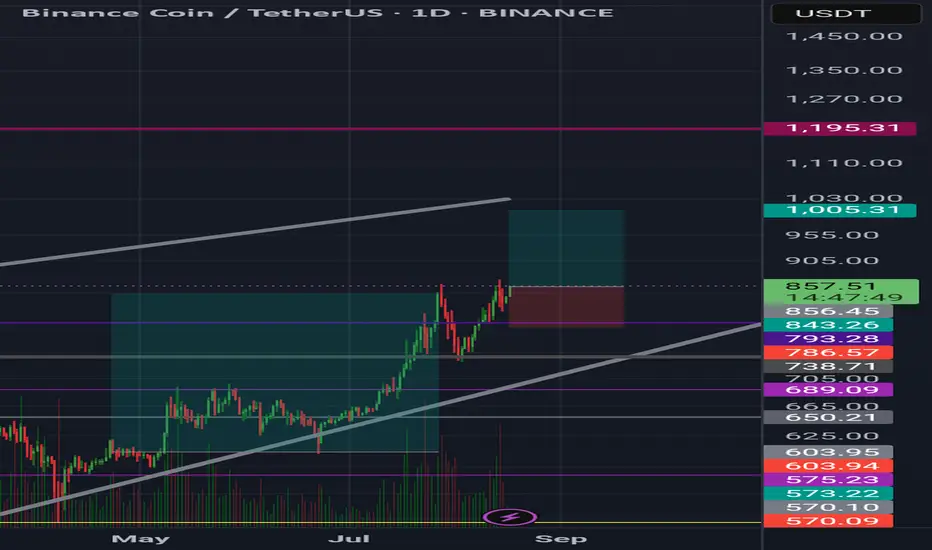
BNB/USDT 1DTrend and market structure
• The price moves in an upward trend from the hole around 730 USDT, maintaining support on the trend line (orange line).
• Current price: ~ 840 USDT, close to important resistance at ~ 862 USDT.
• Another strong resistance is located at 940–950 USDT.
• The next support is 809 USDT (local horizontal level) and 758 USDT (earlier hole).
⸻
Medium walking (SMA)
• SMA #1 (red) is below the price - this is a growth signal.
• SMA #2 (green, long -term) is also below and inclined up - confirms the upward trend.
• SMA #5 (blue, very long) is far below - the market is still in the growth phase.
⸻
Indicators
• MacD - MacD line pierces the signal line from below, which is a buy signal. The histogram is slightly positive.
• RSI - ~ 66 points, grows towards the purchase zone (70). There is no extreme yet, but it is approaching - the risk of correction after breaking the resistance.
⸻
• (more likely with current dynamics): breaking the level of 862 USDT and continuation in the direction of 940 USDT. There are more profit realizations possible here.
• Bear: rejection from resistance and decrease in the direction of 809 USDT or even a trend line test and level 758 USDT.
