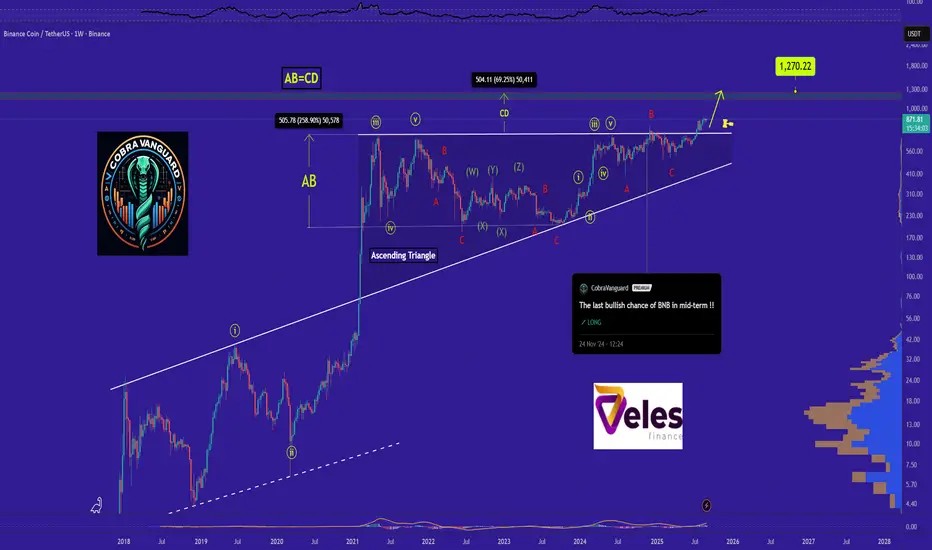
BNB is bullish now and many Traders don't see it !!As I said, BNB broke the triangle, it could surge to $1000 , and you still think I'm joking!!
The price is currently supported well, which can increase the price.
Stay Awesome , CobraVanguard
Previous analysis
BNBUSDT trade ideas
What Does a Range-Bound Market MeanThe market isn’t always driven by dynamic, trending moves. There are periods when price seems to “freeze” between levels, moving up and down but without a clear direction. This condition is called a range-bound market, or flat (sideways movement). Such phases often become a real test for traders because trend-following strategies stop working, and chaotic trades frequently lead to losses.
What Is a Range-Bound Market
A range-bound market is a section of the chart where price oscillates within a narrow channel, repeatedly testing support and resistance levels without a decisive breakout. In such phases, the market is essentially “resting” after a strong move, consolidating energy and preparing for the next impulse.
From a market psychology perspective, flat conditions represent a balance between buyers and sellers. Some participants wait for a favorable entry point, while others lock in profits or reduce exposure. As a result, price fluctuates within a corridor until an imbalance of forces triggers a breakout.
Why Flat Conditions Are Risky
At first glance, sideways movement may seem safe: price isn’t crashing or soaring dramatically. But this is exactly where the danger lies for traders.
- False breakouts: Price often moves beyond the range briefly, creating the illusion of a new trend, only to snap back. Traders who rushed in usually end up with losses.
- Increased transaction costs: Frequent entries and exits within a range lead to numerous small trades, and commissions eat into potential profits.
- Emotional burnout: A prolonged sideways market makes it hard to stay focused. Mistakes stem from fatigue and the urge to “make something happen.”
That’s why many traders consider a range-bound market the worst state: it offers little directional movement but creates plenty of opportunities to overtrade and lose.
How to Trade During Flat Conditions
The most common mistake is trying to trade a flat market the same way as a trending one. Instead, a different playbook applies here.
- Define the range boundaries: Support and resistance levels become critical. Mark them clearly and pay attention to repeated touches.
- Trade from the edges: It’s usually better to enter near support (buy) or resistance (sell) rather than in the middle of the range.
- Take profits quickly: Don’t expect large moves. Targets in range trading are much smaller than in trending conditions.
- Reduce trade frequency: Avoid reacting to every small price swing. Wait for confirmations at levels and act selectively.
- Watch the volume: Breakouts are often accompanied by a volume spike. That can be the first signal of a directional move ahead.
When to Expect a Breakout
Every range eventually ends. The question is when and in which direction. To avoid guessing, look for signs of preparation:
- Price starts compressing within the range, forming a triangle pattern.
- Trading volume decreases, followed by a sudden surge.
- Support or resistance levels get tested more frequently.
A breakout confirmed by price consolidation above resistance or below support usually marks the start of a new trend. These moments often create the best entry opportunities.
Why a Systematic Approach Matters Most
Most traders lose money in sideways markets not because they lack knowledge, but because they give in to emotions. The urge to chase every move, fear of missing “the breakout,” or frustration from inactivity turn trading into random gambling. A systematic approach changes the picture. When a trader has a clear algorithm—how to spot ranges, which levels to mark, where to take profits, and when to wait for a breakout—the market becomes structured, not chaotic. Discipline is even more important in flat conditions than in trends, because this is where the foundation for the next strong move is laid.
The Practical Value of Automation
Flat phases are where automation tools are especially helpful. Algorithms that highlight levels, suggest take-profit zones, and manage risk allow traders to avoid guesswork and emotional mistakes.
- For beginners, this serves as a navigation tool: they learn to recognize market structure and understand when to act and when to stay out.
- For experienced traders, automation supports discipline, speeds up analysis, and reduces emotional bias.
Conclusion
A range-bound market isn’t the enemy of traders—it’s a natural state of the market. It may be exhausting with its unpredictability and tempting false moves, but these periods build the energy for future trends.
Traders who can identify flat conditions and follow a structured system not only protect their capital but also position themselves for strong moves that always follow consolidation.
The market will always test traders’ nerves. But with discipline, technical analysis, and automation, even the chaos of a sideways phase becomes a controlled process. And that’s what separates random luck from consistent results.

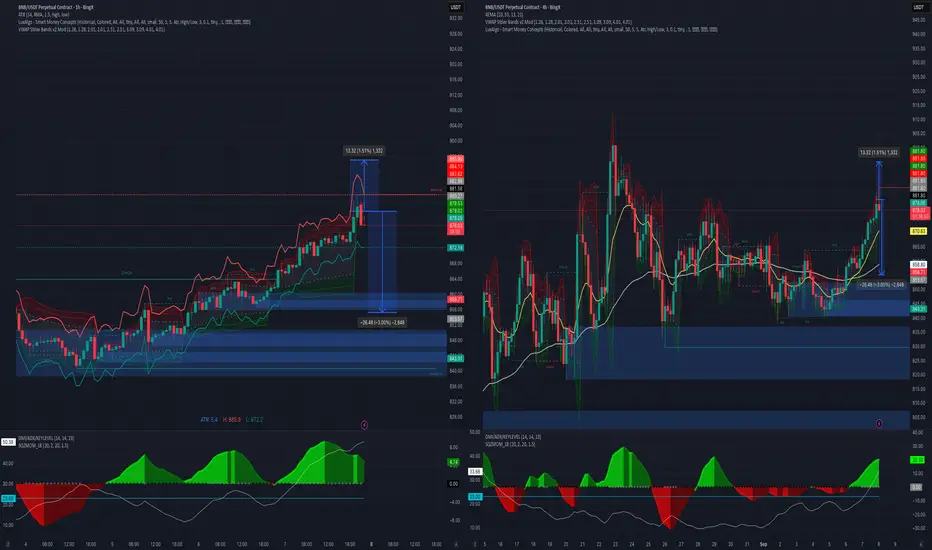
BNB: Downward TrendOn August 24, the BNB market turned into a downward move on the 1-hour chart from the $871 level. Since then, price has steadily moved through profit-taking zones and reached a low of $832, giving a difference of nearly $40 per coin. The trade has already passed four targets and remains active, keeping potential for further continuation.
The main value here lies in management. The algorithm step by step highlighted profit-taking zones and helped relieve emotional pressure. This approach allows traders to hold positions longer and capture more from the move without giving in to fear or greed.
For beginners, it works like a navigator: simplifying chart reading and showing where it’s safer to take profit and where holding makes sense. The market will always be unpredictable, but when the process is structured, trading stops being a chaotic gamble and turns into a system where discipline makes the difference.

“What I will do today in BNB”Possible entry in BNB around 881.64 with stop at 895.17 and take at 855.14, 1:2 ratio.
Lingrid | BNBUSDT Trend Continuation Pattern Completed. BuyBINANCE:BNBUSDT is trading within a strong upward channel after rebounding from the 865 support zone, confirming bullish momentum. The chart shows a sequence of higher lows and a sustained climb along the trendline, highlighting the strength of buyers. Price is now targeting the 932 level, with potential extension toward the 970 resistance area if momentum holds. As long as the upward channel remains intact, the probability favors continuation rather than reversal. A rejection at mid-channel could still provide consolidation before the next leg higher. Broader structure suggests that bulls are preparing to challenge overhead resistance zones.
💡 Risks:
A break below 865 would invalidate the bullish channel and expose downside toward 748.
Upcoming CPI data could boost USD strength, weighing on crypto market sentiment.
A sudden shift in Fed guidance or risk-off sentiment in equities could stall the breakout attempt.
If this idea resonates with you or you have your own opinion, traders, hit the comments. I’m excited to read your thoughts!

BNBUSDT 1H coin holding the channelBinance Coin keeps moving inside its upward channel, once again confirming support at the lower boundary. EMAs are aligned below price, creating a local cushion, while the volume profile highlights accumulation around 860–870.
As long as price holds above 838, the structure stays bullish with the next upside target around 920–940.
Fundamentally BNB still carries the weight of the largest exchange behind it, which adds long-term confidence for buyers.
Right now BNB looks like a train on its rails
the direction is clear, only the speed of the ride remains in question.

BNB/USDT: Bullish Climb to 965?As the previous analysis worked exactly as predicted, BINANCE:BNBUSDT is gearing up for a bullish move on the 4-hour chart , with an entry zone between 859-868 near a key support and trendline.
First target at 930 marks initial resistance, while the second at 965 signals a potential breakout. Set a stop loss on a daily close below 840 to manage risk effectively. 🌟
A break above 875 with solid volume could trigger this climb, driven by BNB ecosystem news and market momentum. Watch BTC trends! 💡 Ready for this rise? Drop your take below! 👇
📝 Trade Plan:
✅ Entry Zone: 859 – 868 (support + trendline area)
❌ Stop Loss: Daily close below 840 to manage risk
🎯 Target 1: 930 (initial resistance)
🎯 Target 2: 965 (potential breakout zone)
Ready for this rise? Drop your take below! 👇

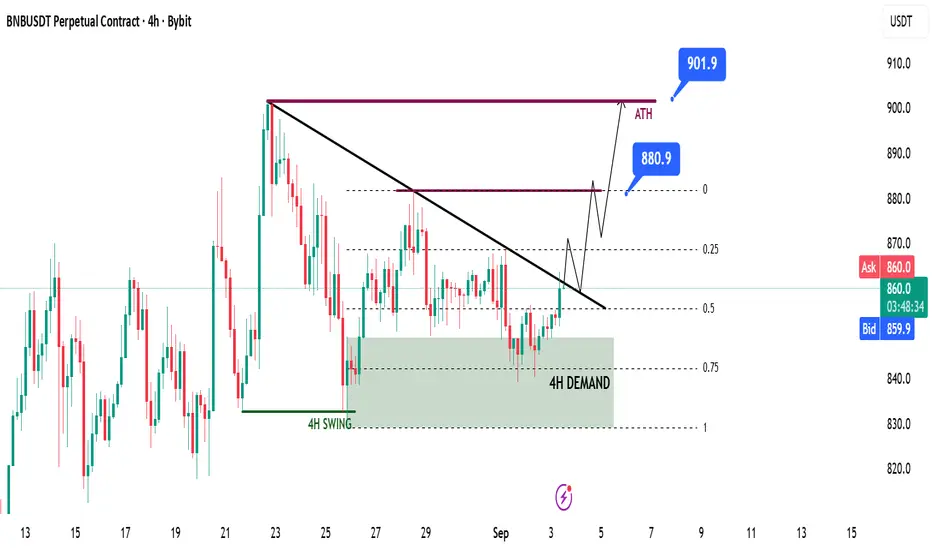
BNB Targeting All-Time Highs BNB Targeting All-Time Highs
📊 Market Sentiment
Sentiment remains constructive, supported by the prospect of a 0.25% rate cut in the upcoming FOMC meeting. With the USD losing strength and global risk appetite improving, conditions continue to favor upside momentum in crypto markets.
📈 Technical Analysis
BNB shows strong bullish momentum, so I’m only focused on long setups.
Price swept 4H swing liquidity and closed strongly above, signaling a deviation of the liquidity pool and intent to push higher.
A 4H demand zone was created after the liquidity raid, and price has already retested it while aligning with the 0.75 max discount zone both giving a strong bounce.
Currently, price is moving towards the LTF bearish trendline.
📌 Game Plan
I want to see a clean breakout above the bearish trendline. At least two consecutive 4H candle closes above the trendline will confirm the breakout for me.
🎯 Setup Trigger
I will enter after a confirmed retest of the broken trendline.
📋 Trade Management
Stoploss: Two consecutive 4H closes below the broken trendline
Targets:
• TP1: $880
• TP2: $901 (All-Time Highs)
💬 Like, follow, and comment if you find this setup valuable!
⚠️ Disclaimer: This content is for informational and educational purposes only and does not constitute financial, investment, or trading advice. Always do your own research before making any financial decisions.
BNB 1H Analysis - Key Triggers Ahead😃 Hey , how's it going ? Come over here — Satoshi got something for you!
⏰ We’re analyzing BNB on the 1-Hour timeframe.
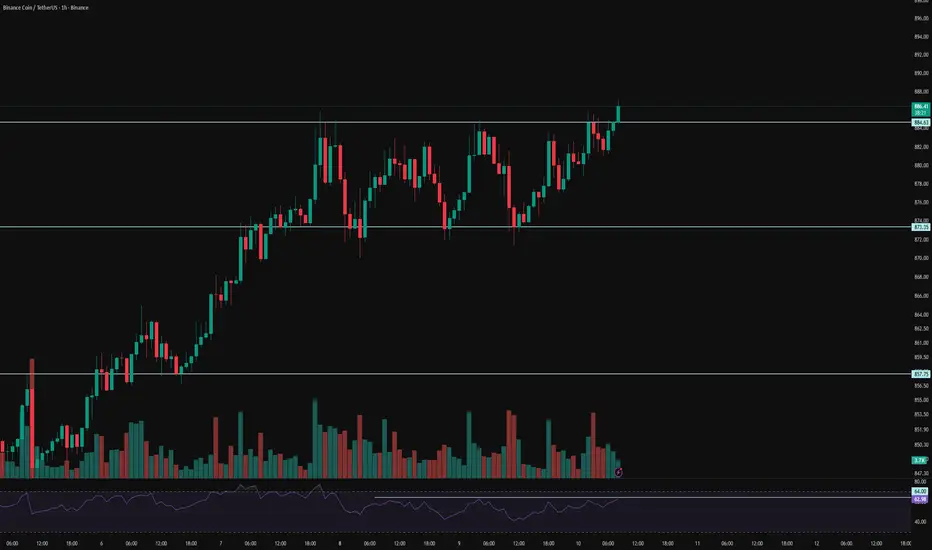
👀 On the 1-hour timeframe of Binance Coin we can see that this coin, the popular token of Binance exchange with very strong backing, has formed a very important resistance at $885. With a breakout and confirmation above this level, and if the PPI news is positive, BNB could start another strong upward move.
⚙️ The key RSI level for this coin is at 64, and breaking above this level could give BNB higher volatility and even a price surge.
🕯 The volume, size, and number of green candles are increasing, and it seems we are almost exiting the range structure. With buying pressure and rising volatility, BNB could form more green candles and experience solid price growth.
🌒 On the 1-hour timeframe of the BNBBTC pair we can see that it has been rejected from the 0.007915 zone, which has created a trigger for a breakout at this level. If this zone is broken, BNB could also break its marked resistance in the USDT pair and move upward.
💡 This coin had resistance at $885, which has now been broken, and it is moving upward. A pullback to this resistance also happened during this breakout, which was executed well. For confirmation, you can also check the 15-minute timeframe.
❤️ Disclaimer : This analysis is purely based on my personal opinion and I only trade if the stated triggers are activated .
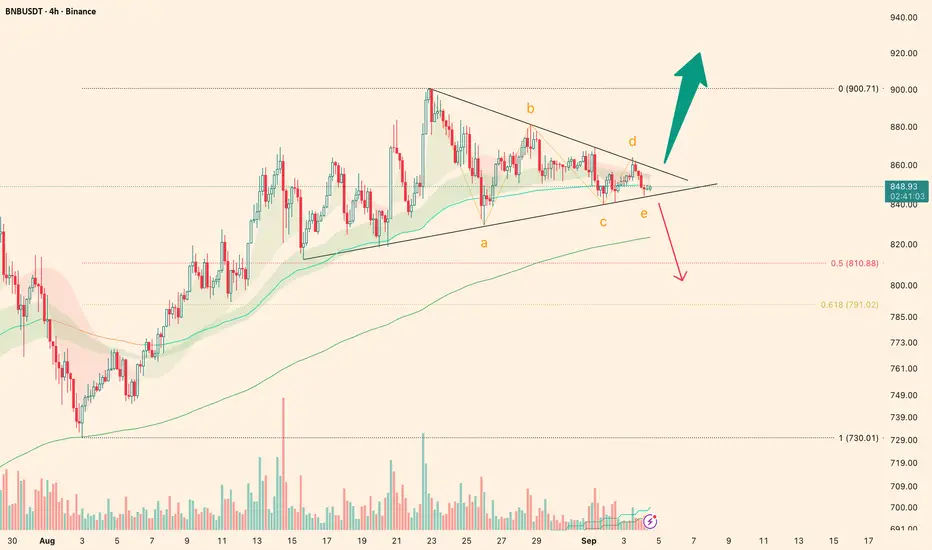
BNB Approaching Triangle Breakout — Long or Short Ahead?BNB’s price is consolidating within an ABCDE triangle . On the chart, two clear trendlines can be drawn: the descending line with 4 touches and the ascending line with 5 touches , highlighting the importance of both.
If the descending trendline breaks, I’ll be looking for long positions, as the price would likely aim to set a new ATH. However, there’s still a chance of a drop within a standard ABC correction.
If the ascending trendline breaks, I’ll be opening short positions with a target in the 810–790 range
BNB WEEKLY CHARTBNB WEEKLY CHART,we are still bullish for BNB until the break of the weekly demand floor ,if we dont break that weekly floor dont think of making careless sell other,
NOTE all buy and sell are given in the structure for reference only
#bnb #bnbusdt

BNBUSDT — Bullish consolidation ahead of resumed uptrendThe bullish consolidation in BNBUSDT that I’ve been watching has begun to resolve in the market’s favor. Price action is coiling after two consecutive white spinning-top candles, a pattern that signals indecision but also a readiness to resume the prior trend when confirmed. The move has occurred on heavier volume concentrated in the current price area, and the pair sits roughly halfway between two key Fibonacci retracement levels — a location that commonly precedes a corrective bounce rather than a full trend reversal. Trend Strength sits just above zero, suggesting a fragile bullish bias rather than conviction.
Viewed on a slightly wider timeframe, BNBUSDT is grinding inside a shallow range that resembles a consolidation brick; the path of least resistance still leans toward the upside provided the short-term structure holds. Conventionally, the presence of consecutive indecisive candles on increased volume near mid-Fibonacci territory combined with a mildly positive momentum indicator favors a corrective rebound rather than an extended sell-off.
Key short-term levels to monitor on the way up are the 38.2% Fibonacci retracement as the likeliest target for the initial bounce, with a secondary cap at the 50% retracement if buyers show enough follow-through. Beyond those, a return toward prior highs remains plausible, though that area will present a zone of elevated resistance and will need clear volume-backed breakout confirmation to be trusted.
RSI and other momentum readings are consistent with a measured recovery rather than an impulsive surge, so expect the move to unfold over the coming 2–3 weeks. If the market fails to sustain above the 38.2% level and momentum turns down, the alternate scenario would be a continuation of the consolidation or a deeper retracement toward the lower Fibonacci boundary.
Short summary:
Setup : consolidation with two white spinning-top candles, heavier volume locally, price midway between two Fibonacci levels, Trend Strength slightly > 0.
Base case : corrective bounce to 38.2% (primary) — up to 50% (maximum) — then continuation higher toward prior highs (resistance zone).
Timeframe : ~2–3 weeks.

BNB - NEW ATH !!!! 🚨 BREAKING: #BNB HITS NEW ALL-TIME HIGH! 💥
REAL FOMO IS KICKING IN!
Is $1,000 the next stop? 🚀
Levels to watch:
$875 - $900
$950 - $960
1000$

BNB/USDT: Bullish Momentum Sustains Within Upward ChannelThe BNB/USDT market continues to trade within a strong ascending channel, having rebounded from the 865 support zone, which reaffirmed bullish momentum. The price action displays a clear pattern of higher lows and a steady rise along the upward trendline, signaling firm buyer control.
Currently, the price is aiming for the 932 level, with a possible extension toward the 970 resistance zone if momentum remains intact. While a mid-channel rejection could lead to short-term consolidation, the overall structure supports the likelihood of a continuation rather than a reversal.
As long as the channel holds, the bulls are well-positioned to challenge the overhead resistance zones, keeping the uptrend scenario firmly in play.

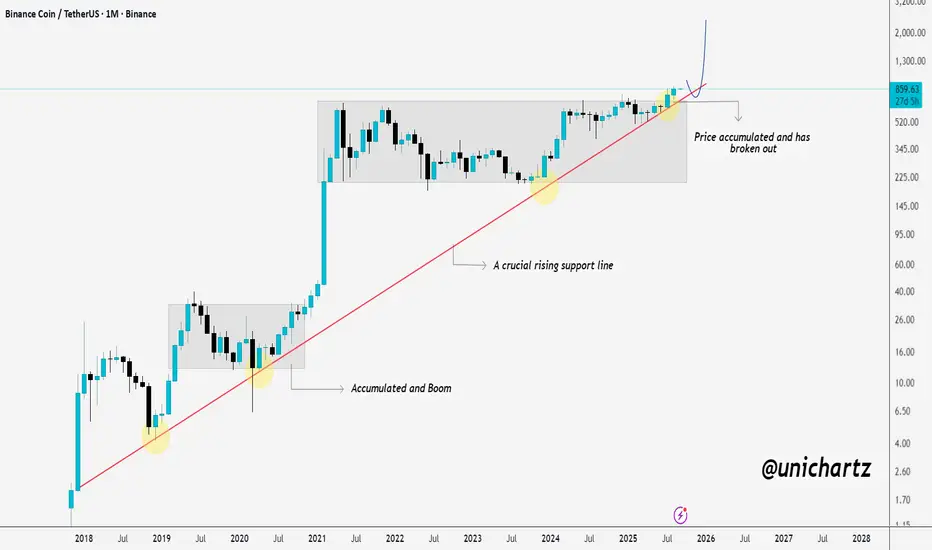
$BNB could move 80% from here - the key levels to watch BNB/USDT Monthly Analysis
CRYPTOCAP:BNB has been respecting a strong rising support line since 2018, showing consistent strength over the long term.
Each time BNB consolidated near this trendline, it accumulated and then rallied hard, marking key breakout points in previous cycles.
Right now, price has accumulated again and broken out, signaling a potential continuation to the upside. If momentum sustains, the next targets could push toward $1,200–$1,500 and beyond in the coming months.
The rising trendline remains a crucial support, holding above it keeps the macro bullish structure intact.
DYOR, NFA
Thanks for checking this out.
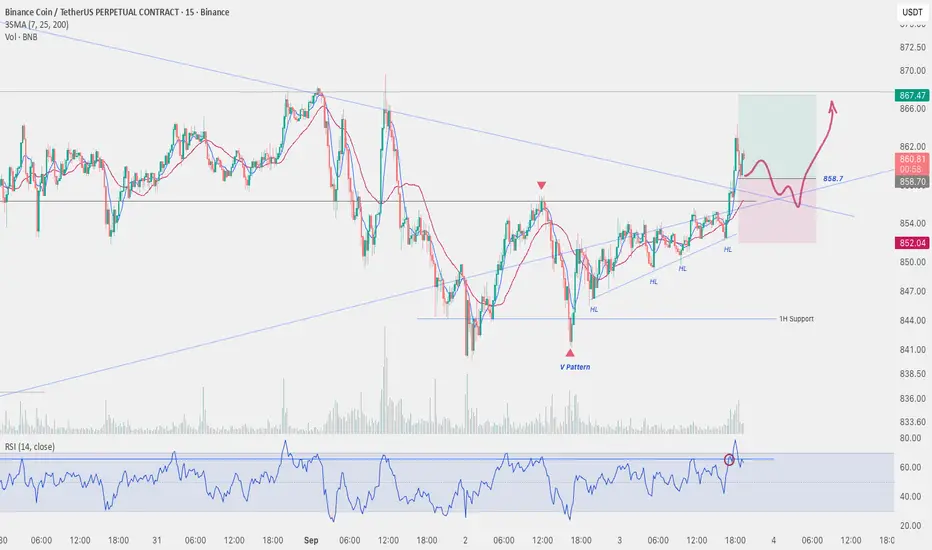
Sep 3, 2025 - BNBUSDT Long Position ReviewFor my last position today, I opened a long trade on BNB . After the price touched and reacted to the daily ascending trendline, I set my entry trigger above the first 1H resistance at 856 . Similar to other coins, the V-pattern that formed before the breakout gave me additional confidence in the bullish move.
Once the strong 1H candle closed above resistance, I placed a buy stop order above its wick at 858.7 for extra confirmation, which eventually triggered my entry.
I must admit, this trade was a bit emotional — it would have been better to wait for a confirmed medium wave cycle bullish structure before entering. On top of that, the BNB/BTC chart doesn’t look very bullish, which suggests I might have found a better setup on other coins. The main reason I rushed was the opportunity to use relatively high leverage on this setup.
📌 Stop-Loss Strategy
The main strength of this trade is the well-positioned stop-loss. Even if price decides to retest the broken descending trendline with a pullback, my stop would not be triggered prematurely.
⚠️ Overall, this is a risky position that is currently open. If I notice weakening bullish signals, I’ll likely exit early.
BNBUSDT Highwave-Cycle on 4H Timeframe:
BNB/BTC Chart:
Binance Coin (BNB): Looking For 100EMA Breakout | Bullish CMEBNB is consolidating under the 100EMA, and for now, we keep waiting for a proper breakout above that level. If buyers manage to push through, we’ll have a clean entry setup that could lead us to fill the bullish CME gap higher up.
Until that happens, patience is key — the 100EMA remains the line to watch.
Swallow Academy

BNB is showing DiverganceBNB is showing a divergance between the bullish price and the bearish stochastic oscillator.
in addition the volume is falling.
I wish best of luck to you
MarketsTitan

BNBAnyway, whether sooner or later, the price will eventually break out of this box, and this is while gold has surpassed an astonishing price, and Bitcoin and Ethereum have also experienced even higher prices. Logically, we should expect better prices for altcoins. As for the price of Binance Coin, it depends on the market conditions, but if I had to give a figure, my estimate would be something close to $2000.

Bnb pump to $861 tonight Just recently opened a scalp long on bnb. Called it in the chat
Still good enough for 1-2RR from current entry
Sl: 847.43
Tp: 861
Potential early close at $857.08

bnb pump back to $873.41855.7 sl for bybit
856.41 sl for mexc
Tp1:868
tp 2: $873.41
Market likely to push back up tonight based on my analysis. Bulls are taking back control

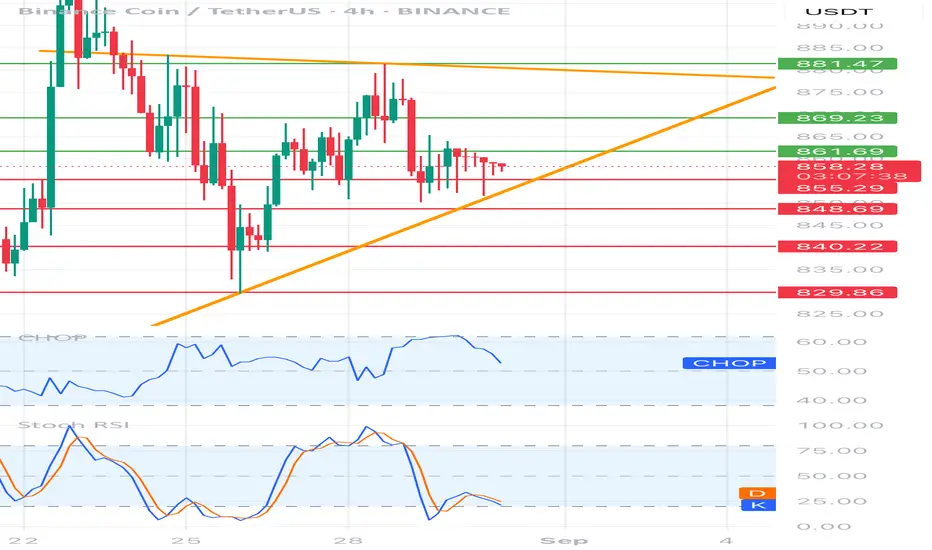
BNBUSDT 4H Chart 1. Price structure
• Current price: ~ 858 USDT
• The price moves in the clinic in a lowering (yellow lines). Upper inheritance trend (~ 881) + lower growth line (~ 848).
• We see consolidation - the market is "squeezed" between supports and resistance.
2. Horizers of support and resistance
• Support:
• 855 (local, this is where the price stopped)
• 848 (Important - lower wedge + demand level)
• 840 and 829 (key with a larger decline).
• resistance:
• 861 (first test, short -term)
• 869 (stronger resistance, earlier reflections)
• 881 (upper wedge line, strategic resistance).
3. Oscillators
• RSI (Chop) - around 50, i.e. neutral → no clear advantage of bulls/bears.
• STOCHASTIC RSI - is located at the bottom of the zone (approx. 20-25), which suggests the possibility of reflecting up (bull signal, but only after the candle confirmation).
4. Scenarios
Bullish (reflection up):
• If the price persists over 855–848 → possible reflection to 861 and 869.
• Breaking above 869 → opens the road to 881 (Test of the upper line of Klina).
• Only closure of the 4h candle above 881 → a signal of a kick from the wedge and a stronger upward movement.
Bearish (continuation of the inheritance):
• If the price drops below 848 and closes the candle at this level → strong inheritance signal, tarpapers: 840 and 829.
• 829 is key support - its bursting down can deepen the declines.
⸻
📊 Summary
BNB is now in the Departing Clinic, in the uncertainty zone:
• Maintenance 848–855 = chance of reflection.
• Punction down 848 = signal to a stronger decrease.
• Only breaking above 881 = signal of stronger growth movement.
BNB - LONG SET-UPBINANCE:BNBUSDT
bnb Looking good to long between 770 -- 790
SL Below 740 (Accordingly)
Lev & Margin as per your risk capacity
