BOMEUSDT Forming Bullish PennantBOMEUSDT is currently shaping a bullish pennant pattern, which typically indicates a period of consolidation before the next strong upward move. This pattern, combined with rising trading volume, highlights growing momentum and increased interest from market participants. If confirmed, this setup co
No news here
Looks like there's nothing to report right now

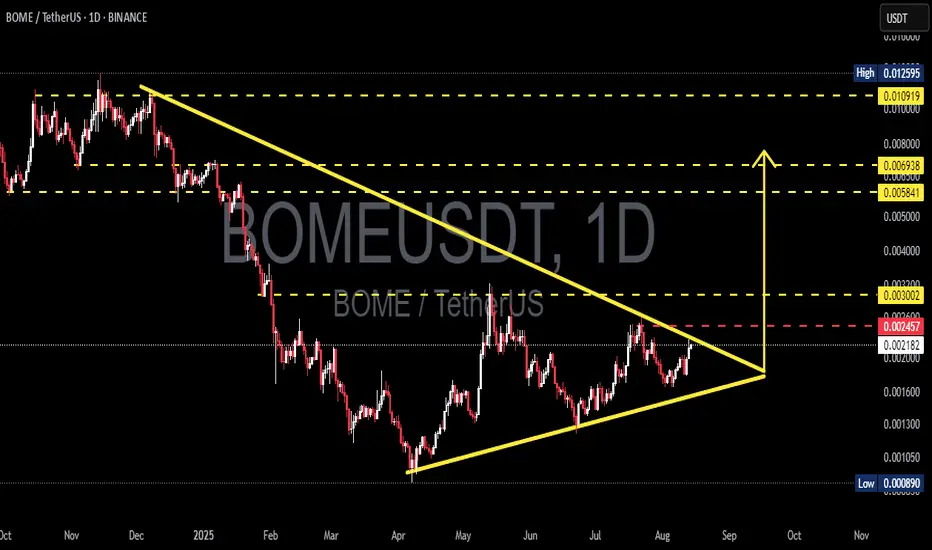
BOME/USDT — Symmetrical Triangle on the Verge of a Explosion?BOME/USDT has spent the past several months moving inside a Symmetrical Triangle pattern, formed by a series of lower highs from the peak around 0.0125 and higher lows from the April 2025 bottom at 0.000890.
This formation signals a major consolidation phase where buying and selling pressure are con

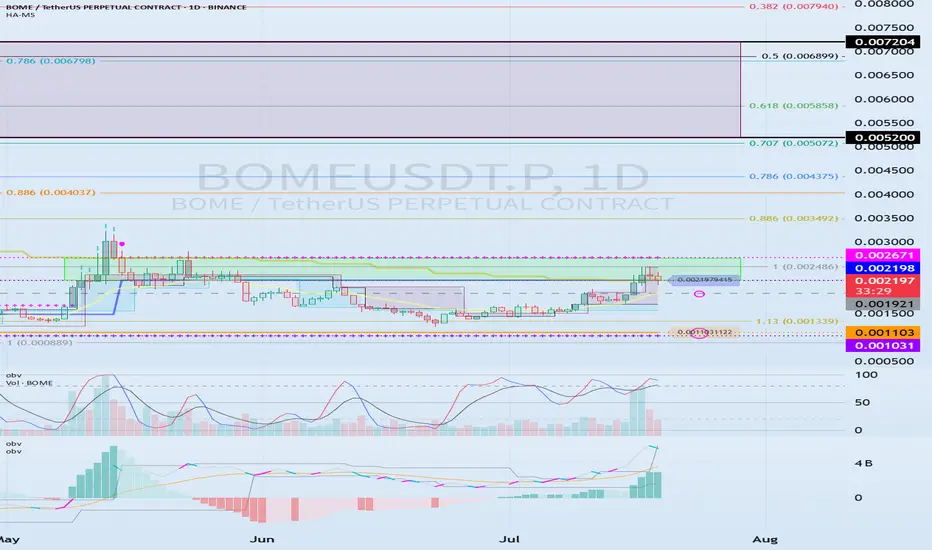
0.002198-0.002671 The key is whether it can break above
Hello, traders.
If you "Follow", you can always get new information quickly.
Have a nice day today.
-------------------------------------
(BOMEUSDT.P 1D chart)
BOME is a BOOK OF MEME, which is a meme coin and belongs to the Solana Ecosystem.
If the price breaks through the 0.002198-0.002671 se
BOMEUSDT 12H#BOME — Bullish Setup in Play! 📈
#BOME is moving inside a Falling Wedge pattern on the 12H chart — a classic bullish reversal signal.
A breakout above the wedge resistance and the 12H MA100 could ignite strong upside momentum. Potential targets after breakout:
🎯 $0.002091
🎯 $0.002373
🎯 $0.002601
🎯

BOMEUSDT UPDATE
Pattern: Falling Wedge Breakout
Current Price: \$0.001880
Target Price: \$0.003560
Target % Gain: 90.91%
Technical Analysis: BOME has broken out of a falling wedge pattern on the 12H chart. A bullish breakout is confirmed with a close above resistance and continued higher lows.
Time Frame: 12H
R

Bomeusdt Buy opporutnityBOMEUSDT continues to trade within a clear descending structure, recently bouncing from a major low and now approaching a critical decision zone.
The price reclaimed the $0.001874 buy zone after a sharp recovery and is currently forming a minor bullish channel. If this structure holds, the next bu

Go go BOME!!📢Price action is quite good. now standing on the yellow support line. potential to go to the white line resistance target, supported by divergence and small double bottom. I think this is a good time to take a long position📈.
⚠️Be careful if the price breakdowns the yellow line support because the

See all ideas
Summarizing what the indicators are suggesting.
Oscillators
Neutral
SellBuy
Strong sellStrong buy
Strong sellSellNeutralBuyStrong buy
Oscillators
Neutral
SellBuy
Strong sellStrong buy
Strong sellSellNeutralBuyStrong buy
Summary
Neutral
SellBuy
Strong sellStrong buy
Strong sellSellNeutralBuyStrong buy
Summary
Neutral
SellBuy
Strong sellStrong buy
Strong sellSellNeutralBuyStrong buy
Summary
Neutral
SellBuy
Strong sellStrong buy
Strong sellSellNeutralBuyStrong buy
Moving Averages
Neutral
SellBuy
Strong sellStrong buy
Strong sellSellNeutralBuyStrong buy
Moving Averages
Neutral
SellBuy
Strong sellStrong buy
Strong sellSellNeutralBuyStrong buy
Displays a symbol's price movements over previous years to identify recurring trends.