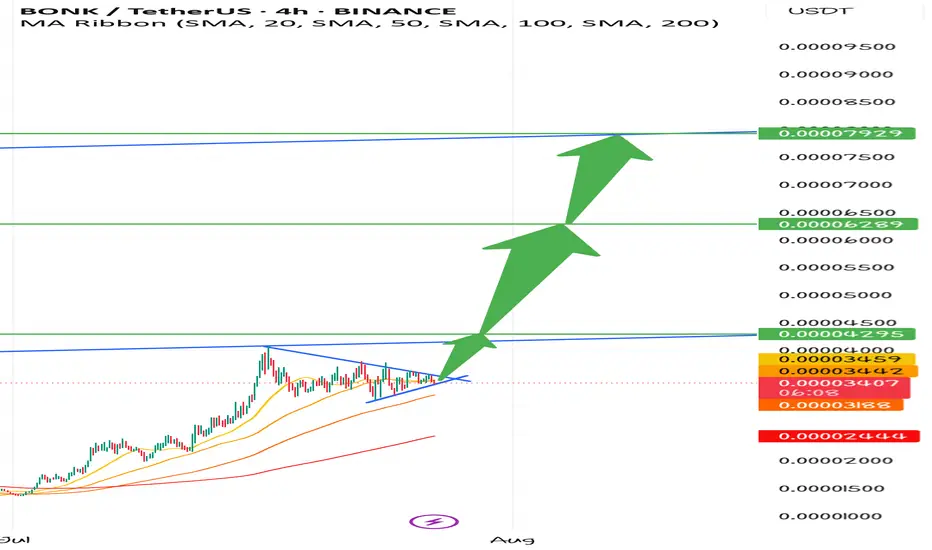
Bonkusdt Long Positionnice flag!
this is financial advise
buy it now for 300 percent profit in 2 weeks
buy now or cry later
targets are shown in green
BONKUSDT trade ideas
BONKUSDT – Let the Market Come to YouIn a possible Q3 correction, BONKUSDT may retest the green box zones below.
These areas are not predictions — they’re prepared zones where I’ll be waiting, not chasing.
🟩 I don’t buy strength blindly. I buy value with structure.
All risk-on markets typically experience significant corrections in the third quarter of the year and struggle to recover from this correction until the end of the year.
🎯 My Strategy
🔔 Set alerts for the green boxes
🕐 Switch to the 1-hour timeframe when triggered
📈 Wait for upward breakout + positive CDV
🎯 Only then: take the shot — one bullet, risk-managed
“Markets reward those who wait with a plan, not those who rush with emotion.”
Let’s stay patient, structured, and consistent.
— UmutTrades 💙
📌I keep my charts clean and simple because I believe clarity leads to better decisions.
📌My approach is built on years of experience and a solid track record. I don’t claim to know it all but I’m confident in my ability to spot high-probability setups.
📌If you would like to learn how to use the heatmap, cumulative volume delta and volume footprint techniques that I use below to determine very accurate demand regions, you can send me a private message. I help anyone who wants it completely free of charge.
🔑I have a long list of my proven technique below:
🎯 ZENUSDT.P: Patience & Profitability | %230 Reaction from the Sniper Entry
🐶 DOGEUSDT.P: Next Move
🎨 RENDERUSDT.P: Opportunity of the Month
💎 ETHUSDT.P: Where to Retrace
🟢 BNBUSDT.P: Potential Surge
📊 BTC Dominance: Reaction Zone
🌊 WAVESUSDT.P: Demand Zone Potential
🟣 UNIUSDT.P: Long-Term Trade
🔵 XRPUSDT.P: Entry Zones
🔗 LINKUSDT.P: Follow The River
📈 BTCUSDT.P: Two Key Demand Zones
🟩 POLUSDT: Bullish Momentum
🌟 PENDLEUSDT.P: Where Opportunity Meets Precision
🔥 BTCUSDT.P: Liquidation of Highly Leveraged Longs
🌊 SOLUSDT.P: SOL's Dip - Your Opportunity
🐸 1000PEPEUSDT.P: Prime Bounce Zone Unlocked
🚀 ETHUSDT.P: Set to Explode - Don't Miss This Game Changer
🤖 IQUSDT: Smart Plan
⚡️ PONDUSDT: A Trade Not Taken Is Better Than a Losing One
💼 STMXUSDT: 2 Buying Areas
🐢 TURBOUSDT: Buy Zones and Buyer Presence
🌍 ICPUSDT.P: Massive Upside Potential | Check the Trade Update For Seeing Results
🟠 IDEXUSDT: Spot Buy Area | %26 Profit if You Trade with MSB
📌 USUALUSDT: Buyers Are Active + %70 Profit in Total
🌟 FORTHUSDT: Sniper Entry +%26 Reaction
🐳 QKCUSDT: Sniper Entry +%57 Reaction
📊 BTC.D: Retest of Key Area Highly Likely
📊 XNOUSDT %80 Reaction with a Simple Blue Box!
📊 BELUSDT Amazing %120 Reaction!
📊 Simple Red Box, Extraordinary Results
📊 TIAUSDT | Still No Buyers—Maintaining a Bearish Outlook
📊 OGNUSDT | One of Today’s Highest Volume Gainers – +32.44%
📊 TRXUSDT - I Do My Thing Again
📊 FLOKIUSDT - +%100 From Blue Box!
📊 SFP/USDT - Perfect Entry %80 Profit!
📊 AAVEUSDT - WE DID IT AGAIN!
I stopped adding to the list because it's kinda tiring to add 5-10 charts in every move but you can check my profile and see that it goes on..

BONKUSDT 6H#BONK has formed a descending triangle pattern on the 6H chart. This setup often suggests a potential breakout — typically to the downside, but fakeouts or bullish breaks can occur, especially in strong markets or during volume spikes.
If the price can hold above the EMA50 and attract strong volume, a bullish breakout becomes more likely. In that case, the targets are:
🎯 $0.00003726
🎯 $0.00003920
🎯 $0.00004113
🎯 $0.00004389
🎯 $0.00004741
If a breakdown occurs instead, the potential downside targets are:
🔻 $0.00002969
🔻 $0.00002784
🔻 $0.00002541
⚠️ As always, use a tight stop-loss and apply proper risk management.

Boink - I Bonk You!I bonk you!!!! Don't you think buying here aint good? But selling here might be? Or just dont get too bulish with bonk

BONK : Best of luck to you...Hello friends🙌
👀Considering the decline we had, you can see that the price was supported by buyers and broke the specified resistance. Now, in the price correction, there is a good opportunity to buy with risk and capital management and in steps and be patient until the specified targets are reached.
🔥Follow us for more signals🔥
*Trade safely with us*

BONK Setup – Watching for Retracement After 200%+ RallyBONK has surged over 200% in recent weeks. We're now eyeing a retracement to a key support zone that could offer a prime entry for the next leg higher.
📌 Trade Setup:
• Entry Zone: $0.00002240 – $0.00002500
• Take Profit Targets:
o 🥇 $0.00004050 – $0.00004800
o 🥈 $0.00005500 – $0.00006500
• Stop Loss: Just below $0.00002000

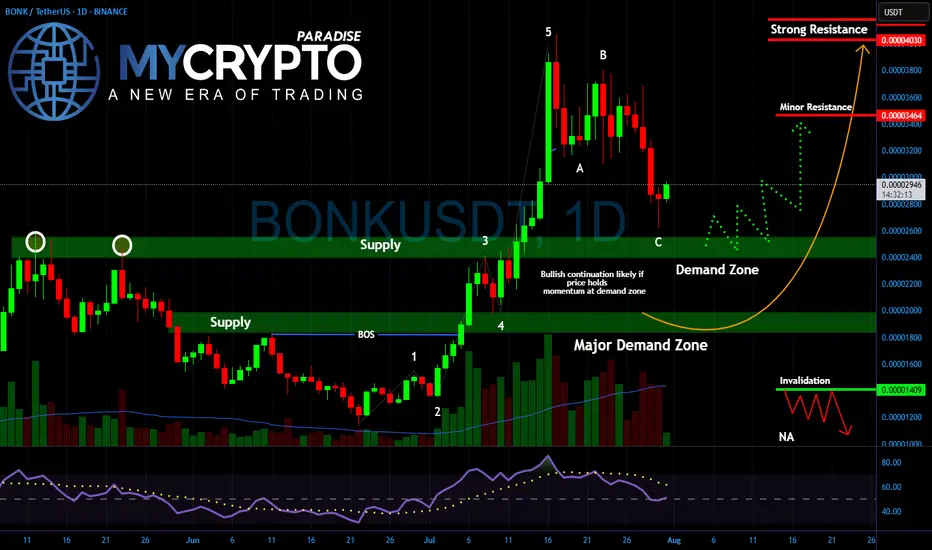
BONK About to Break Out or Break Down?Yello Paradisers! Are you ready for the next explosive move in #BONK? After nailing the last rally and spotting the impulsive 5-wave structure early, we’re now entering a critical phase — and what happens next could decide whether BONK flies or collapses.
💎The recent pullback has followed a clean A-B-C corrective structure, landing perfectly into the key demand zone between 0.00002600 and 0.00002200. This zone now acts as the battlefield between smart money buyers and weak-handed sellers. Price action is slowing down, volume is drying up, and RSI is resetting all classic signs of a potential bullish continuation. But if buyers fail to step in with conviction, the market could easily sweep lower to test the major demand zone closer to 0.00001800.
💎As long as price holds this area and confirms a reversal with follow-through momentum, we could see #BONK heading back toward 0.00003460 as the first stop, and possibly a retest of the 0.00004030 resistance. However, if price closes below 0.00001409, that would invalidate the bullish setup and confirm a deeper corrective phase.
Patience and strategy win the game, Paradisers! The market is designed to shake out weak hands before the real move happens.
MyCryptoParadise
iFeel the success🌴
Bonk short to $0.02585Opened a short position on bonk just now. Aiming for 0.02585
Sl: $0.028185 or higher
Roughly 2RR
DTT strategy used - Learn more on X

BONK | Waiting for DemandNo position yet—alerts are set for the FVG and HTF demand zone below. DOGE/BONK still showing relative strength, so patience here is warranted.
Plan:
Wait for price to tag HTF area of interest (FVG/demand).
Look for LTF trigger for a long entry.
Prefer clean sweep/reclaim for confirmation.
Reasoning:
BONK has strong momentum, but entry here is late after an extended run.
Letting the setup come to me reduces risk of getting caught in a local top.
DOGE/BONK relative strength signals not to rush.

BONKUSDT - Climb Back to .00004The weekly MACD hasn't been drawn yet so there's likely more impact by the daily MACD on the price point.
BONK has seen .00004 as a high, so it's possible there's shorts waiting to get rekt at the top.
Expecting a slow climb back towards .00004.
Take note of the rising stochastic and MACD.
Long/shorts ratio has taken a standstill at .000012 to .000014 indicating there's a supply level there.
If it does fall to .000012 I would pick up more.
A great 2-3X hold.

Bonk long to $0.029712just now opened up a long position on bonk. Market seems to be flipping back bullish on lower tf to continue up.
Sl: $0.028245
Time sensitive

BONK Breakout Incoming: 26 Percent Upside Target at 0.000044Hello✌
Let’s analyze BONK’s upcoming price potential 📈.
BINANCE:BONKUSDT has demonstrated notable strength in recent sessions, supported by elevated volume 📈. Price action is currently testing a daily support area near the trendline, which aligns with a key Fibonacci retracement level. A confirmed breakout above the psychological resistance at 0.000040 could open the path toward the 0.000044 target, offering an estimated 26% upside potential 🚀.
✨We put love into every post!
Your support inspires us 💛 Drop a comment we’d love to hear from you! Thanks , Mad Whale

$BONK BIG Trade setupCRYPTOCAP:BONK BIG Trade setup: Price had a bullish breakout from Channel Down pattern and has rallied to $0.000036 resistance for +140% gain. It also broke above 200 SMA, which signals resumption of Uptrend. If it breaks above that $0.000036 resistance, it could revisit $0.000050 next.

Bonk (1w) Sinusoidal trendBONK/USDT (1W)
BONK is showing a strong bounce from long-term support! 🚀
After touching the strong weekly support zone around 0.00000947, BONK surged with significant volume, breaking out of the descending mini-channel. The price is now approaching the 0.00005054 resistance level, which previously acted as a rejection point.
📊 Key Points:
• Support:
🔻 0.00000947 – major long-term support
• Resistance:
🔺 0.00005054 – key resistance and potential breakout target
• RSI (14):
RSI is sharply rising and crossing above its moving average, suggesting bullish momentum building up.
• Volume:
A strong volume spike confirms increased buying interest from the bottom.
⸻
🔍 Outlook:
As long as BONK holds above 0.00002, bulls have a good chance to push toward 0.00005. A breakout above this level could lead to a strong rally. Watch for RSI overbought conditions in the coming weeks.
⸻
#BONK #BONKUSDT #Crypto #Altcoins #TradingView #TechnicalAnalysis #MemeCoins #Bullish

Bonk-ing your head?Yeah please bonk more cuz its BONK TIME, small scalps to the tops thats all u need to do!
#BONK/USDT About to Break Out !#BONK
The price is moving within a descending channel on the 1-hour frame and is expected to break and continue upward.
We have a trend to stabilize above the 100 moving average once again.
We have a downtrend on the RSI indicator that supports the upward break.
We have a support area at the lower boundary of the channel at 0.00002440, acting as a strong support from which the price can rebound.
We have a major support area in green that pushed the price upward at 0.00002372.
Entry price: 0.00002552.
First target: 0.00002694.
Second target: 0.00002882.
Third target: 0.00003118.
To manage risk, don't forget stop loss and capital management.
When you reach the first target, save some profits and then change the stop order to an entry order.
For inquiries, please comment.
Thank you.

BONKUSDT 1D Chart Analysis | Bullish Momentum is coming...BONKUSDT 1D Chart Analysis | Bullish Momentum Builds After 0.236 Fibo Pullback
🔍 Let’s break down the BONK/USDT daily chart, focusing on the latest price action, strategic moving averages, RSI convergence, and volume dynamics for a complete bullish scenario setup.
⏳ Daily Overview
BONK is showing strong upward momentum, printing consecutive higher highs (HH) in both candles and RSI—a clear bullish trend indicator. After an explosive move, price is currently staging a healthy pullback to the key 0.236 Fibonacci retracement level (0.00003142), which commonly acts as a support platform during aggressive uptrends.
📈 Technical Convergence and Trend Structure
- 3SMA Support: The 7, 25, and 99 SMAs are all trending upward and stacked correctly, with price sitting comfortably above them. The 7SMA acts as immediate dynamic support, reflecting trend strength and buyer interest at every dip.
- RSI Dynamics: RSI just bounced from the 69–70 zone, confirming convergence with price action. The indicator made its own higher high in tandem with the candles, and now, as price pulls back, RSI is reentering the overbought territory—which often precedes renewed momentum.
- Volume Confirmation: Notably, volume surged as the trend accelerated, and is now tapering off during this corrective phase. This is a classic bullish volume signature, showing profit-taking by early longs but no major selling pressure, suggesting trend continuation likely after consolidation.
🔺 Bullish Setup & Targets
- First target: 0.00005376 — retest of the last all-time high (ATH).
- Next resistance to watch: 0.00003920, followed by the ATH region.
- Long-term target: 0.00009710 — an upside of 170–180% from current levels, mapped by technical extension and price discovery zones.
📊 Key Highlights
- Price holding the 0.236 Fibo retracement signals a shallow, healthy correction.
- 3SMA alignment confirms long-term bullish bias—actively supporting every dip.
- RSI and price are convergent, reaffirming uptrend strength; RSI’s move back into overbought could ignite the next price surge.
- Volume decreasing on corrections and rising during rallies—bullish confirmation.
🚨 Conclusion
BONK/USDT remains technically poised for further upside. The blend of higher highs, support at the 0.236 Fibonacci retracement, positive 3SMA structure, and RSI convergence all point to bullish continuation. Watch for renewed momentum as RSI reenters overbought territory and volume confirms the next breakout. Next targets: 0.00005376 (ATH), with a long-term projection toward 0.00009710.

Is Bonk ready for a 23% breakout toward 0.000030?Hello✌
let’s dive into a full analysis of the upcoming price potential for Bonk📈.
BINANCE:BONKUSDT has recently broken through multiple daily resistance levels in a sharp upward move 🚀, resembling a strong breakout rally. The price is now pulling back toward a key daily support area, which also aligns with the 0.38 Fibonacci retracement level. If this support holds, I’m eyeing a potential 23% upside, with a final target set at 0.000030. 📈
✨ Need a little love!
We pour love into every post your support keeps us inspired! 💛 Don’t be shy, we’d love to hear from you on comments. Big thanks , Mad Whale 🐋

BONKUSDT: The Meme Coin Ready to Bounce! 📊 Key Stats (Live Update)
- Current Price: $0.000022
- Volume: $1.33M (Accumulation phase)
📈 Critical Levels
- Strong Support: $0.0000192
- Immediate Resistance: $0.000027
- Breakout Target: $0.00004 (+85% upside)
🔥 Why BONK Could Moon
1. Extreme Discount: 92% below ATH ($0.00003275)
2. Meme Coin Rally: WIF +12% today showing sector strength
3. Technical Setup: Bullish divergence forming
🎯 Trading Plan (Updated)
- Ideal Entry: $0.000019-$0.000020 zone 🚀
- Scalp Targets:
→ $0.000025 (+13.2%)
→ $0.000027 (+22.2%)
- Swing Targets:
→ $0.000028 (+40%)
→ $0.000035 (+75%)
- Risk Management:
→ Stop Loss: $0.000018
→ Position Size: 1-3% of portfolio
⚠️ Crucial Notes
1. High volatility expected - set alerts
2. Watch BTC dominance for market direction
3. Smaller exchanges may have price discrepancies
📌 Unique Opportunity
At current levels, BONK offers one of the highest risk/reward ratios in meme coins with:
- 80%+ upside potential to ATH
- Limited downside to strong support
🔍 Live Metrics to Watch
1. 4H RSI: 52 (neutral)
2. Volume Spike: $2M+ needed for breakout
3. Exchange inflows/outflows
---
NOT FINANCE ADVICE | DYOR always 💡 Visual Enhancements
Ready for the BONK resurgence? Would you like me to adjust the entry strategy for more conservative traders? 🐶

BONKUSDT: Bullish Setup Brewing! Are You In?#BONK is flashing strong bullish signals on the 1D timeframe:
Double Bottom Pattern – A textbook reversal signal
Break & Retest of Key Resistance – Now acting as solid support
Price at CMP (Current Market Price) – In the ideal buy zone
This confluence of signals suggests momentum is shifting in favor of the bulls. If volume kicks in, we could see a sharp breakout toward the next resistance levels.
Trade Plan:
Entry: CMP
SL: 0.00000886
Target 1: 0.00002607
Target 2: 0.00003989
Always use proper risk management!
What’s your view on #BONK? Bullish or Bearish?
Drop your thoughts in the comments and let's discuss!
Don’t forget to like and follow for more setups!
#BONK #Crypto #Altcoins #TechnicalAnalysis #Breakout #DoubleBottom #TradingView

Bonk Price is up 30%The price of CRYPTOCAP:BONK Coin has reached double its demand, where lies the resistance – Major Change of Character.
Read more here:
www.cointrust.com

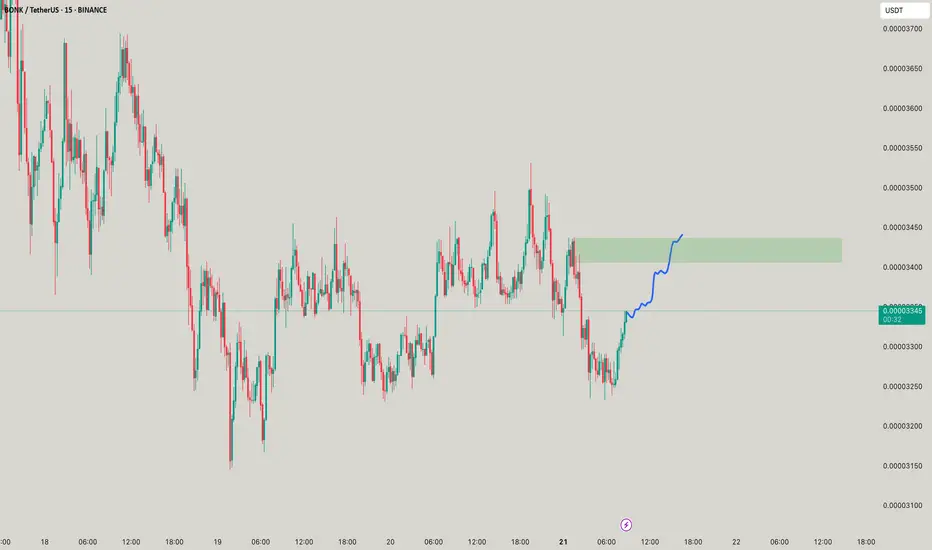
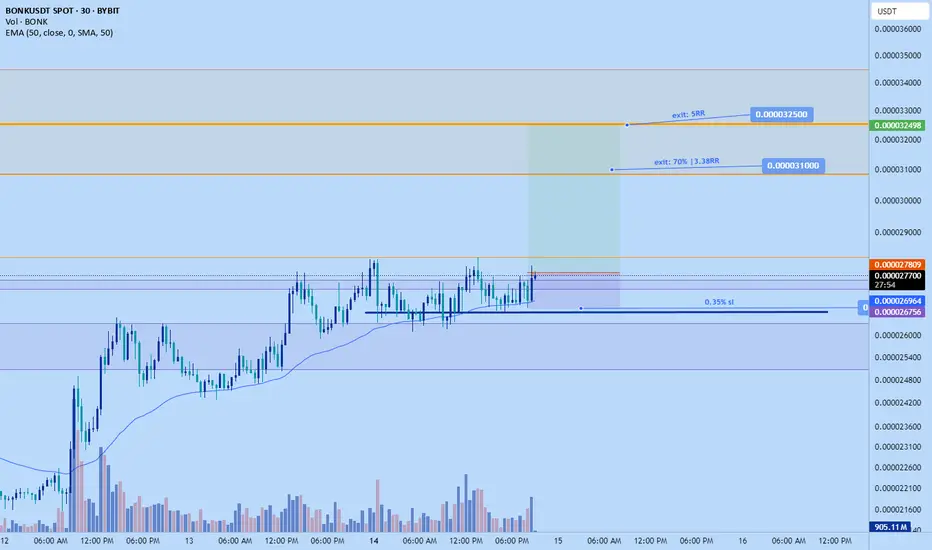
Bonk long to $0.0000325Just now hopped into a long position on bonk. Aiming for $0.0000325. However looking to scale out 70% around $0.000031.
Breakout likely to happen soon, maybe next hr based on my DTT analysis
Stop: $0.000026756 or lower
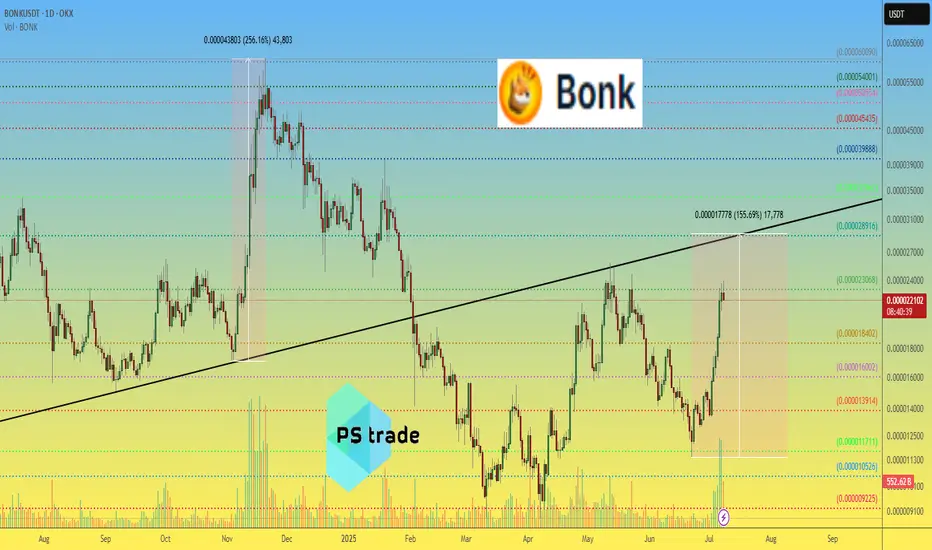
BONK price analysis “Someone” decide to revive the price of CRYPTOCAP:BONK , or are there fundamental reasons for this? (Please share your thoughts in the comments.)
📈 However, the last time there was such a powerful surge in trading volume on the OKX:BONKUSDT chart, the price managed to gain +256% in just over two weeks.
❓ Do you think that the price of #Bonk , in the current wave of growth, will manage to rise by at least +156% and reach the mark of $0.0000290, and the capitalization of the memecoin project will grow from the current $1.75 billion to $2.25 billion?
_____________________
Did you like our analysis? Leave a comment, like, and follow to get more