bonkLet it go back to the green box, be reviewed for purchase, it has some long-term goals, but it will take time and we will have to see how the market conditions turn out.
BONKUSDT trade ideas

Analyze the next movement of the BONK currency based on past marThis currency seems to have completed its corrective movement within a long-term upward structure and is currently registering the next upward leg. As you can see in the image, the price has confirmed the beginning of the upward wave after breaking the white line on the daily timeframe. This is simply my analysis of this currency that I wanted to share with you.

bonkusdt long ???Will this cycle happen again?
Pay attention to the price movement and RSI, as well as the way the price pulls back to the Ichimoku cloud, followed by a drop and then a breakout above the cloud.
It might happen again—and we could see a strong upward move.

BONKUSDT 1D#BONK has broken above the falling wedge pattern and the SMA100 on the daily chart. The structure looks very promising. Here we go:
🎯 $0.00002585
🎯 $0.00003004
🎯 $0.00003342
🎯 $0.00003680
Mid-term targets:
🎯 $0.00004162
🎯 $0.00004776
🎯 $0.00005556
🎯 $0.00005963
🎯 $0.00006548
⚠️ Always remember to use a tight stop-loss and follow proper risk management.

Bonk MetaCurrently not many top coins on bonk.fun ecosystem.
Once Bonk start pumping with a full blown ALT Season. These tiny coins will ride the Bonk ecosystem wave. Here are some of the top coins on bonk.fun launch pad.
1) Useless Coin (designed to satirize conventional utility-focused cryptocurrencies) - 160 Million Market cap (Currently 10 - 12% of Bonk Market cap)
2) Hosico (a small orange cat) - 11 Million Market cap
3) Momo (female Shibu Inu) - 3.2 Million Market cap
Bought a small bag of the above 3 coins. This is definitely no financial advice. Meme coins are for Degen's only, but that said. SEED_DONKEYDAN_MARKET_CAP:BONK is obviously a stand out winner this cycle. Currently rankings below,
1) Dogecoin - 33 Billion market cap
2) Shiba Inu - 7 Billion market cap
3) Pepe - 4 Billion Market cap
4) Pengu - 2 Billion Market cap
5) Trump - 3 Billion Market cap
6) Bonk - 1.8 Billion Market cap
Last cycle Dogecoin went to 73 Billion and Shiba Inu went to 34 Billion. We could see a meme coin with a 100 Billion market cap this cycle peak. And the above top meme coins will do very well.
I do think adding a small bag of a top coin in the Bonk ecosystem will also do well, and will pump more multiples than the main coin.
The Bonk Meta is really strong!
DYOR

BONK | Good EntryBONK presents a compelling bullish setup on the daily timeframe. The chart shows several positive technical developments:
Key Bullish Signals:
Currently trading above key moving averages, indicating momentum shift
Strong bounce from the lower support zone around 0.000017
Volume confirmation supports the breakout move
Entry Strategy:
Current levels offer a good entry opportunity around 0.000024
Alternative entry on any pullback to the green trendline support
Price Targets:
1st Target: 0.000035 (previous resistance zone)
2nd Target: 0.000040+ (upper resistance area marked in red)
Risk Management:
Stop loss below 0.000020 to protect against false breakout
The projected path (pink arrow) suggests potential for significant upside
The technical structure indicates BONK has completed its consolidation phase and could be entering a new bullish cycle.
The risk-to-reward ratio appears favorable for long positions, though traders should manage position sizes appropriately given the volatile nature of meme coins.

BONK/USDT – Demand Zone Retest as Key SupportCurrently, BONK/USDT is once again testing its major demand zone (yellow box), which has acted as a strong battleground between buyers and sellers multiple times since early 2024. This area now serves as the “last line of defense” before the price risks entering a deeper corrective phase.
---
🔑 Key Levels
Main Support (Demand Zone): 0.0000227 – the decisive area.
Bullish Targets (Step-by-step Resistances):
🎯 TP1: 0.0000273
🎯 TP2: 0.0000354
🎯 TP3: 0.0000524
Recent Local High: 0.0000622
---
🐂 Bullish Scenario
As long as price holds and rebounds inside the yellow demand zone, there’s a strong chance of a reversal bounce.
Confirmation comes from a 3D bullish engulfing candle with strong volume.
If BONK breaks above TP1, momentum could extend toward TP2, and eventually TP3, offering more than +130% upside from current levels.
A new higher low structure would start forming, signaling a potential mid-term trend shift back to bullish.
---
🐻 Bearish Scenario
If the 3D candle closes below the yellow demand zone, this support flips into a new resistance.
A breakdown would open the door for BONK to revisit lower support levels from early 2024 consolidation.
Bearish momentum could accelerate as trapped buyers inside the demand zone exit their positions.
---
📌 Technical Pattern & Market Structure
The demand zone has historically acted as a reliable accumulation area, preventing deeper drops.
Repeated sharp rejections at resistance suggest significant supply pressure above.
In short, BONK is now in a “decisive range”: either it starts a new accumulation phase (bullish case) or breaks down into another bearish leg.
---
🎯 Trading Strategy
Conservative Entry: wait for a confirmed 3D bullish close above the demand zone.
Aggressive Entry: scale in within the demand zone, add more if bullish confirmation appears.
Stop Loss: below the demand zone (~10–15% lower).
Take Profit: scale out at TP1 → TP2 → TP3.
Risk Management: never risk more than 1–3% of your capital per trade.
---
📝 Conclusion
BONK is at a critical decision point. If the demand zone holds, there’s strong upside potential with staged targets up to +130%. But if it breaks down, the bearish trend regains dominance, exposing lower support levels.
⚖️ The market’s reaction at this demand zone will define the mid-term direction. Traders should wait for a 3D candle confirmation before committing to larger positions.
#BONK #BONKUSDT #Crypto #CryptoTrading #TechnicalAnalysis #SupportResistance #DemandZone #Breakout #SwingTrading

BONK/USDTBONK/USDT – LPL Setup
If SWEEP of DISCOUNT ARRAY is achieved, look for a potential move higher.
🚩 Invalidation: If the FVG breaks with a clear breakaway candle, this setup is void.


BONK 4H Analysis – Key Triggers Ahead💀 Hey , how's it going ? Come over here — Satoshi got something for you !
⏰ We’re analyzing BONK on the 4-hour timeframe timeframe .
👀 In the 4-hour timeframe of Bank, we can see that Bank had a good descending channel, which with the recent drop reacted to the midline of the channel and then moved towards the top of the channel, and with a strong 4-hour whale candle, it stabilized above its descending channel and is now completing a pullback to its channel in multi-timeframe.
⚙️ The key RSI area is the 59 zone, which if the fluctuation passes this level, Bank can move upwards and have a trend reversal after this corrective wave.
🕯 The heavy and good increase in Bank’s volume at this bottom shows the presence of the market maker, the size of the 4-hour candle with which we broke the channel top also seems whale-like.
📊 The OTHERS.D index and we can see, this index is inside a 4-hour box, with the breakout of the top of this box which is at the 7.9% area, good money enters Bank. The midline of this box is at the 7.74% area, which if lost, our analysis can fail.
🔔 The areas we considered as alarm zones are the midline area and the top area. As long as we are above the midline area, we can open our position with low risk and a big stop, which is almost high-risk. The alarm zone 0.00002357 can be a more reliable area for breakout and taking trades. Keep in mind that the market conditions seem risky and the market is in decision-making mode.
❤️ Disclaimer : This analysis is purely based on my personal opinion and I only trade if the stated triggers are activated .

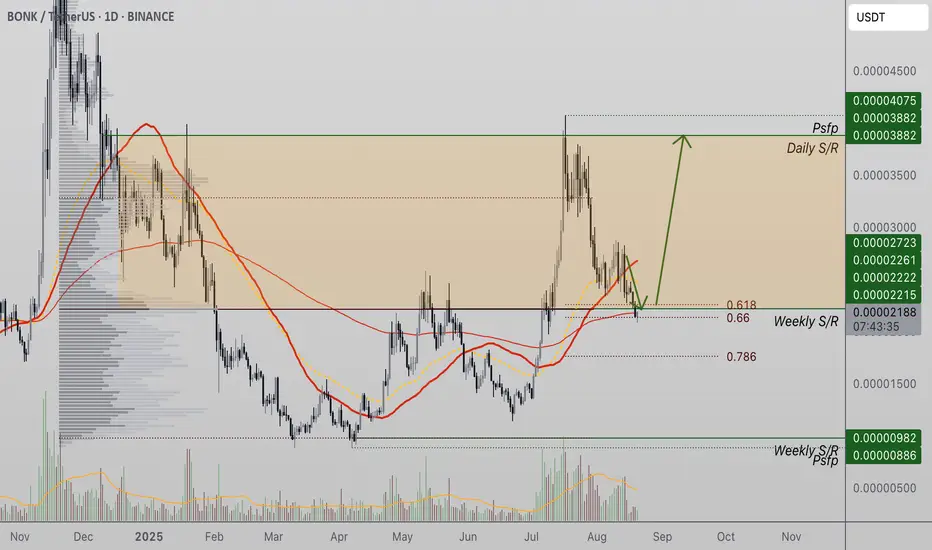
Bonk Tests Golden Pocket Support as Market Eyes ContinuationBonk (BONK) is consolidating at the Golden Pocket Fibonacci retracement, supported by weekly support and the point of control. This confluence zone could spark a bullish rotation if volume inflows sustain.
After a recent retracement, BONK has reached a high-confluence support region that aligns with the Golden Pocket Fibonacci retracement. This area is further reinforced by weekly support and the point of control, creating a structural pivot for price action. The bullish market structure remains intact with higher highs and higher lows, but continuation now depends on whether demand confirms at this level.
Key Technical Points:
- Golden Pocket Confluence: BONK is holding support at the 0.618 Fibonacci retracement, weekly support, and point of control.
- Volume Confirmation Needed: Sustained bullish inflows are required to validate a reversal.
- Upside Target: A rotation could extend to daily resistance and the prior swing high.
Main Analysis:
The Golden Pocket Fibonacci retracement zone has historically been one of the most reliable levels for trend continuation, and BONK’s price action is now testing this area. With weekly support and the point of control also reinforcing this level, the current setup suggests a strong foundation for a reversal. Price action at such zones typically reflects accumulation before a renewed move higher, provided buyers remain active.
The broader market structure continues to favor the bulls. BONK has consistently posted higher highs and higher lows, a clear signal that demand remains present on larger time frames. While the retracement into the Golden Pocket may appear corrective, it has not broken this structural pattern. Instead, it provides an opportunity for bulls to reassert control.
Volume profile data is particularly important at this stage. Early signs of bullish inflows are appearing, hinting that demand is returning to support the structure. For the reversal to be sustained, this momentum must continue, ideally showing consecutive bullish volume candles as price lifts off support. Without such participation, BONK risks stagnation at this zone or even a deeper corrective move. Traders should therefore keep a close eye on volume metrics in the coming sessions.
What to Expect in the Coming Price Action:
If BONK holds the Golden Pocket confluence and volume continues to build, the probability of a rotation higher increases substantially. The next major resistance lies at daily resistance and the prior swing high, where supply will likely emerge. However, if BONK loses this Golden Pocket zone on a closing basis, it would invalidate the bullish scenario and open the door to a deeper correction.

BONK Approaching Key Support – Potential Long Swing Setup
BONK is pulling back and approaching a major support zone, where buyers previously stepped in. With price action slowing down, this could present a low-risk, high-reward swing trade opportunity.
Trade Setup:
🔹 Entry Zone: $0.0000183 – $0.000016
🔹 Take Profit Targets:
🥇 $0.0000226
🥈 $0.000026
🔹 Stop Loss: Close below $0.0000155
#BONK #CryptoTrading #SwingTrade #Altcoins #TechnicalAnalysis

BONK LONG📈 BONK Long Setup (5m timeframe, OKX Perp Swap)
I entered a long position after spotting momentum recovery following a prolonged downtrend. The trade idea is based on:
🔹 Entry: Around 0.000023024 (support zone & EMA retest).
🔹 Stop Loss: Below 0.000022152, protecting against a breakdown of the recent support structure.
🔹 Target (TP): Around 0.000024450 (previous resistance & liquidity zone).
Reasons for Entry:
✅ Trend Shift – Price broke above short-term EMAs after extended downside pressure.
✅ Bullish Divergence – Oscillator shows higher lows while price made lower lows (potential reversal signal).
✅ Volume/Momentum – Momentum indicators in the lower panel are recovering from oversold levels, suggesting buyer strength.
✅ Risk-Reward Ratio – Approximately 1:2.5, making this setup favorable for a scalp/swing attempt.

BONKUSDT 4H✅ BONK/USDT — 4H (Binance) | Aug 21, 2025 — Professional Technical Analysis
🔎 Chart Context
• Pair: BONK/USDT
• Exchange: Binance
• Timeframe: 4H
• Current price: 0.00002198
• Price is in a mid-term downtrend, making lower highs and lower lows after rejection from 0.00002877 and 0.00002826.
📊 Key Observations
1. Market Structure
• BONK peaked at 0.00002877 and 0.00002826, then entered a steady decline.
• The current swing low is 0.00002275, with price attempting a short-term bounce.
• Trend remains bearish until the market reclaims higher supply zones.
2. Support & Demand Zones
• 0.00002339 – 0.00002198: Current support block, where buyers are trying to defend.
• 0.00001900 – 0.00001800: Deeper demand zone; main liquidity magnet if current support fails.
3. Resistance & Supply Zones
• 0.00002411 – 0.00002480: Local supply + fair value gap (FVG), likely to act as rejection zone.
• 0.00002740 – 0.00002877: Strong resistance cluster from last highs.
4. Fair Value Gap (FVG)
• FVG sits above 0.00002480 — price may push into this imbalance before resuming the downtrend.
• This is a typical retracement target before continuation lower.
📈 Bullish Scenario (Short-Term Relief Only)
• Price defends 0.00002275–0.00002198.
• A short-term bounce targets:
• TP1: 0.00002411
• TP2: 0.00002480 (FVG fill)
• For a trend reversal, BONK needs a 4H close above 0.00002550 — otherwise, upside remains corrective only.
📉 Bearish Scenario (Higher Probability)
• BONK rejects from 0.00002411–0.00002480 FVG zone.
• Price resumes decline toward:
• TP1: 0.00002200 (recent low)
• TP2: 0.00001900–0.00001800 (major liquidity target)
• Breakdown below 0.00001800 would open deeper extension into 0.00001650.
⚡ Trading Plan
• Short Setup (Preferred):
• Entry: 0.00002411 – 0.00002480 (FVG rejection)
• TP1: 0.00002200
• TP2: 0.00001900
• Stop: Above 0.00002550
• Long Setup (Countertrend, Risky):
• Entry: 0.00002200 – 0.00002198 (demand defense)
• TP: 0.00002450
• Stop: Below 0.00002150
✅ Conclusion
BONK/USDT on 4H remains in a bearish corrective structure, with the most probable path being a short-term bounce into 0.00002480 FVG, followed by a continuation lower toward 0.00001900–0.00001800 demand zone. Only a reclaim above 0.00002550 would shift momentum back in favor of bulls.

Bonk Holds Key Support at 0.618 Fibonacci and 200 MABonk (BONK) has corrected into a confluence of major supports, including the 0.618 Fibonacci retracement and the 200-day moving average. Holding this zone increases the probability of a full rotation back toward the highs.
Bonk’s price action has entered a corrective phase following its recent bullish expansion, but technical signals suggest the correction may be nearing completion. Price is now consolidating around a critical support area that combines the 0.618 Fibonacci retracement with the 200-day moving average. This dual confluence provides a strong technical foundation for a potential reversal.
The 0.618 Fibonacci retracement, often referred to as the “golden pocket,” is one of the most reliable zones for trend continuation in bullish markets. Assets that respect this level frequently resume their upward trajectory after short-term corrections. In Bonk’s case, the fact that this retracement aligns with the 200-day moving average—an important dynamic level of trend support—further increases the weight of this area.
Key Technical Points:
- 0.618 Fibonacci Retracement: Price is testing the golden pocket, a critical bullish support zone.
- 200-Day Moving Average: Adds dynamic support, reinforcing the importance of this level.
- Bullish Market Structure: Correction remains within the context of higher highs and higher lows.
From a structural perspective, Bonk continues to trade within an overall bullish framework. Despite the pullback, the market has not violated its higher-time frame uptrend. The retest of key technical confluences signals that this is more likely a corrective pause rather than a breakdown. As long as price maintains daily closes above this cluster, the path of least resistance remains to the upside.
Volume behavior will be critical in confirming the next move. If demand continues to appear at current levels and volume inflows remain consistent, it would validate the support and strengthen the case for a rotation higher. A successful defense of this level increases the probability that Bonk will attempt to reclaim prior highs and extend the bullish cycle.
What makes this setup notable is the combination of structural integrity and technical confluence. Few zones carry as much weight as the golden pocket aligned with the 200-day MA, and when respected, these areas often precede strong bullish rotations.
What to Expect in the Coming Price Action
If Bonk sustains above the 0.618 Fibonacci retracement and the 200-day moving average, a reversal is likely to unfold. Such a move would allow price action to rotate back toward the previous highs, continuing the broader bullish trend. The corrective phase should therefore be viewed as a potential launchpad rather than a breakdown, with strong confluences favoring a full recovery in the sessions ahead.
$BONK: my green zones are back. Time to refill our bags.💥 SEED_DONKEYDAN_MARKET_CAP:BONK – The Solana Meme King 💥
SEED_DONKEYDAN_MARKET_CAP:BONK is the Solana meme coin. It was launched when CRYPTOCAP:SOL was at the bottom, and every CRYPTOCAP:SOL whale remembers it. With a strong community of holders, when SEED_DONKEYDAN_MARKET_CAP:BONK pumps, it does it massively. 🚀
🔹 This altseason shouldn’t be different. If SEED_DONKEYDAN_MARKET_CAP:BONK retraces into my green buy zone, it’s a great “refill your bag” setup.
🔹 Meme coins are not long-term holds – buy as low as possible and take profits once RSI overheats.
🔹 Currently, SEED_DONKEYDAN_MARKET_CAP:BONK has retraced ~50% of its last pump. From here, either:
1️⃣ It starts flying now (then it’s too late to buy), or
2️⃣ It retraces fully – which it has done in every past pump cycle.
📊 Like many altcoins, SEED_DONKEYDAN_MARKET_CAP:BONK is in a descending range and recently got rejected. A solid entry often comes when price hits my green zone with RSI bottoming and confirmed by my RSI Divergence indicator (Daily timeframe).
⚠️ Reminder: Meme coins retrace faster and deeper than most alts, but they also pump higher and sharper than expected. Patience is key.
👉 DYOR & trade safe!
#BONK #Solana #Altseason #CryptoTrading #MemeCoins #RSI #TradingView

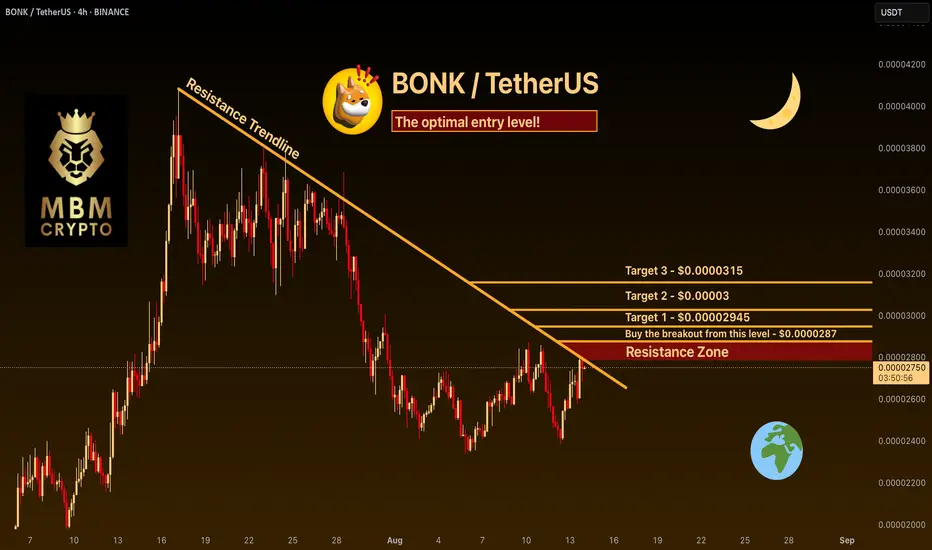
BONK: The optimal entry level! Trading Setup
If you’re considering trading BONK, here’s a quick setup that may help you.
The idea is: Buy when the price breaks above $0.0000287 and take profits at the levels shown in the chart.
Targets:
1. $0.00002945
2. $0.00003
3. $0.0000315
-------------------------------------------
About our trades:
Our success rate is notably high, with 10 out of 11 posted trade setups achieving at least their first target upon a breakout price breach (The most on TW!). Our TradingView page serves as a testament to this claim, and we invite you to verify it!
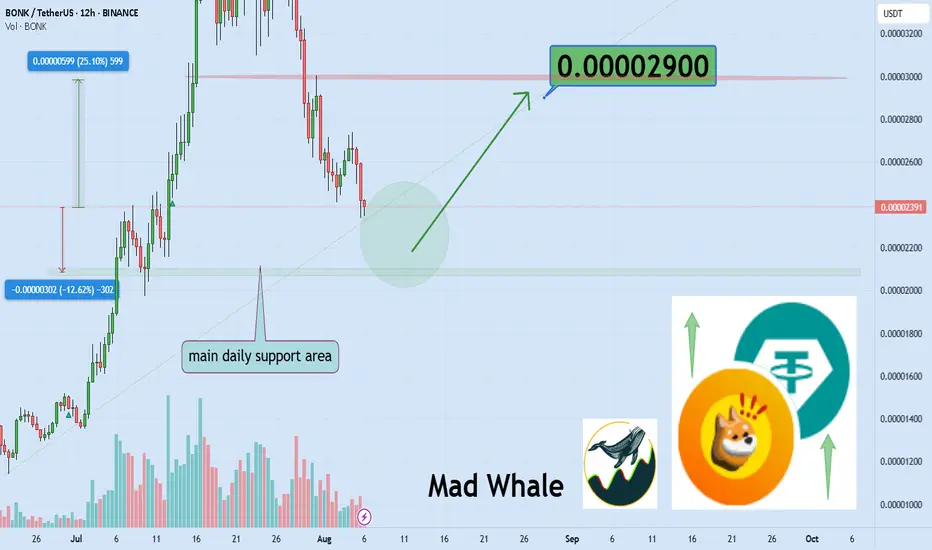
Bonk Holds Key Daily Support, Targeting 25% Rally To 0.000029Hello✌️
Let’s analyze Bonk’s price action both technically and fundamentally 📈.
🔍Fundamental analysis:
BONK's launchpad is moving $165M daily and buying back tokens with 1% fees. But yeah, with the meme coin world still shaky, BONK fell 10.3% in May’s big selloff.
If launchpad hype keeps up, it might help, but BONK’s still riding the emotional rollercoaster. 🎢
📊Technical analysis:
BINANCE:BONKUSDT has lost all major Fibonacci supports, with daily support now its crucial defense. Holding this level could trigger a 25% rally toward 0.000029. 📉⚡
✨We put love into every post!
Your support inspires us 💛 Drop a comment we’d love to hear from you! Thanks, Mad Whale
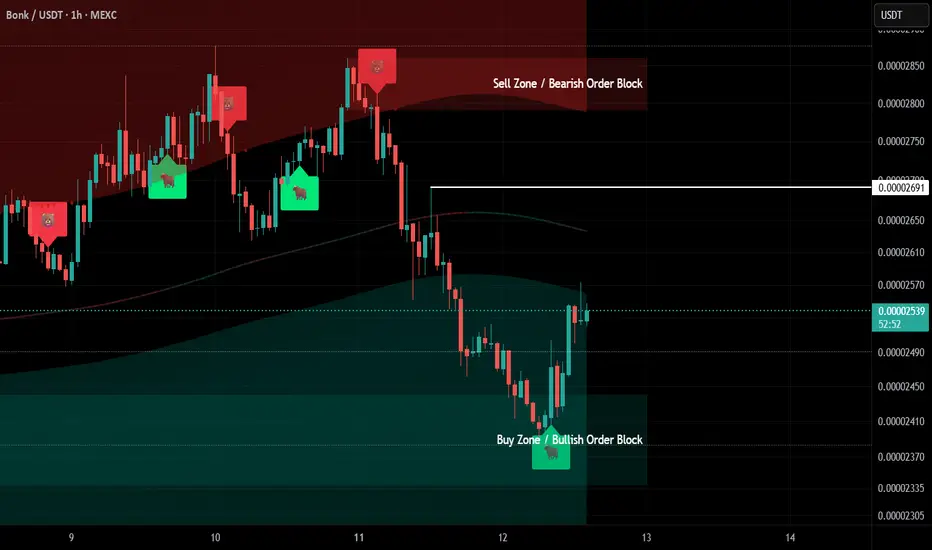
BONKUSDT - This Indicator Feels Like a Cheat CodeBeen trading BONK with my custom Buy/Sell zone indicator and the results have been insane.
It’s been catching reversals almost perfectly on the 1H chart, making entries feel effortless.
The recent buy signal nailed the bounce from the bullish order block and gave a clean move up.
Search for VIP Bull & Bear Sniper - Early Entry/Exit Alerts on my profile to see the full setup.
600 Days of Consolidation — $BONK Finally Wakes UpCRYPTOCAP:BONK has been consolidating inside a wide range for over 600 days. Price recently broke above a short-term downtrend line, showing renewed bullish momentum.
Holding above the mid S/R zone could trigger a move toward the range highs, while a drop back below may send it toward the lower range.
DYOR, NFA

Bonk pump to $0.0000274 tonightJust now hopped into bonk long. Time sensitive
Aiming for $0.0000274
Sl: 0.000025866
2RR+

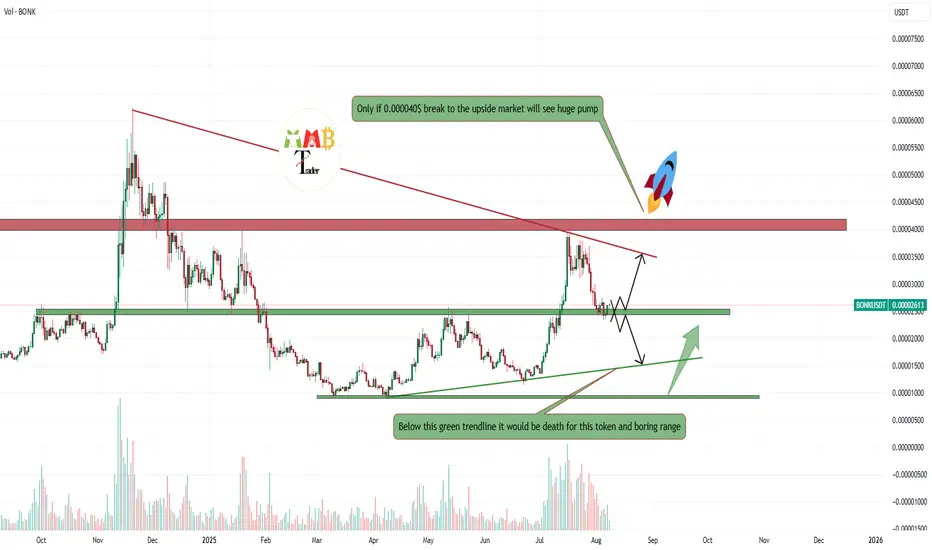
BONKUSDT stuck in a boring range breakout is needed Market here is not that much exciting now and it get stuck between two major Trendline and from breakout to the upside we are +50% far away and i think in this bull run that breakout may not happen even and we may only see that rise again to red trendline and after that more range and dump.
But only if 0.000040$ break to the upside then here we can expect more rise and gain like rocket.
DISCLAIMER: ((trade based on your own decision))
<<press like👍 if you enjoy💚
BONKUSDT – Let the Market Come to YouIn a possible Q3 correction, BONKUSDT may retest the green box zones below.
These areas are not predictions — they’re prepared zones where I’ll be waiting, not chasing.
🟩 I don’t buy strength blindly. I buy value with structure.
All risk-on markets typically experience significant corrections in the third quarter of the year and struggle to recover from this correction until the end of the year.
🎯 My Strategy
🔔 Set alerts for the green boxes
🕐 Switch to the 1-hour timeframe when triggered
📈 Wait for upward breakout + positive CDV
🎯 Only then: take the shot — one bullet, risk-managed
“Markets reward those who wait with a plan, not those who rush with emotion.”
Let’s stay patient, structured, and consistent.
— UmutTrades 💙
📌I keep my charts clean and simple because I believe clarity leads to better decisions.
📌My approach is built on years of experience and a solid track record. I don’t claim to know it all but I’m confident in my ability to spot high-probability setups.
📌If you would like to learn how to use the heatmap, cumulative volume delta and volume footprint techniques that I use below to determine very accurate demand regions, you can send me a private message. I help anyone who wants it completely free of charge.
🔑I have a long list of my proven technique below:
🎯 ZENUSDT.P: Patience & Profitability | %230 Reaction from the Sniper Entry
🐶 DOGEUSDT.P: Next Move
🎨 RENDERUSDT.P: Opportunity of the Month
💎 ETHUSDT.P: Where to Retrace
🟢 BNBUSDT.P: Potential Surge
📊 BTC Dominance: Reaction Zone
🌊 WAVESUSDT.P: Demand Zone Potential
🟣 UNIUSDT.P: Long-Term Trade
🔵 XRPUSDT.P: Entry Zones
🔗 LINKUSDT.P: Follow The River
📈 BTCUSDT.P: Two Key Demand Zones
🟩 POLUSDT: Bullish Momentum
🌟 PENDLEUSDT.P: Where Opportunity Meets Precision
🔥 BTCUSDT.P: Liquidation of Highly Leveraged Longs
🌊 SOLUSDT.P: SOL's Dip - Your Opportunity
🐸 1000PEPEUSDT.P: Prime Bounce Zone Unlocked
🚀 ETHUSDT.P: Set to Explode - Don't Miss This Game Changer
🤖 IQUSDT: Smart Plan
⚡️ PONDUSDT: A Trade Not Taken Is Better Than a Losing One
💼 STMXUSDT: 2 Buying Areas
🐢 TURBOUSDT: Buy Zones and Buyer Presence
🌍 ICPUSDT.P: Massive Upside Potential | Check the Trade Update For Seeing Results
🟠 IDEXUSDT: Spot Buy Area | %26 Profit if You Trade with MSB
📌 USUALUSDT: Buyers Are Active + %70 Profit in Total
🌟 FORTHUSDT: Sniper Entry +%26 Reaction
🐳 QKCUSDT: Sniper Entry +%57 Reaction
📊 BTC.D: Retest of Key Area Highly Likely
📊 XNOUSDT %80 Reaction with a Simple Blue Box!
📊 BELUSDT Amazing %120 Reaction!
📊 Simple Red Box, Extraordinary Results
📊 TIAUSDT | Still No Buyers—Maintaining a Bearish Outlook
📊 OGNUSDT | One of Today’s Highest Volume Gainers – +32.44%
📊 TRXUSDT - I Do My Thing Again
📊 FLOKIUSDT - +%100 From Blue Box!
📊 SFP/USDT - Perfect Entry %80 Profit!
📊 AAVEUSDT - WE DID IT AGAIN!
I stopped adding to the list because it's kinda tiring to add 5-10 charts in every move but you can check my profile and see that it goes on..
