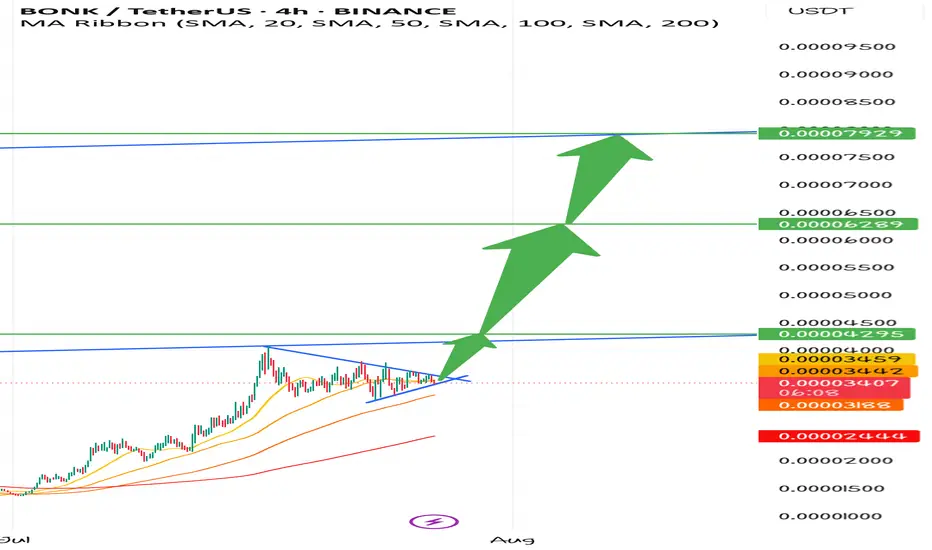
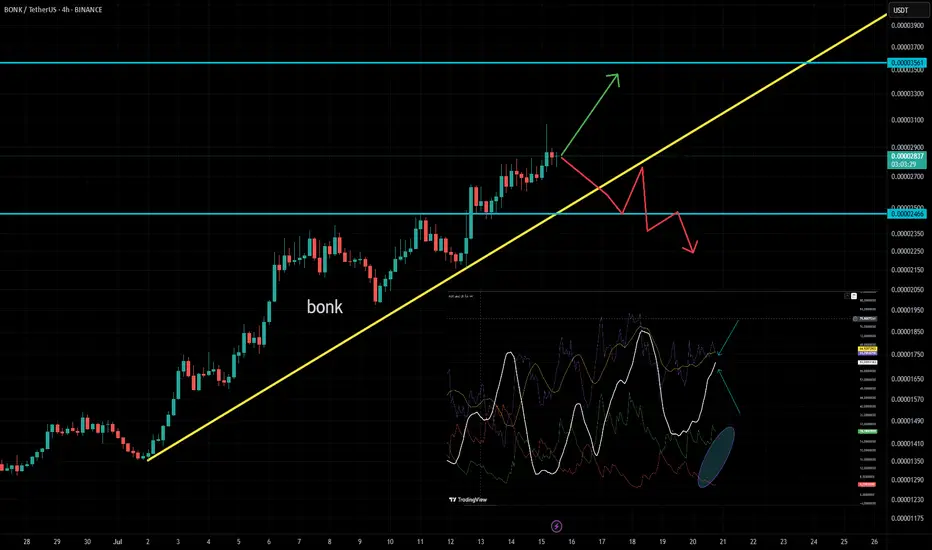
Bonkusdt Long Positionnice flag!
this is financial advise
buy it now for 300 percent profit in 2 weeks
buy now or cry later
targets are shown in green
BONKUSDT trade ideas
$BONK BIG Trade setupCRYPTOCAP:BONK BIG Trade setup: Price had a bullish breakout from Channel Down pattern and has rallied to $0.000036 resistance for +140% gain. It also broke above 200 SMA, which signals resumption of Uptrend. If it breaks above that $0.000036 resistance, it could revisit $0.000050 next.

BONK Breakout Incoming: 26 Percent Upside Target at 0.000044Hello✌
Let’s analyze BONK’s upcoming price potential 📈.
BINANCE:BONKUSDT has demonstrated notable strength in recent sessions, supported by elevated volume 📈. Price action is currently testing a daily support area near the trendline, which aligns with a key Fibonacci retracement level. A confirmed breakout above the psychological resistance at 0.000040 could open the path toward the 0.000044 target, offering an estimated 26% upside potential 🚀.
✨We put love into every post!
Your support inspires us 💛 Drop a comment we’d love to hear from you! Thanks , Mad Whale

BONKUSDT 6H#BONK has formed a descending triangle pattern on the 6H chart. This setup often suggests a potential breakout — typically to the downside, but fakeouts or bullish breaks can occur, especially in strong markets or during volume spikes.
If the price can hold above the EMA50 and attract strong volume, a bullish breakout becomes more likely. In that case, the targets are:
🎯 $0.00003726
🎯 $0.00003920
🎯 $0.00004113
🎯 $0.00004389
🎯 $0.00004741
If a breakdown occurs instead, the potential downside targets are:
🔻 $0.00002969
🔻 $0.00002784
🔻 $0.00002541
⚠️ As always, use a tight stop-loss and apply proper risk management.

BONKUSDT - Climb Back to .00004The weekly MACD hasn't been drawn yet so there's likely more impact by the daily MACD on the price point.
BONK has seen .00004 as a high, so it's possible there's shorts waiting to get rekt at the top.
Expecting a slow climb back towards .00004.
Take note of the rising stochastic and MACD.
Long/shorts ratio has taken a standstill at .000012 to .000014 indicating there's a supply level there.
If it does fall to .000012 I would pick up more.
A great 2-3X hold.

Bonk (1w) Sinusoidal trendBONK/USDT (1W)
BONK is showing a strong bounce from long-term support! 🚀
After touching the strong weekly support zone around 0.00000947, BONK surged with significant volume, breaking out of the descending mini-channel. The price is now approaching the 0.00005054 resistance level, which previously acted as a rejection point.
📊 Key Points:
• Support:
🔻 0.00000947 – major long-term support
• Resistance:
🔺 0.00005054 – key resistance and potential breakout target
• RSI (14):
RSI is sharply rising and crossing above its moving average, suggesting bullish momentum building up.
• Volume:
A strong volume spike confirms increased buying interest from the bottom.
⸻
🔍 Outlook:
As long as BONK holds above 0.00002, bulls have a good chance to push toward 0.00005. A breakout above this level could lead to a strong rally. Watch for RSI overbought conditions in the coming weeks.
⸻
#BONK #BONKUSDT #Crypto #Altcoins #TradingView #TechnicalAnalysis #MemeCoins #Bullish

Is Bonk ready for a 23% breakout toward 0.000030?Hello✌
let’s dive into a full analysis of the upcoming price potential for Bonk📈.
BINANCE:BONKUSDT has recently broken through multiple daily resistance levels in a sharp upward move 🚀, resembling a strong breakout rally. The price is now pulling back toward a key daily support area, which also aligns with the 0.38 Fibonacci retracement level. If this support holds, I’m eyeing a potential 23% upside, with a final target set at 0.000030. 📈
✨ Need a little love!
We pour love into every post your support keeps us inspired! 💛 Don’t be shy, we’d love to hear from you on comments. Big thanks , Mad Whale 🐋

BONKUSDT 1D Chart Analysis | Bullish Momentum is coming...BONKUSDT 1D Chart Analysis | Bullish Momentum Builds After 0.236 Fibo Pullback
🔍 Let’s break down the BONK/USDT daily chart, focusing on the latest price action, strategic moving averages, RSI convergence, and volume dynamics for a complete bullish scenario setup.
⏳ Daily Overview
BONK is showing strong upward momentum, printing consecutive higher highs (HH) in both candles and RSI—a clear bullish trend indicator. After an explosive move, price is currently staging a healthy pullback to the key 0.236 Fibonacci retracement level (0.00003142), which commonly acts as a support platform during aggressive uptrends.
📈 Technical Convergence and Trend Structure
- 3SMA Support: The 7, 25, and 99 SMAs are all trending upward and stacked correctly, with price sitting comfortably above them. The 7SMA acts as immediate dynamic support, reflecting trend strength and buyer interest at every dip.
- RSI Dynamics: RSI just bounced from the 69–70 zone, confirming convergence with price action. The indicator made its own higher high in tandem with the candles, and now, as price pulls back, RSI is reentering the overbought territory—which often precedes renewed momentum.
- Volume Confirmation: Notably, volume surged as the trend accelerated, and is now tapering off during this corrective phase. This is a classic bullish volume signature, showing profit-taking by early longs but no major selling pressure, suggesting trend continuation likely after consolidation.
🔺 Bullish Setup & Targets
- First target: 0.00005376 — retest of the last all-time high (ATH).
- Next resistance to watch: 0.00003920, followed by the ATH region.
- Long-term target: 0.00009710 — an upside of 170–180% from current levels, mapped by technical extension and price discovery zones.
📊 Key Highlights
- Price holding the 0.236 Fibo retracement signals a shallow, healthy correction.
- 3SMA alignment confirms long-term bullish bias—actively supporting every dip.
- RSI and price are convergent, reaffirming uptrend strength; RSI’s move back into overbought could ignite the next price surge.
- Volume decreasing on corrections and rising during rallies—bullish confirmation.
🚨 Conclusion
BONK/USDT remains technically poised for further upside. The blend of higher highs, support at the 0.236 Fibonacci retracement, positive 3SMA structure, and RSI convergence all point to bullish continuation. Watch for renewed momentum as RSI reenters overbought territory and volume confirms the next breakout. Next targets: 0.00005376 (ATH), with a long-term projection toward 0.00009710.

BONKUSDT: The Meme Coin Ready to Bounce! 📊 Key Stats (Live Update)
- Current Price: $0.000022
- Volume: $1.33M (Accumulation phase)
📈 Critical Levels
- Strong Support: $0.0000192
- Immediate Resistance: $0.000027
- Breakout Target: $0.00004 (+85% upside)
🔥 Why BONK Could Moon
1. Extreme Discount: 92% below ATH ($0.00003275)
2. Meme Coin Rally: WIF +12% today showing sector strength
3. Technical Setup: Bullish divergence forming
🎯 Trading Plan (Updated)
- Ideal Entry: $0.000019-$0.000020 zone 🚀
- Scalp Targets:
→ $0.000025 (+13.2%)
→ $0.000027 (+22.2%)
- Swing Targets:
→ $0.000028 (+40%)
→ $0.000035 (+75%)
- Risk Management:
→ Stop Loss: $0.000018
→ Position Size: 1-3% of portfolio
⚠️ Crucial Notes
1. High volatility expected - set alerts
2. Watch BTC dominance for market direction
3. Smaller exchanges may have price discrepancies
📌 Unique Opportunity
At current levels, BONK offers one of the highest risk/reward ratios in meme coins with:
- 80%+ upside potential to ATH
- Limited downside to strong support
🔍 Live Metrics to Watch
1. 4H RSI: 52 (neutral)
2. Volume Spike: $2M+ needed for breakout
3. Exchange inflows/outflows
---
NOT FINANCE ADVICE | DYOR always 💡 Visual Enhancements
Ready for the BONK resurgence? Would you like me to adjust the entry strategy for more conservative traders? 🐶

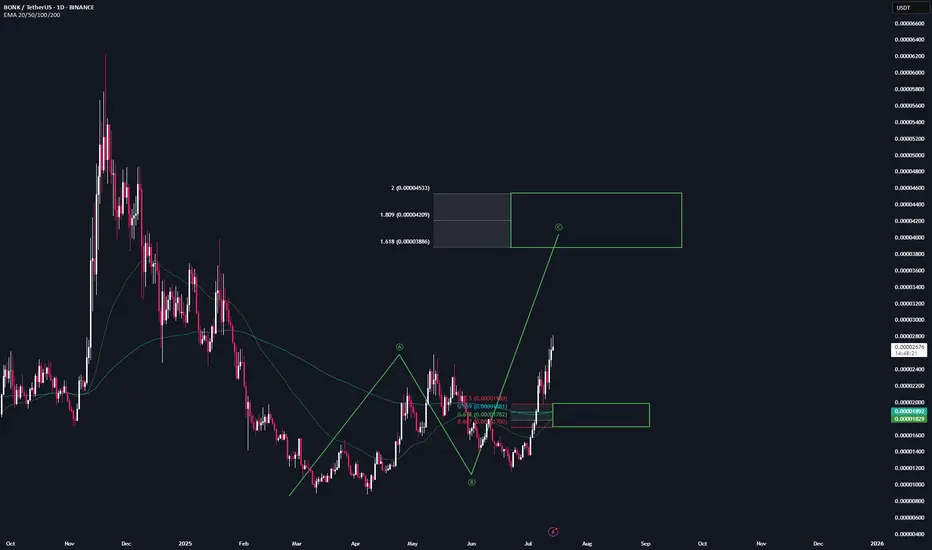
BONKUSDT: Bullish Setup Brewing! Are You In?#BONK is flashing strong bullish signals on the 1D timeframe:
Double Bottom Pattern – A textbook reversal signal
Break & Retest of Key Resistance – Now acting as solid support
Price at CMP (Current Market Price) – In the ideal buy zone
This confluence of signals suggests momentum is shifting in favor of the bulls. If volume kicks in, we could see a sharp breakout toward the next resistance levels.
Trade Plan:
Entry: CMP
SL: 0.00000886
Target 1: 0.00002607
Target 2: 0.00003989
Always use proper risk management!
What’s your view on #BONK? Bullish or Bearish?
Drop your thoughts in the comments and let's discuss!
Don’t forget to like and follow for more setups!
#BONK #Crypto #Altcoins #TechnicalAnalysis #Breakout #DoubleBottom #TradingView

Bonk-ing your head?Yeah please bonk more cuz its BONK TIME, small scalps to the tops thats all u need to do!
Bonk Price is up 30%The price of CRYPTOCAP:BONK Coin has reached double its demand, where lies the resistance – Major Change of Character.
Read more here:
www.cointrust.com

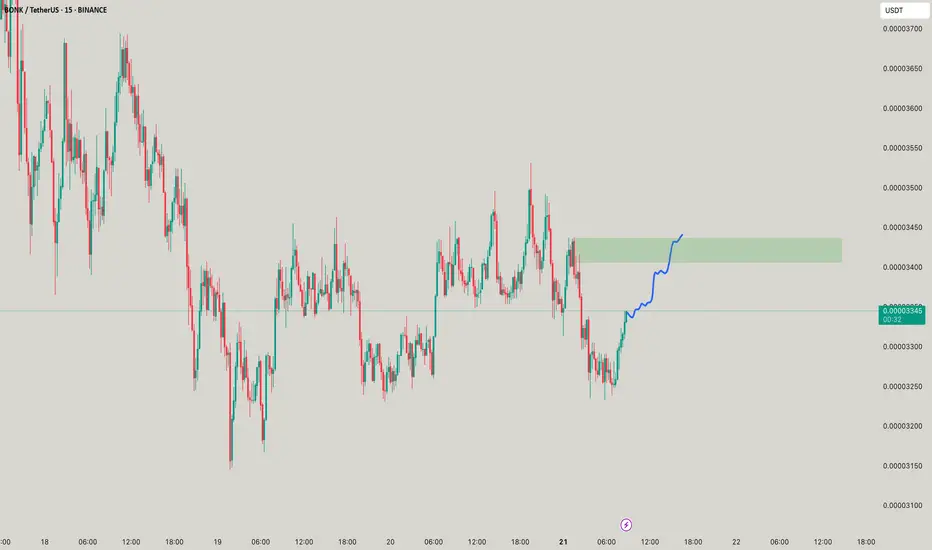
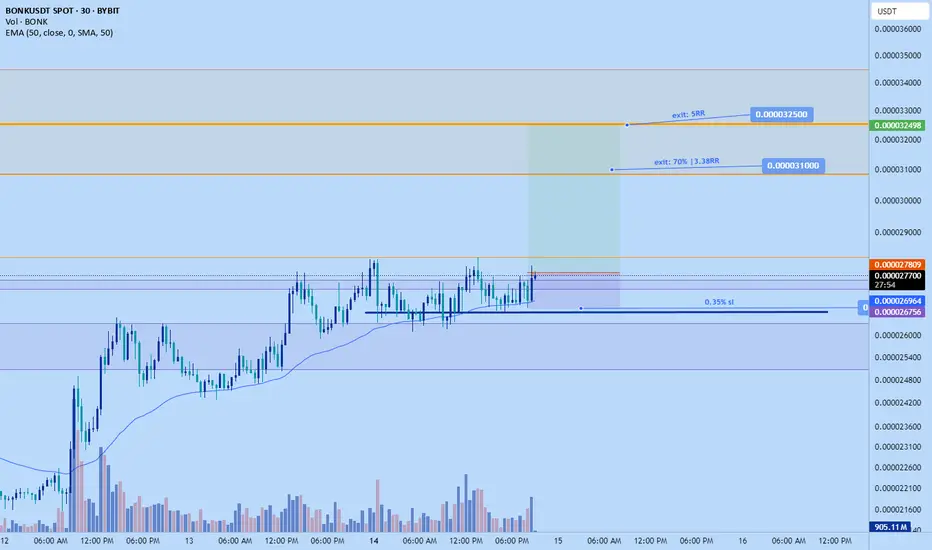
Bonk long to $0.0000325Just now hopped into a long position on bonk. Aiming for $0.0000325. However looking to scale out 70% around $0.000031.
Breakout likely to happen soon, maybe next hr based on my DTT analysis
Stop: $0.000026756 or lower
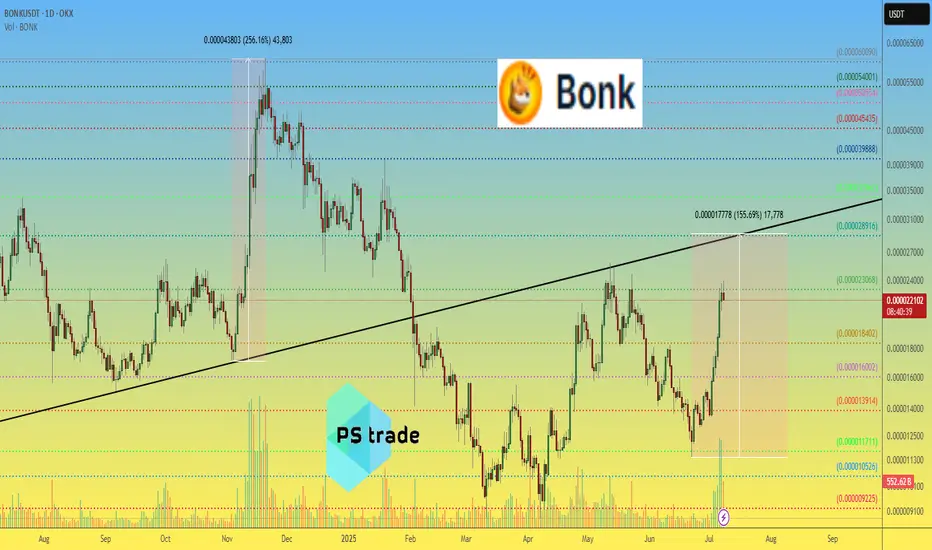
BONK price analysis “Someone” decide to revive the price of CRYPTOCAP:BONK , or are there fundamental reasons for this? (Please share your thoughts in the comments.)
📈 However, the last time there was such a powerful surge in trading volume on the OKX:BONKUSDT chart, the price managed to gain +256% in just over two weeks.
❓ Do you think that the price of #Bonk , in the current wave of growth, will manage to rise by at least +156% and reach the mark of $0.0000290, and the capitalization of the memecoin project will grow from the current $1.75 billion to $2.25 billion?
_____________________
Did you like our analysis? Leave a comment, like, and follow to get more
BONK BONKUSDT Hello, greetings...
🐱🐉 The support and resistance levels in Bonk during the 4-hour timeframe are shown in the graph as I have indicated.
🐱🐉 However, what I want to discuss with you is how we should follow Bonk and how we can maintain control over its strength. I will show this to you...
🐱🏍 First, let's just look at the support, resistance, and our trend...
🐱🏍 When we look at it, we see a strong upward trend showing rapid growth and there is both a support level and a resistance level. It appears that the upward trend will continue until we reach the yellow line. When we reach the yellow trend, the color of things will change.
🐱👤 What I want to explain most to you is the indicator part now...
🐱👤 The blue arrow marks indicate the strength of the trend, the white line is called ADX, which shows how strong the trend is. The purple one is the well-known RSI,
🐱👤 So what is ADX telling us right now?
🐱👤 ADX is still looking upwards and at a high level, so it makes more sense to hold on to our long positions.
🐱🚀 The indicator we know as DI+ and DI- consists of green and red thin lines. What does it tell us?
🐱🚀 If DI+ (green) crosses above DI- (red), it indicates a positive trend and we are currently seeing a significant positive movement. We will use this indicator like this: if ADX turns downward and DI- crosses above DI+, those who are holding long positions should be cautious.
CONTINUE TO HOLD THE POSITION
+DI > -DI
ADX > 25
RSI < 70 → Should not be in an overbought area
BE CAUTIOUS
-DI > +DI
ADX > 25
RSI > 30 → Should not be in an oversold area
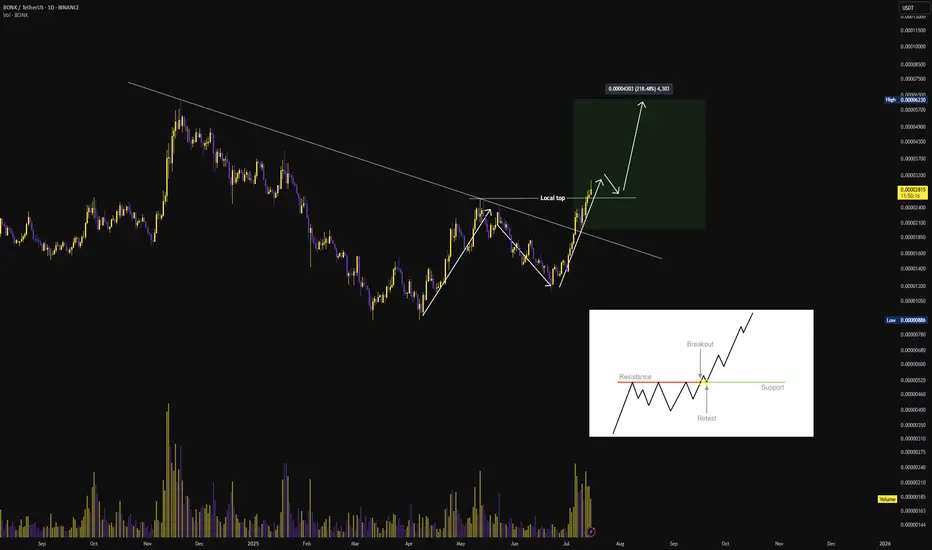
$BONK Breakout and Retest Structure
BONK has executed a clean breakout above the multi-month descending trendline, supported by increasing volume and momentum. The asset has also reclaimed the prior local top, indicating a structural shift in market direction.
Price is now approaching a critical retest zone near the breakout level. If this area holds as new support, it would confirm the breakout and validate the bullish continuation setup.
Measured Move Target: 0.00004303
Potential Upside: ~218% from retest confirmation.
A successful retest followed by bullish price action would reinforce the breakout and open room for further expansion.
BONK | Time for a PullbackBONK is showing signs of exhaustion after its recent breakout above the descending trendline. The price has reached a key resistance zone around 0.00002854, which aligns with previous highs from earlier in the year.
Key Technical Signals:
RSI approaching overbought levels near 80
Price struggling at major resistance confluence
Volume appears to be declining on recent advances
Long-term descending trendline now acting as potential support
Pullback Scenario:
The most likely correction target would be the green support zone around 0.00002000-0.00002100, which represents:
Previous resistance turned support
50% retracement level
Confluence with broken trendline
Risk Considerations:
Crypto markets can remain overbought longer than expected
Strong momentum could push price to next resistance at 0.00003986
A break below 0.00001717 would invalidate the bullish structure
The setup favors a healthy pullback before any continuation higher, making this an ideal zone to wait for better entry opportunities.
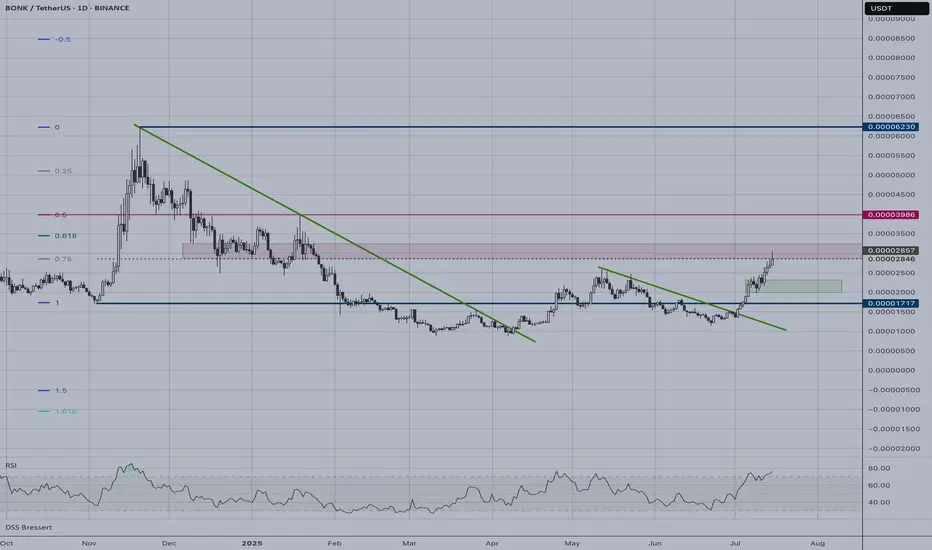
Technical Analysis of Bonk CryptocurrencySeveral factors, including the potential approval of a BONK ETF and the planned burn of 1 trillion tokens upon reaching 1 million holders, have contributed to BONK’s recent price surge.
The price is expected to move toward 0.000035 in the coming days, driven by increasing buying pressure and demand.
However, there’s a high probability of a correction around that level.
As long as the price remains above 0.0000245, the trend remains clearly bullish.
This is not a buy recommendation — it’s purely a technical analysis.

BONK | Trade Setup📌 After the breakout from the last high, a bullish sequence (green) has now been activated.
📊 These setups typically occur no more than twice per year on any given altcoin, so I’ll be aggressively buying each level at the B-C retracement area.
Trademanagement:
- I'm placing long orders at each level. ((If the price continues climbing, I’ll adjust the trend reversal level (green) accordingly and update my limit orders.)
- Once the trade reaches a 2 R/R, I’ll move the stop-loss to break-even.
- From a 3 R/R onward, I’ll start locking in profits.
✅ I welcome every correction from here on —
but I won’t enter any new positions at these top levels.
Stay safe & lets make money
Bonk FLYBonk
BONK is a meme coin launched on Solana in December 2022, distributed to build community and liquidity within the ecosystem
Everything is clear on the chart.
It's time to fly.
I wish everyone abundant profits.
Like and follow
for more.

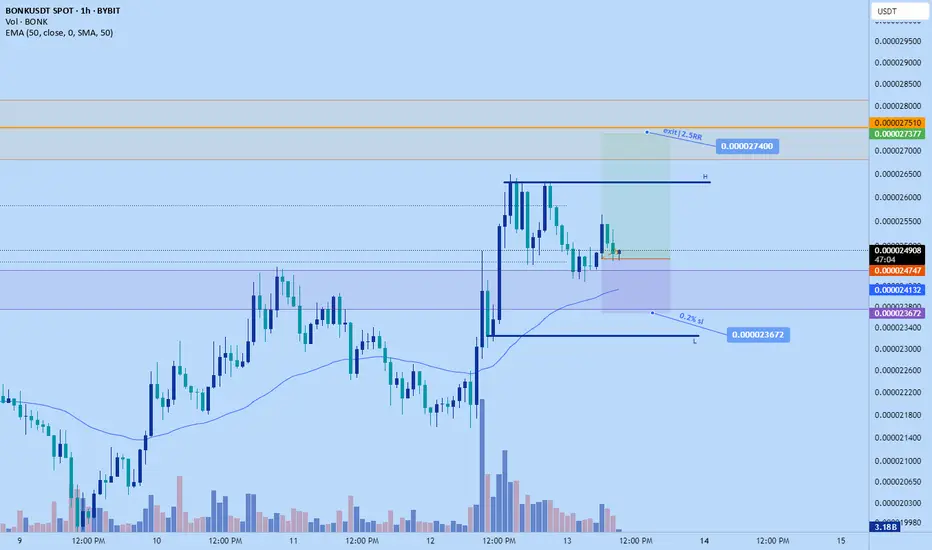
Bonk long to $0.0000274 todayJust now opened up a long position on bonk. Aiming for $0.0274 area
Stop: $0.000023672
roughly 2.5RR from my entry.
Market is at a good area of potential support. Its prior daily resistance that held very strongly in the past and was broken recently with a lot of volume, already gave some signal to long from earlier and return so no need to wait for additional confirmation. Whales likely to defend here from lower prices.
BONK – Long Here, Patience RequiredTime to go long on $BONK.
Hard not to bid at this level—the risk/reward is solid.
Still expecting some range-bound price action before the real move kicks in, so patience is key here.
First target: the yearly open—nearly a 2x from current levels. BINANCE:BONKUSDT

Bonk In A Good Situation, Breaking Resistance & HigherThe market bottom happened 7-April, it was a double-bottom compared to 11-March 2025. The end of a downtrend signals the start of an uptrend, and BONKUSDT started rising next. Resistance was found mid-May, on the twelve. This led to a correction and the correction ended 22-June as a higher low.
Now, between the first low in March and present day we have more than four months. The entire downtrend on the chart lasted 111 days, less than four months. This means that the bullish bias is already bigger in duration compared to the previous bearish wave, and, prices are set to continue higher because BONKUSDT just produced a higher high compared to May. Resistance has been compromised and this is good because it means we can soon experience additional growth.
The path is clear for rising prices. As resistance gets challenged in becomes weaker, as resistance weakens more buy-orders continue to pile up. The more buyers the better the market and then comes a new major high. The advance that is developing now will continue for months and months and months.
Are you ready for huge profits? I hope you are. Crypto is going up!
Namaste.
