$BONK BIG Trade setupCRYPTOCAP:BONK BIG Trade setup: Price had a bullish breakout from Channel Down pattern and has rallied to $0.000036 resistance for +140% gain. It also broke above 200 SMA, which signals resumption of Uptrend. If it breaks above that $0.000036 resistance, it could revisit $0.000050 next.
Related pairs

BONK Breakout Incoming: 26 Percent Upside Target at 0.000044Hello✌
Let’s analyze BONK’s upcoming price potential 📈.
BINANCE:BONKUSDT has demonstrated notable strength in recent sessions, supported by elevated volume 📈. Price action is currently testing a daily support area near the trendline, which aligns with a key Fibonacci retracement level. A confir

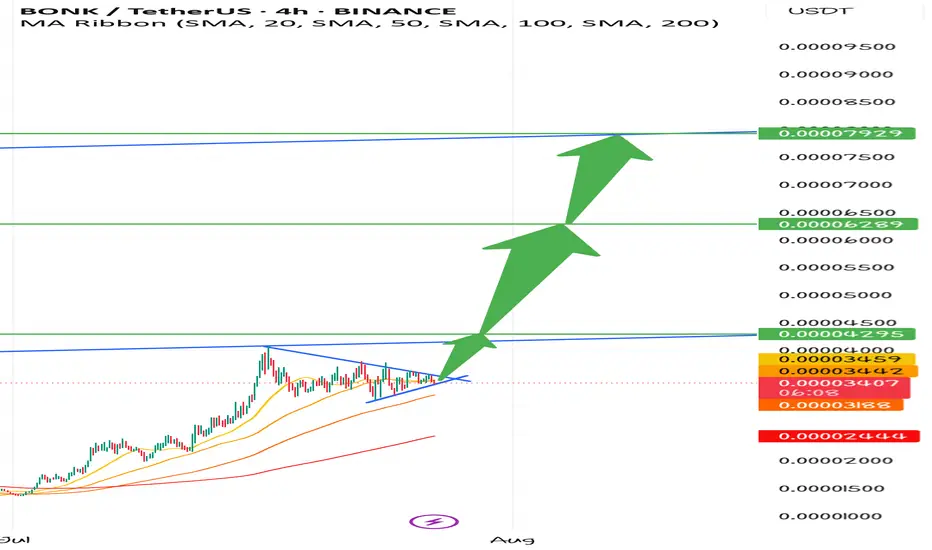
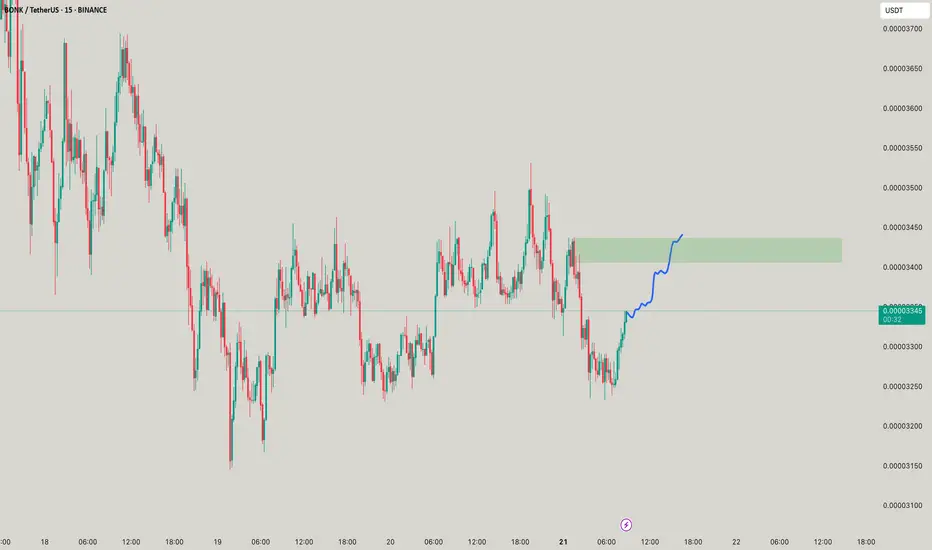
Bonkusdt Long Positionnice flag!
this is financial advise
buy it now for 300 percent profit in 2 weeks
buy now or cry later
targets are shown in green
BONKUSDT: Bullish Setup Brewing! Are You In?#BONK is flashing strong bullish signals on the 1D timeframe:
Double Bottom Pattern – A textbook reversal signal
Break & Retest of Key Resistance – Now acting as solid support
Price at CMP (Current Market Price) – In the ideal buy zone
This confluence of signals suggests momentum is shifting in fa

BONKUSDT 6H#BONK has formed a descending triangle pattern on the 6H chart. This setup often suggests a potential breakout — typically to the downside, but fakeouts or bullish breaks can occur, especially in strong markets or during volume spikes.
If the price can hold above the EMA50 and attract strong volume

BONKUSDT 1D Chart Analysis | Bullish Momentum is coming...BONKUSDT 1D Chart Analysis | Bullish Momentum Builds After 0.236 Fibo Pullback
🔍 Let’s break down the BONK/USDT daily chart, focusing on the latest price action, strategic moving averages, RSI convergence, and volume dynamics for a complete bullish scenario setup.
⏳ Daily Overview
BONK is showin

BONKUSDT - Climb Back to .00004The weekly MACD hasn't been drawn yet so there's likely more impact by the daily MACD on the price point.
BONK has seen .00004 as a high, so it's possible there's shorts waiting to get rekt at the top.
Expecting a slow climb back towards .00004.
Take note of the rising stochastic and MACD.
Long/

Bonk (1w) Sinusoidal trendBONK/USDT (1W)
BONK is showing a strong bounce from long-term support! 🚀
After touching the strong weekly support zone around 0.00000947, BONK surged with significant volume, breaking out of the descending mini-channel. The price is now approaching the 0.00005054 resistance level, which previously

Bonk-ing your head?Yeah please bonk more cuz its BONK TIME, small scalps to the tops thats all u need to do!
Is Bonk ready for a 23% breakout toward 0.000030?Hello✌
let’s dive into a full analysis of the upcoming price potential for Bonk📈.
BINANCE:BONKUSDT has recently broken through multiple daily resistance levels in a sharp upward move 🚀, resembling a strong breakout rally. The price is now pulling back toward a key daily support area, which also a

See all ideas
Summarizing what the indicators are suggesting.
Oscillators
Neutral
SellBuy
Strong sellStrong buy
Strong sellSellNeutralBuyStrong buy
Oscillators
Neutral
SellBuy
Strong sellStrong buy
Strong sellSellNeutralBuyStrong buy
Summary
Neutral
SellBuy
Strong sellStrong buy
Strong sellSellNeutralBuyStrong buy
Summary
Neutral
SellBuy
Strong sellStrong buy
Strong sellSellNeutralBuyStrong buy
Summary
Neutral
SellBuy
Strong sellStrong buy
Strong sellSellNeutralBuyStrong buy
Moving Averages
Neutral
SellBuy
Strong sellStrong buy
Strong sellSellNeutralBuyStrong buy
Moving Averages
Neutral
SellBuy
Strong sellStrong buy
Strong sellSellNeutralBuyStrong buy
Displays a symbol's price movements over previous years to identify recurring trends.
Frequently Asked Questions
The current price of BONK / UST (BONK) is 0.00003153 USDT — it has risen 0.19% in the past 24 hours. Try placing this info into the context by checking out what coins are also gaining and losing at the moment and seeing BONK price chart.
BONK / UST price has fallen by −4.05% over the last week, its month performance shows a 119.56% increase, and as for the last year, BONK / UST has increased by 11.61%. See more dynamics on BONK price chart.
Keep track of coins' changes with our Crypto Coins Heatmap.
Keep track of coins' changes with our Crypto Coins Heatmap.
BONK / UST (BONK) reached its highest price on Nov 29, 2024 — it amounted to 0.00018530 USDT. Find more insights on the BONK price chart.
See the list of crypto gainers and choose what best fits your strategy.
See the list of crypto gainers and choose what best fits your strategy.
BONK / UST (BONK) reached the lowest price of 0.00000891 USDT on Apr 7, 2025. View more BONK / UST dynamics on the price chart.
See the list of crypto losers to find unexpected opportunities.
See the list of crypto losers to find unexpected opportunities.
The safest choice when buying BONK is to go to a well-known crypto exchange. Some of the popular names are Binance, Coinbase, Kraken. But you'll have to find a reliable broker and create an account first. You can trade BONK right from TradingView charts — just choose a broker and connect to your account.
Crypto markets are famous for their volatility, so one should study all the available stats before adding crypto assets to their portfolio. Very often it's technical analysis that comes in handy. We prepared technical ratings for BONK / UST (BONK): today its technical analysis shows the buy signal, and according to the 1 week rating BONK shows the buy signal. And you'd better dig deeper and study 1 month rating too — it's strong buy. Find inspiration in BONK / UST trading ideas and keep track of what's moving crypto markets with our crypto news feed.
BONK / UST (BONK) is just as reliable as any other crypto asset — this corner of the world market is highly volatile. Today, for instance, BONK / UST is estimated as 5.85% volatile. The only thing it means is that you must prepare and examine all available information before making a decision. And if you're not sure about BONK / UST, you can find more inspiration in our curated watchlists.
You can discuss BONK / UST (BONK) with other users in our public chats, Minds or in the comments to Ideas.