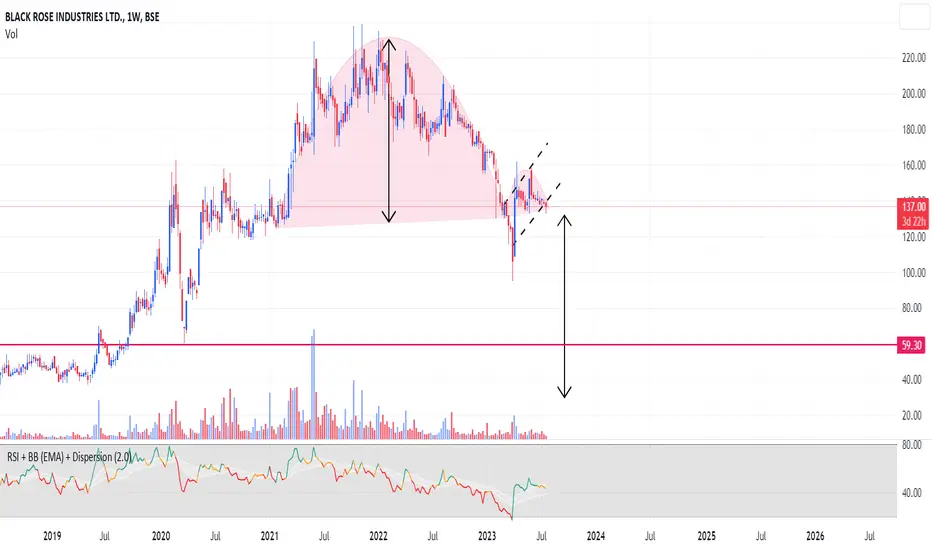
Blackrose - self AnalysisBlackrose - self Analysis
1) Accumulation going on
2) Solid support base
3) LEts see
Next report date
—
Report period
—
EPS estimate
—
Revenue estimate
—
4.00 INR
209.45 M INR
3.90 B INR
11.22 M
About Black Rose Industries Limited
Sector
Industry
Website
Headquarters
Mumbai
Founded
1990
ISIN
INE761G01016
FIGI
BBG000BHRKN0
Black Rose Industries Ltd. engages in the business of manufacturing and distributing chemicals. The firm is also involved in textile manufacturing activity and wind power generation. It operates through Chemicals and Others segments. The company was founded in 1990 and is headquartered in Mumbai, India.
Related stocks

BLACK ROSE INDUSTRIES LTDInverted cup and handle observed
Hold with SL of 100 - Wait for results for further decisions
Financial Performance:
Revenue dip due to falling chemical prices and lower demand.
Manufacturing revenue reduced by 24% due to lower price realization and oversupply in China.
Good cash flow and z
Flag pattern. At support.Flag pattern. One can accumulate this risky stock slowly. Trading at support. Fibo targets are shown in chart.

BLACKROSE WEEKLY Bullish GARTLEY
Price need to follow GREEN TREND LINE and hit Target 1 & 2 , else if Price BREAKS RED TREND LINE is EXIT
POTENTIAL BUY

BLACKROSE 1HRBULLISH BAT
price need to follow Green Trend line & hit target
If price Breaks Red Trend line is where EXIT before SL hits
POTENTIAL BUY

Gambling & CasinoBig breakout on weekly, daily and 4hr time frames.
Took 70% of my position in interval of 2 days.
Sl 4hrCB

WaitingI really like how this is setting up.
Waiting for break to add positions, I already have positions from 80 and 128 levels.
If it breaks below 115 I will close my existing positions.

Blackrose - Weekly Inside Bar breakout - ride with a trend TSLLong at 105 - TSL 2ATR on a closing basis (max 10%)

See all ideas
Summarizing what the indicators are suggesting.
Oscillators
Neutral
SellBuy
Strong sellStrong buy
Strong sellSellNeutralBuyStrong buy
Oscillators
Neutral
SellBuy
Strong sellStrong buy
Strong sellSellNeutralBuyStrong buy
Summary
Neutral
SellBuy
Strong sellStrong buy
Strong sellSellNeutralBuyStrong buy
Summary
Neutral
SellBuy
Strong sellStrong buy
Strong sellSellNeutralBuyStrong buy
Summary
Neutral
SellBuy
Strong sellStrong buy
Strong sellSellNeutralBuyStrong buy
Moving Averages
Neutral
SellBuy
Strong sellStrong buy
Strong sellSellNeutralBuyStrong buy
Moving Averages
Neutral
SellBuy
Strong sellStrong buy
Strong sellSellNeutralBuyStrong buy
Displays a symbol's price movements over previous years to identify recurring trends.
Frequently Asked Questions
The current price of BLACKROSE is 98.50 INR — it has decreased by −0.85% in the past 24 hours. Watch Black Rose Industries Limited stock price performance more closely on the chart.
Depending on the exchange, the stock ticker may vary. For instance, on BSE exchange Black Rose Industries Limited stocks are traded under the ticker BLACKROSE.
BLACKROSE stock has risen by 1.73% compared to the previous week, the month change is a 0.16% rise, over the last year Black Rose Industries Limited has showed a −29.89% decrease.
BLACKROSE reached its all-time high on Nov 9, 2021 with the price of 239.00 INR, and its all-time low was 0.69 INR and was reached on Nov 18, 2008. View more price dynamics on BLACKROSE chart.
See other stocks reaching their highest and lowest prices.
See other stocks reaching their highest and lowest prices.
BLACKROSE stock is 2.99% volatile and has beta coefficient of 1.06. Track Black Rose Industries Limited stock price on the chart and check out the list of the most volatile stocks — is Black Rose Industries Limited there?
Today Black Rose Industries Limited has the market capitalization of 4.98 B, it has decreased by −4.57% over the last week.
Yes, you can track Black Rose Industries Limited financials in yearly and quarterly reports right on TradingView.
Black Rose Industries Limited is going to release the next earnings report on Nov 12, 2025. Keep track of upcoming events with our Earnings Calendar.
BLACKROSE net income for the last quarter is 41.89 M INR, while the quarter before that showed 58.12 M INR of net income which accounts for −27.93% change. Track more Black Rose Industries Limited financial stats to get the full picture.
As of Sep 8, 2025, the company has 95 employees. See our rating of the largest employees — is Black Rose Industries Limited on this list?
EBITDA measures a company's operating performance, its growth signifies an improvement in the efficiency of a company. Black Rose Industries Limited EBITDA is 288.28 M INR, and current EBITDA margin is 7.44%. See more stats in Black Rose Industries Limited financial statements.
Like other stocks, BLACKROSE shares are traded on stock exchanges, e.g. Nasdaq, Nyse, Euronext, and the easiest way to buy them is through an online stock broker. To do this, you need to open an account and follow a broker's procedures, then start trading. You can trade Black Rose Industries Limited stock right from TradingView charts — choose your broker and connect to your account.
Investing in stocks requires a comprehensive research: you should carefully study all the available data, e.g. company's financials, related news, and its technical analysis. So Black Rose Industries Limited technincal analysis shows the sell today, and its 1 week rating is sell. Since market conditions are prone to changes, it's worth looking a bit further into the future — according to the 1 month rating Black Rose Industries Limited stock shows the sell signal. See more of Black Rose Industries Limited technicals for a more comprehensive analysis.
If you're still not sure, try looking for inspiration in our curated watchlists.
If you're still not sure, try looking for inspiration in our curated watchlists.