BPCLKey Levels That Matter
Primary Buy Zone: 333 – 331
Structural Demand / SL: 327
Last MTF High: 381
Supply Zone: 358
Measured Upside Potential: 433
Trade Plan (MTF – Positional)
Entry Strategy
Entry 1: 335
Entry 2: 331
Average Entry: 333
Risk Management
SL: 327
Defined Risk: 6 pts
🔥 Extremely tight risk vs structure
Targets
Target 1: 385 (70% booking)
Positional Target: 408 (30% booking)
Sustained move above 381 opens extension towards 430+
Risk–Reward
RR: 7.4
Net RR (post costs): 7.39
👉 Excellent RR for a PSU large-cap
BPCL – Multi Time Frame (MTF) Summary
Trend Overview
HTF (Yearly / Half-Yearly / Quarterly):
✅ Primary UPTREND intact
Yearly support at 241–222 → long-term base
Half-yearly BUFL confirms continuation
Quarterly support rising to 299–234
HTF Avg Demand Zone: 260 – 226
MTF (Monthly / Weekly / Daily):
✅ UPTREND with momentum
Monthly in ASZ → accumulation before expansion
Weekly & Daily at DMIP, showing active buying
MTF Avg Demand Zone: 325 – 305
ITF (240M / 180M / 60M):
✅ Perfect short-term alignment
Tight working demand at 335 – 327
Indicates absorption and readiness for next leg
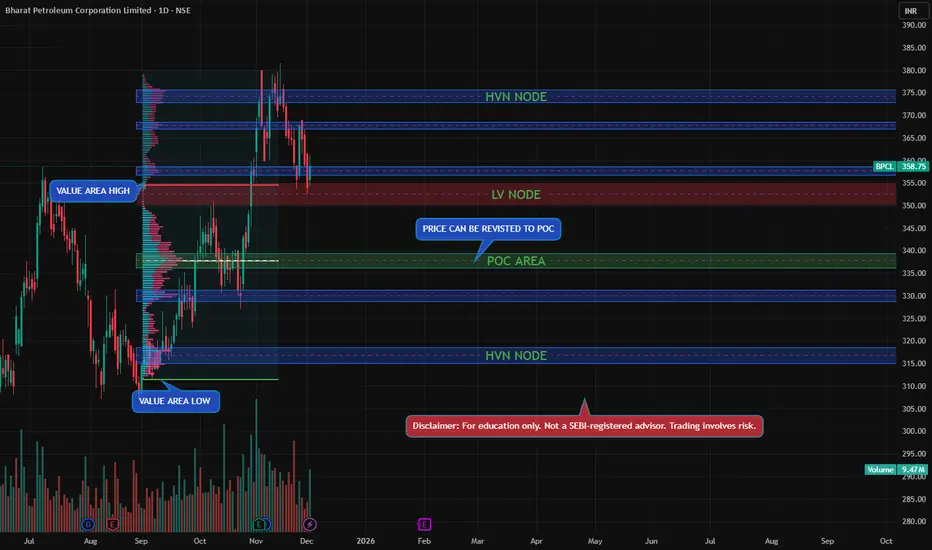
Market insights

BPCL | Volume Profile – Volume EdgePrice is trading below VAH with a LVN above, indicating weak participation.
Below current price lies a high-participation POC area, which may act as a fair-value reference.
HVN zones above and below remain key acceptance / rejection areas.
Bias depends on how price reacts around these volume levels.
📌 Educational insight based on auction behavior.
Disclaimer: For educational purposes only. Not a SEBI-registered advisor. Trading involves risk.
BPCL LONG TRADEIdea: Long trade BPCL for weekly income.
Logic: With BPCL in continuous uptrend, a demand zone formed on 349.4 levels is strong probability for bounce up, as it has broken prior pivot and is also near higher time frame demand zones.
The zone being formed on 50 EMA on weekly time frame adds another edge to the zone working in our favor.
Keeping R:R as 1: 2.5 a long trade with strict SL can be initiated.
Entry : 349.4
SL: 341.35
Target: 369.5.
#Safe trading
#Take proper position size and risk management.

BPCL CMP 357📊 BPCL (Bharat Petroleum Corporation Ltd)
Stock is forming a Cup & Handle pattern within a rising channel.
Momentum looks strong — price sustaining above EMAs with rising volume.
Breakout above ₹360 can open the path for further upside.
Possible target of 411

Bharat Petroleum Corporation LTD Ltd for 3r Nov #BPCL Bharat Petroleum Corporation LTD Ltd for 3r Nov #BPCL
Resistance 360 Watching above 360 for upside momentum.
Support area 350 Below 345 gnoring upside momentum for intraday
Watching below 350 for downside movement...
Above 345 ignoring downside move for intraday
Charts for Educational purposes only.
Please follow strict stop loss and risk reward if you follow the level.
Thanks,
V Trade Point

BPCLPrice at support area and near 200 EMA form this area possibility that it will move upper side.
This idea is for Educational purpose and paper trading only. Please consult your financial advisor before investing or making any position. Facts or Data given above may be slightly incorrect. We are not SEBI registered

Strong multimonth breakout BPCLThe oil major company witnessed a consolidation breakout and closed at multimonth highs on weekly scale ..
volumes are healthy
rsi very strong
stock above key ema areas .

Review and plan for 12th June 2025Nifty future and banknifty future analysis and intraday plan.
Positional/short term stock ideas.
This video is for information/education purpose only. you are 100% responsible for any actions you take by reading/viewing this post.
please consult your financial advisor before taking any action.
----Vinaykumar hiremath, CMT

BPCL_Long- Keep BPCL in watchlist
- Breakout of the recent resistance
- Possibility that price would retest 323 level

A Good Potential Flag and Pole breakout on BPCL!Usually Professional Traders Never ignore Liquidity Rush & Flag n pole Pattern, this is an perfect example of good and safe entry (if broken F&P pattern),

Review and plan for 30th April 2025 Nifty future and banknifty future analysis and intraday plan.
Quarterly results.
This video is for information/education purpose only. you are 100% responsible for any actions you take by reading/viewing this post.
please consult your financial advisor before taking any action.
----Vinaykumar hiremath, CMT

BPCL: Preempting a Rounding Bottom Breakout! 🚀 BPCL: Preempting a Rounding Bottom Breakout! 🚀
📉 CMP: ₹286.8
🔒 Stop Loss: ₹271
🎯 Targets: ₹298 | ₹307 | ₹318
Why BPCL Looks Interesting?
✅ Technical Setup: Forming a rounding bottom with ₹290 as a key resistance-turned-support level
✅ Strength Amid Volatility: Despite tariff fluctuations and market swings, BPCL has held firm, signaling a potential reversal
✅ Breakout Potential: A sustained move above ₹290 could confirm the bullish structure
💡 Strategy & Risk Management:
🔒 Stop Loss: ₹271 to protect downside risk
📈 Staggered Entry: Phased accumulation to manage volatility effectively
⚠️ Caution: The market has seen strong moves—position sizing should be managed carefully.
💬 Do you see energy stocks leading the next market move? Drop your thoughts below!
#BPCL #BreakoutTrading #TechnicalAnalysis #StockMarket #SwingTrading
📉 Disclaimer: Not SEBI-registered. Conduct independent research or consult a professional before investing.

BPCL looking strong on Weekly Charts. Bharat Petroleum Corp. Ltd. is a holding company, which engages in the business of refining of crude oil and marketing of petroleum products. It operates through the Downstream Petroleum and Exploration & Production (E&P) segment. The Downstream Petroleum segment includes the refining and marketing of petroleum products. The E&P segment focuses on hydrocarbons.
Bharat Petroleum Corp. Ltd. Closing price is 293.20. The positive aspects of the company are Very Attractive Valuation (P.E. = 9.3), Companies with reducing Debt, Companies with Zero Promoter Pledge, Stocks Outperforming their Industry Price Change in the Quarter, Growth in Net Profit with increasing Profit Margin and MFs increased their shareholding last quarter. The Negative aspects of the company are Declining Net Cash Flow : Companies not able to generate net cash and Companies with growing costs YoY for long term projects.
Entry can be taken after closing above 296 Historical Resistance in the stock will be 306, 319 and 330. PEAK Historic Resistance in the stock will be 345, 355 and 366. Stop loss in the stock should be maintained at Closing below 261 or 234 depending upon your risk taking ability.
Disclaimer: The above information is provided for educational purpose, analysis and paper trading only. Please don't treat this as a buy or sell recommendation for the stock or index. The Techno-Funda analysis is based on data that is more than 3 months old. Supports and Resistances are determined by historic past peaks and Valley in the chart. Many other indicators and patterns like EMA, RSI, MACD, Volumes, Fibonacci, parallel channel etc. use historic data which is 3 months or older cyclical points. There is no guarantee they will work in future as markets are highly volatile and swings in prices are also due to macro and micro factors based on actions taken by the company as well as region and global events. Equity investment is subject to risks. I or my clients or family members might have positions in the stocks that we mention in our educational posts. We will not be responsible for any Profit or loss that may occur due to any financial decision taken based on any data provided in this message. Do consult your investment advisor before taking any financial decisions. Stop losses should be an important part of any investment in equity.

BPCL :Perfect Short Setup : 1HRBPCL :Perfect Short Setup
Reversal from Pervious Support turned Resistance region.
Can go for 1:2 R:R on Cash or Futures

BPCL is around good support zoneBPCL has dropped about 36% from its all-time high and is now trading near a support zone, which used to be a resistance since 2017. This area could act as a strong base, and we might see a rebound, potentially kicking off BPCL’s upward move.

BPCL RSI DIVERGENCEBPCL showing strength as RSI Divergence on Daily basis.
Crude Oil also getting weaker.
Chart is interesting for a shorter term with strict SL.

BPCLBPCL, below redline is our SL.
DISCLAIMER : i am not a SEBI registered advisor or a financial advisor.All the views are for educational purpose only.

falling wedge pattern formed This stock made a falling wedge pattern. should it make a reversal or make it continue falling. keep stock watch and make a trade after the breakout

BPCL BOStock gave a long consolidation breakout & retest is done multiple times.
However, these commodity-dependent stocks don't always move as we expect them to, so be aware.

BPCL swing positionDouble bottom in BPCL and volume divergence plus money influx. Reasons to buy BPCL

BPCLNSE:BPCL
One Can Enter Now !
Or Wait for Retest of the Trendline (BO) !
Or wait For better R:R ratio !
Note :
1.One Can Go long with a Strict SL below the Trendline or Swing Low.
2. R:R ratio should be 1 :2 minimum
3. Plan as per your RISK appetite and Money Management.
Disclaimer : You are responsible for your Profits and loss, Shared for Educational purpose

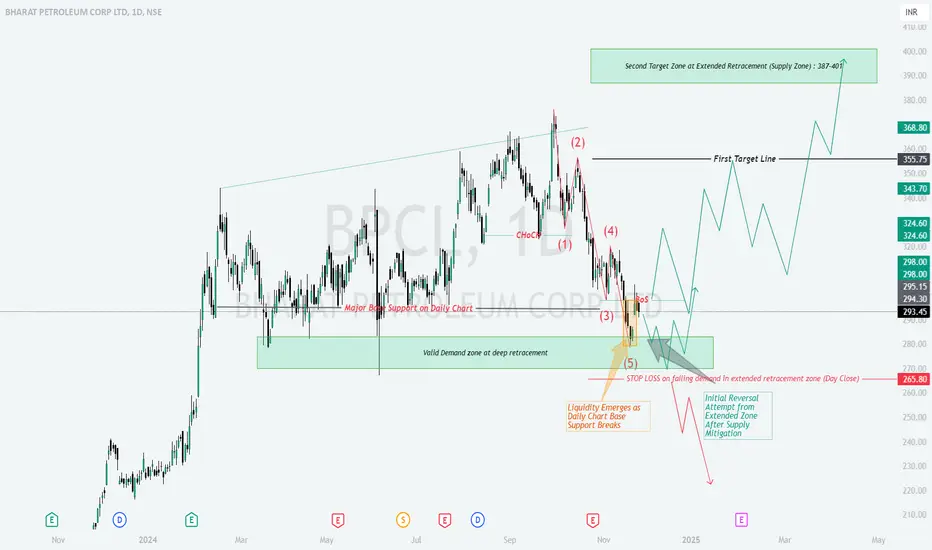
BPCL : Filling Fuel for recoveryBPCL | Based on Demand Zone and Elliott Wave Analysis
Chart Overview
The chart highlights a completed Elliott Wave 5-structure, with price entering a Valid Demand Zone between ₹270-280.
A potential reversal setup is visible, targeting higher levels if price action confirms buyer strength.
Analysis Breakdown
Key Zones to Watch:
Demand Zone (₹270-280):
A deep retracement zone with strong historical buying activity.
Liquidity likely emerges here after breaking the Major Base Support, trapping weak sellers.
First Target Zone (₹343-355):
Initial resistance where sellers may reappear after a reversal.
Second Target Zone (₹387-400):
Extended retracement supply zone where profit-taking is expected.
Elliott Wave Structure:
The current chart shows a 5-wave bearish structure:
Wave (1): Initial impulsive move down.
Wave (2): Weak corrective pullback upward.
Wave (3): Strongest wave breaking major supports.
Wave (4): Minor correction upward.
Wave (5): Final wave driving price into the demand zone.
Wave 5 completion often signals a potential trend reversal, aligning with this setup.
Confirmation Signals:
Price Action: Look for bullish reversal candlestick patterns (e.g., hammer, bullish engulfing) near ₹270-280.
Volume Spike: Increased buying volume in the demand zone indicates institutional interest.
Change of Character (ChoCH): Shift from lower lows/lower highs to higher highs/higher lows.
Trading Plan
Bullish Reversal Trade:
Entry: Near ₹270-280 upon confirmation of bullish price action or volume signals.
Targets:
Target 1: ₹343-355 (initial resistance).
Target 2: ₹387-400 (supply zone).
Stop Loss: Below ₹265 (invalidation of demand zone).
Bearish Breakdown Trade (If Setup Fails):
Logic: A daily close below ₹265 invalidates the demand zone.
Entry: Short position below ₹265 after a confirmed breakdown.
Target: ₹240-250 (next strong support zone).
Stop Loss: Above ₹270-275 (to avoid false breakdowns).
Risk Management
Position Sizing: Limit risk to 1-2% of total capital.
Stop Loss Discipline: Strictly follow stop-loss levels to prevent emotional trading.
Risk-to-Reward Ratio: Aim for at least 1:2 or higher R:R ratio (risk ₹10 to target ₹20+).
Educational Notes
Demand Zone Reversals: Demand zones often lead to significant reversals when combined with liquidity traps and bullish signals.
Wave 5 Completions: Wave 5 typically completes a trend, offering reversal opportunities.
Patience is Key: Wait for confirmation signals to improve trade probability.
Conclusion:
Bullish Plan: Watch for reversals in the ₹270-280 demand zone, targeting ₹343-355 and ₹387-400.
Bearish Plan: Short below ₹265 if the demand zone fails, targeting ₹240-250.
Stick to the plan, follow risk management rules, and allow the market to confirm your bias before executing trades.
Disclaimer:
I am not a SEBI-registered analyst. The above analysis is for educational purposes only. Please conduct your own research or consult with a financial advisor before making trading decisions.
BPCL WILL FARTHER FALL DUE TO THIS PATTERN...TECHNICAL INDICATORS -
REVERSED ASCENDING WEDGE PATTERN :
The stock had broken down from this pattern on 22nd oct with a proper red candlestick and fell 34 points since then. It is expected to fall 10 points more to reach the profit target
BEARISH DIVERGENCE :
The stock had formed a "Bearish Divergence" pattern on 31st july & 30th sept and fell considerably after that
PROFIT TARGET :
282.00
