Enter after breakoutIf find any breakout in 4hr tf with possitive candlestick pattern, can enter as head and shoulders breakout
Market insights

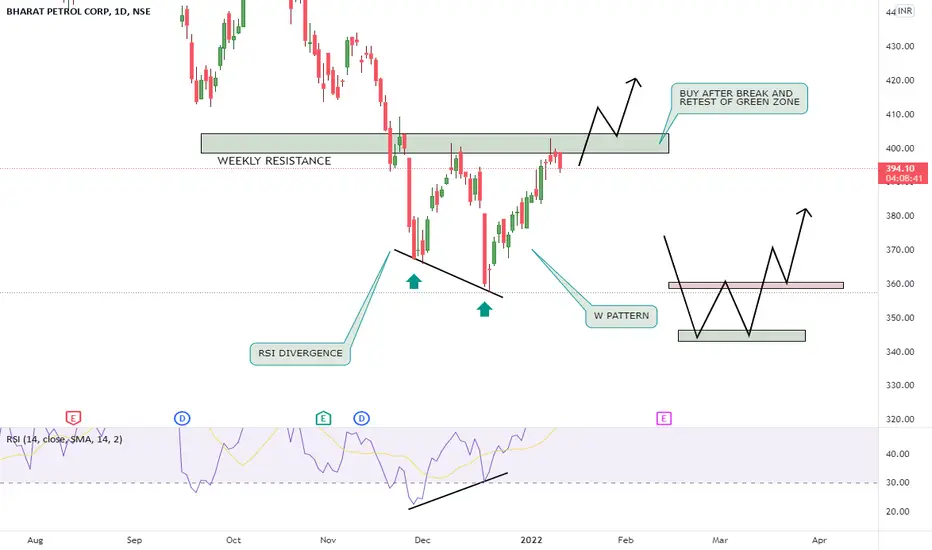
BPCL JAN 3rd week # trade 1.7
If the price follows any of the given lines buy at the indicated arrow
dnt frgt to put stop loss
nt a advisor, noob analysis
Happy Trading :)

BPCL Is Looking Good For SwingWhat we believe in :-
°Trade With Logic
°Take Time Before Investment
Saving Your Capital 🙂
I'm not responsible for your profit or loss.
Mainly Stock & Crypto Investor 🕵️
| Interim Trader 📊
DISCLAIMER :- This Channel Is For ( EDUCATIONAL PURPOSE )

BPCL Breakout CandidateAnalysis as explained in chart. Targets as given in chart.
This idea is for educational purpose only.
Please use strict stoploss and money management rules.
Please consult your financial advisor before investing.
If you support the idea, please hit 'Like' button. You can donate coins too.
Happy Trading!

W patternBPCL 16 jan 22
Formation of Bullish W pattern on daily time frame
CMP 398
T1 412
T2 434
T3 444
For Education Purpose Only

BPCL1 Broke the long term trendline (blue)
2 Took support at marked bottom rectangle
3 Now it has again broken the trendline on lower timeframe and may come down
4 I can see two possibilities one it will regain black trendline and move up or take support around green zone.
Note if it breaks green zone then further downfall is expected
This is just my view and no recommendation

BPCLNSE:BPCL
Please note that we are not a SEBI Registered Investor Adviser/PMS/ Broking House.
All the contents over here are for educational purposes only and are not investment advice or recommendations
offered to any person(s) with respect to the purchase or sale of the stocks / futures and options.
You are also requested to apply your prudence and consult your advisers in case you choose to act on
any such content available as WE claims no responsibilities for any of your actions or any outcome of
such action
Go Long in BPCL...Stock is at bottom of support trend-line, clearly shown taking support from it... On daily TF it is breaking cup pattern...
Privatisation news is already in market, hence good time to make position in BPCL.

Up move onBPCL It's at verge of breakout
Create Long position through Cash & Call Option.
BUY BPCL CASH @396-398 SL 388 Target 408/415/420+
BUY BPCL 405 CALL @5.8 SL 4.5 Target 8/10/12/14

BPCL - Short Term Bullish - Positional
Bulls have gained control and if they are able to sustain above REDLINE, expect a very good upside move.
Stop loss - If price closes below redline on weekly closing basis.
Re-enter if price crosses above REDLINE.
All the best

BPCLGreat opportunity for "swing trade" in "BPCL" stock gives positive brakout after downtrend buy it after re-test at 400 our SL is 350 and TGT is 450,500.


BPCLBPCL was rejected from these levels two time in december, today its breaking above 394.55 comfortably with good volumes.
Buy BPCL with mentioned stoploss & target

BPCL SEllBPCL SEll for day trading if stock break the resistence then we will enter in trade..........

BPCL - possible downslideBased on candle stick pattern formed as the price has not been able to clear its resistance level.
* only for intraday purpose *
Watch the opening and then take a call
Resistance: 399-405-409
Support: 390-387-381
Buying can happen above 397
Selling pressure may come around 395


High probablity breakout in BPCLChart has created higher lows formation with flat level of resistance which has multiple touches. Also price has taken support on 50 SMA and created a narrow range.
There is high probablity of bullish breakout on chart.
.
I am publishing technical analysis on tradingview for educational purpose. You can visit on my profile on tradingview app to learn and understand price action and chart analysis.


