Market insights


BPCL is looking very strongTriangle breakout
Harmonics in place
RSI gaining strength
Give that RSI level breakout and we are looking for 480 and 525 Sl is 395


BPCL - Bharat PetroleumBPCL's price action has been in the range of 360 to 410 for the past 4 months and it has made the level of 400 as strong support. The stock is expected to show an up move to the levels of 470+ in coming weeks subject to the fact that it breaks the supply zone of 428-434 which has been acting a strong resistance for the stock.
Buy - CMP or ~411 (if it experiences any correction which is a least likely event)
T1 (Immediate) - 430+
T2 - 470+
SL - 411
Triggers -
Improved earnings reported in Q3 on YoY and QoQ basis.
Increased sales of automobile sector will lead to more and more demand for fuel.
Transportation services are expected to be normalised soon post COVID thereby increasing the sales.
NOTE : These findings and levels are purely based upon the knowledge and understanding of the post publisher. The idea here is to predict the future price movements hence, please do not consider this as stock advice or recommendation.

BPCL - Symmetrical triangle, narrow range - Weekly chartThis analysis is done purely on basis of price action and chart patterns.
The analysis is done on weekly TF hence it can take couple of days to couple of weeks/months to reach the target.
As one can see that the price has been forming a symmetrical triangle pattern for quite some time. And now the price has been consolidating in a narrow range. looking at the increased volume as well as the chart of NIFTY ENERGY (linked below), chances of breakout and upmove are higher than a breakdown and fall.
NIFTY ENERGY WEEKLY CHART -
Entry can be made above the high of last candle. Targets can be previous swing highs and SL can be below the low of this last green candle.
If price gives a breakdown, then wait for confirmation, because it may be a false breakdown to make the weaker hands exit from stock before it starts its upward rally.
Pls note that this analysis is for study purpose.
Traders must do their own study before entering into any trade. Traders should trade with their own risk capacity and money management.
Feel Free to comment for any query or suggestion regarding this stock or Price Action Analysis/Chart Study
One more chart of HINDPETRO for study purpose for beginners is linked here. It is from same sector. Check out and find out opportunities.

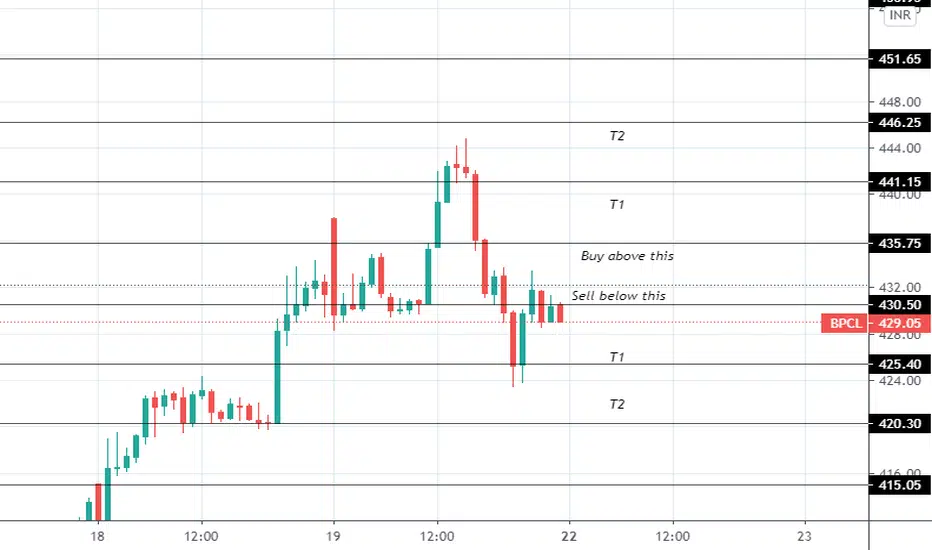
BPCL - Earnings Day AnalysisTrading in a Symmetrical Triangle , Rejected by the overhead trendline .
Currently on a minor zone. It has also formed a channel in the major Triangle structure .
Looking to BUY if the triangle is broken & retested .Looking to SELL if the below minor zone is broken and retested .


#BPCL Weekly chartBPCL weekly chart forming a tight triangle contraction and is on the verge of a breakout
A weekly close above 430 will confirm the breakout
StopLoss can be maintained at 375 (weekly closing basis)
Target 1 --> 550
Target 2 --> 650
Time Horizon 10 - 15 months


Watchout for BPCLWatchout for BPCL breakout on either side. The breakout will be huge.
I'm not SEBI registered analyst. Please do your own research before taking any position. Thank you.


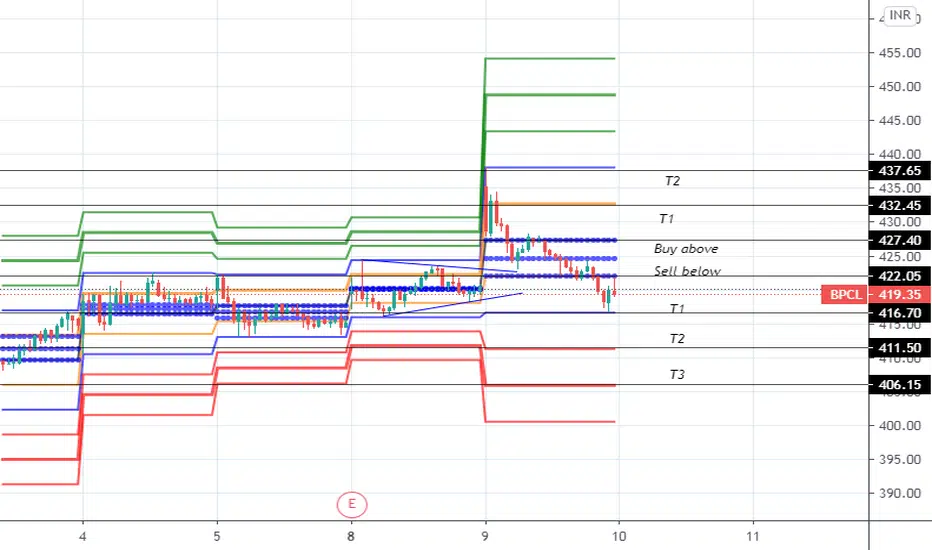
BPCL - Intraday Trade SetupBPCL CMP - 413.45
Looking bearish in higher time frame. One can go for Intraday Trade setup with the following entry, exit & targets
Sell at or Below 410 ONLY / Stop Loss 416
Target 1 - 407
Target 2 - 405
Target 3 - 400
Disclaimer: This is my view and for educational purpose only.


#BPCLNSE:BPCL looks explosive from here. The stock has already broke out and tomorrow's close will confirm whether breakout has sustained or not. Monthly is sideways and Weekly has price in triangle pattern.
