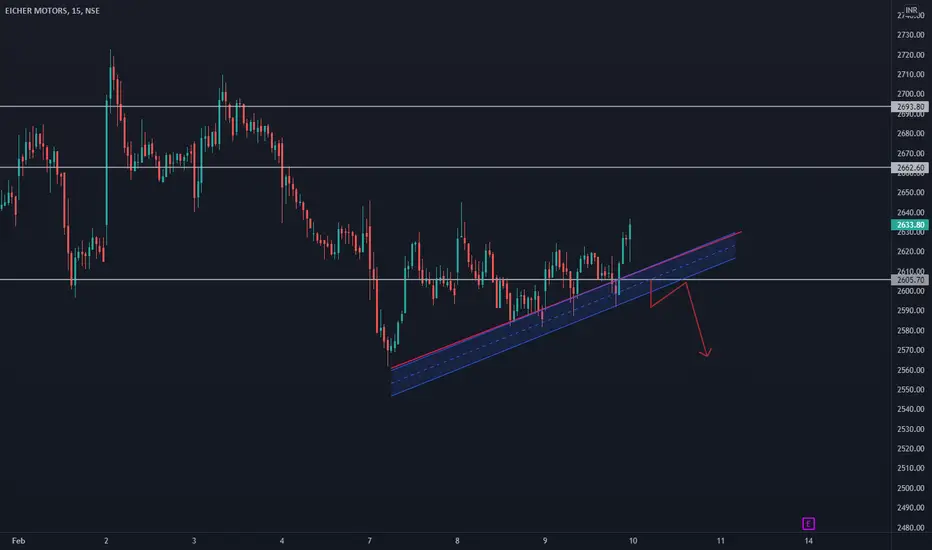
EICHER Buy for intraday tradingEICHER Buy for intraday trading if stock and AUTO sector also strong.......
Eicher Motors Limited
No trades
Market insights

EICHER motor sell for intraday tradingEICHER motor sell for intraday trading if stock and auto sector also weak.......
Eicher Motor India Sun Storm Investment Trading Desk & NexGen Wealth Management Service Present's: SSITD & NexGen Portfolio of the Week Series
Focus: Worldwide
By Sun Storm Investment Research & NexGen Wealth Management Service
A Profit & Solutions Strategy & Research
Trading | Investment | Stocks | ETF | Mutual Funds | Crypto | Bonds | Options | Dividend | Futures |
USA | Canada | UK | Germany | France | Italy | Rest of Europe | Mexico | India
Disclaimer: Sun Storm Investment and NexGen are not registered financial advisors, so please do your own research before trading & investing anything. This is information is for only research purposes not for actual trading & investing decision.
#debadipb #profitsolutions

Technical discussion on nifty and BankNiftyNifty and BankNifty levels for 2nd Feb
This only for educational purpose. Check the technical view in the below link

EICHER MOTORS - at short term supportThe structure of the chart becomes weak after a massive fall in today's session.
Though currently, it is trading at short-term support, if held we may see a temporary bounce back in the stock.
Immediate Resistance at 2800
Type of Trade: contra - risky.
Freefall may be seen in the stock below 2700 levels, hence be careful.
Disclaimer: Not a recommendation to trade

Eicher Motors FlagEicher Motors EOD chart is forming a flag with a breakout yesterday. Expect to enter at 0.5 % of yesterday's close and exit at +7%.


eicher motorthis stock is trading in a side ways for past few months
But it crosses the one support and resistance zone,
safe trader wait to break the overall box zone
aggressive trader go for long at the price when the price crosses the previous candle

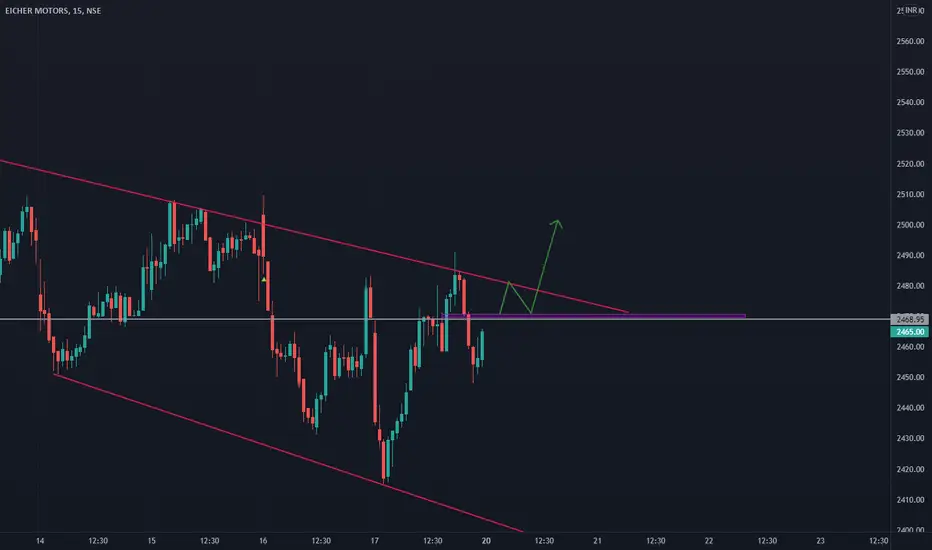
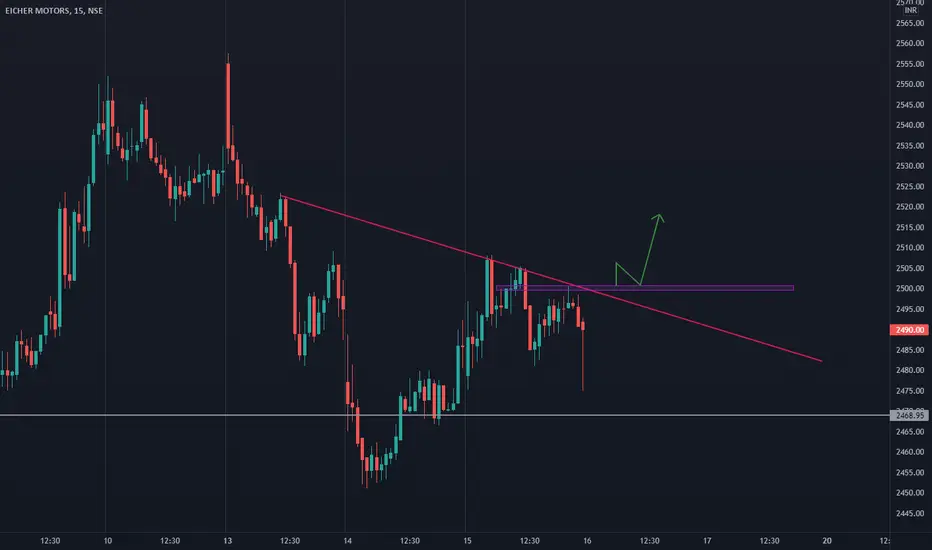
EICHER BUYEICHER BUY for day trading if stock and also auto sector also bullish then we will buy the stock.....

EICHER MOTORSlookjng good for intraday after crossing yesterday High to target of 2880 . after crossing the swing sellers tried to take it down but buyers were looking very strong sk we can go long after crossing Friday's high.

EICHER MOTORSEicher motors is taking support and seen big bullish moves in weeekly and daily time on weekly time MACD indicator show bullish cross over near the zero line it is a very bullish signal. we can long it for next month also

Long Entry in Eicher MotBuy Eicher motors above 2704 with SL below 2664 on 30 min candle closure basis. target 2800 Holding Period 12 to 15 days

Eicher Motors - Positional Trade set up on weekly charts
ABOVE REDLINE - BULLS - LONG
BELOW GREENLINE - BEARS - SHORT
The stock will try to 2600 touch levels and may face stiff resistance. Go Long if price breaches REDLINE and sustains above on weekly chart.
Stop loss - Below redline - Weekly closing.
Short position - If price trades below GREENLINE.
Thanks for watching.
All the best

EICHER MOTOR (Long)Crossed 200 EMA on daily chart.
Good Volume seen.
Many times it has bounced up from this Demand zone
Demand zone marked on chart 2529 to 2587.
Supply zone marked on chart 2699 to 2755.
Made a "W" pattern on Daily Time Frame ready for breakout.
Buy above 2620 once retested this level for a Tgt of 2700 - 2750 - 2860 Keep SL 2529
please do correlate by yourself also on charts. This is for educational and paper trading purpose only. Please consult your financial advisor before investing.

EICHER BUyEICHER BUy for day trading if stock and auto sector also bullish then we will enter in trade..

EICHER MOTORSBelow 200 EMA on daily basis + in LH LL setup. Will looking for down side 2300 round levels.


EICHERMOTORS- Long opportunity. Probable completion of D point @ 3277
Has potential to reach above target after closing 2953 (initial harmonic pattern D point)
CMP=2853

EICHERMOTNSE:EICHERMOT
Please note that we are not a SEBI Registered Investor Adviser/PMS/ Broking House.
All the contents over here are for educational purposes only and are not investment advice or recommendations
offered to any person(s) with respect to the purchase or sale of the stocks / futures and options.
You are also requested to apply your prudence and consult your advisers in case you choose to act on
any such content available as WE claims no responsibilities for any of your actions or any outcome of
such action
