IDBI Bank - Can it be a Multibagger Stock ?Decoding the Stock,
Will it be a Multibagger Stock ? Let us understand in the video
IDBI Bank Limited
No trades
8.65 INR
76.31 B INR
341.48 B INR
5.86 B
About IDBI Bank Limited
Sector
Industry
CEO
Rakesh Sharma
Website
Headquarters
Mumbai
Founded
1964
Identifiers
2
ISININE008A01015
IDBI Bank Ltd. engages in the provision of commercial banking services to retail and corporate customers. It operates through the following segments: Corporate and Wholesale Banking; Retail Banking; Treasury; and Other Banking and Group Operations. The Corporate and Wholesale Banking segment includes corporate relationship covering deposit and credit activities other than retail, as well as corporate advisory and syndication, project appraisal, and investment portfolio. The Retail Banking segment comprises of credit and deposit activities that are primarily oriented towards individuals and small business including priority sector lending. The Treasury segment trades portfolio of investments, money market operations, derivative trading, and foreign exchange operations on the proprietary account and for customers. The Other Banking and Group Operations segment Includes operations and activities of group companies other than bank. The company was founded on July 01, 1964 and is headquartered in Mumbai, India.
Related stocks

Multi year break out in IDBI bank ??Multi year break out in IDBI bank ??
Check chart its sef explanatory.
Target around 125 for swing
I am expecting more for positional
CMD around 101
check on multi time frame

IDBI Bank – Monthly Chart Cup & Handle Study IDBI Bank is exhibiting a well-defined Cup and Handle formation on the monthly timeframe. The rounded base (cup) spans nearly a decade, followed by a shallow consolidation (handle) in recent years. The cup’s high aligns exactly with the stock’s all-time high, making it a natural first target if the

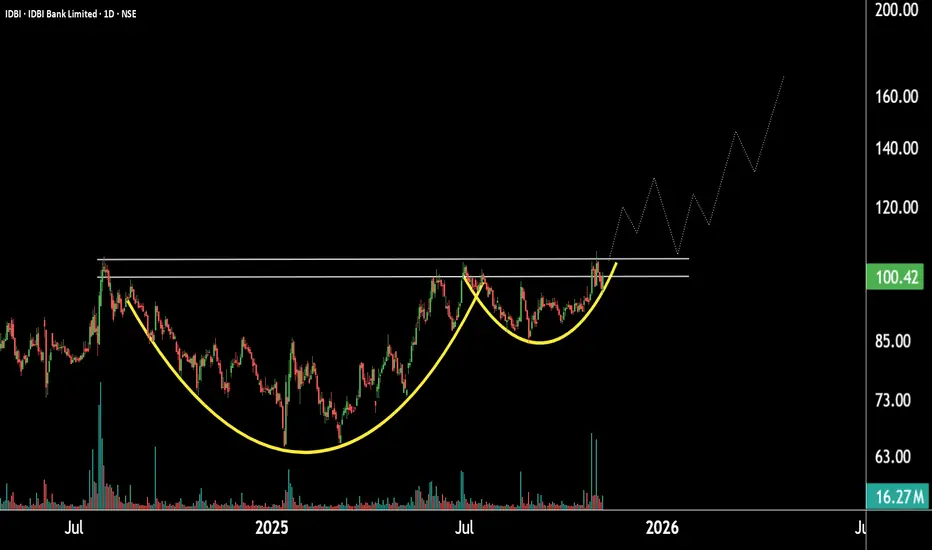
Cup And Handle Formation In IDBI Could Trigger MomentumThis is the daily timeframe chart of IDBI Bank.
The stock is forming a Cup and Handle pattern on the daily timeframe, with a strong support zone near the 90–95 range. If the current rally continues and the stock breaks out of this pattern, it may move toward the 130 level, followed by 165.
If the
IDBI Trade Set UPStock has broken out and is ready for the targets mentioned in drawing as TI and T2, has also formed cup and handle pattern

IDBI BANK LTD - for Long-Term🚀 Breakout Alert!
IDBI Bank has finally broken out of a multi-year resistance zone that was acting as a strong supply area since 2010. The breakout is supported by significant volume, indicating strong institutional participation.
🟩 Structure Highlights:
Price has broken above the long-term horizo
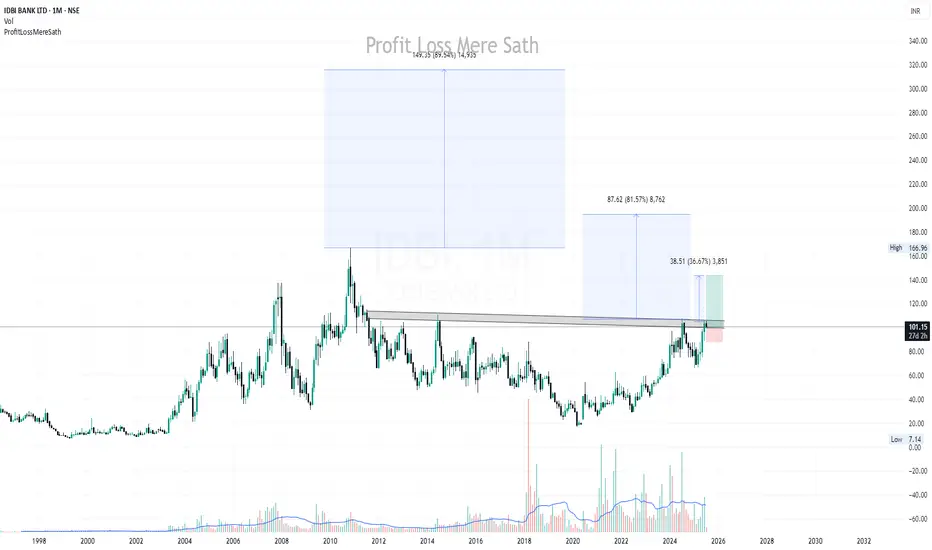
IDBI : Red band Resistance on a monthly time frame IDBI : Red band Resistance on a monthly time
frame.
There is a Buy triggered on a daily time frame at 100 but on a monthly time frame there is a major Red Band Resistance.
On a 3 Month frame also it is almost sitting just above and around Red band Resistance.
To continue the rally these Red B

Positional Setup: IDBI Bank Ltd (NSE)Chart Pattern: Cup and Handle Formation
CMP: ₹101.33
Technical Structure: Classic bullish Cup & Handle breakout setup in progress
Volume: Noticeable rise in volumes at breakout zones
Momentum: RSI & moving averages support the trend continuation
📊 Technical Levels (Positional Setup)
Support Zon

IDBI Bank : Buy triggered but sitting right at a Red band ResisIDBI Bank : Buy triggered but sitting right at a Red band Resistance .
Last time it has turned back from 104 and 107
( Not a Buy / Sell Recommendation
Do your own due diligence ,Market is subject to risks, This is my own view and for learning only .)

IDBI- Analysis Only for long term investors
As you can see stock has made top in November 2010 and from March 2020 it has given close to 400% returns, can this trend continue for next 1-2 years or more?
It will be a good to keep buying this stock on every retracements. Good buying range will be around 83 to 9

See all ideas
Summarizing what the indicators are suggesting.
Oscillators
Neutral
SellBuy
Strong sellStrong buy
Strong sellSellNeutralBuyStrong buy
Oscillators
Neutral
SellBuy
Strong sellStrong buy
Strong sellSellNeutralBuyStrong buy
Summary
Neutral
SellBuy
Strong sellStrong buy
Strong sellSellNeutralBuyStrong buy
Summary
Neutral
SellBuy
Strong sellStrong buy
Strong sellSellNeutralBuyStrong buy
Summary
Neutral
SellBuy
Strong sellStrong buy
Strong sellSellNeutralBuyStrong buy
Moving Averages
Neutral
SellBuy
Strong sellStrong buy
Strong sellSellNeutralBuyStrong buy
Moving Averages
Neutral
SellBuy
Strong sellStrong buy
Strong sellSellNeutralBuyStrong buy
Displays a symbol's price movements over previous years to identify recurring trends.
MIDCAPETF
Mirae Asset Nifty Midcap 150 ETF Exchange Traded Fund UnitsWeight
0.15%
Market value
214.03 K
USD
FLQA.USD
Franklin FTSE Asia ex China ex Japan UCITS ETF Accum Shs USDWeight
0.01%
Market value
52.81 K
USD
Explore more ETFs
Frequently Asked Questions
The current price of IDBI is 97.45 INR — it has decreased by −0.61% in the past 24 hours. Watch IDBI Bank Limited stock price performance more closely on the chart.
Depending on the exchange, the stock ticker may vary. For instance, on BSE exchange IDBI Bank Limited stocks are traded under the ticker IDBI.
IDBI stock has risen by 3.02% compared to the previous week, the month change is a −5.07% fall, over the last year IDBI Bank Limited has showed a 22.44% increase.
IDBI reached its all-time high on Nov 11, 2010 with the price of 202.25 INR, and its all-time low was 17.50 INR and was reached on Mar 13, 2020. View more price dynamics on IDBI chart.
See other stocks reaching their highest and lowest prices.
See other stocks reaching their highest and lowest prices.
IDBI stock is 1.82% volatile and has beta coefficient of 1.76. Track IDBI Bank Limited stock price on the chart and check out the list of the most volatile stocks — is IDBI Bank Limited there?
Today IDBI Bank Limited has the market capitalization of 1.05 T, it has increased by 5.29% over the last week.
Yes, you can track IDBI Bank Limited financials in yearly and quarterly reports right on TradingView.
IDBI net income for the last quarter is 32.30 B INR, while the quarter before that showed 20.19 B INR of net income which accounts for 59.95% change. Track more IDBI Bank Limited financial stats to get the full picture.
Yes, IDBI dividends are paid annually. The last dividend per share was 2.10 INR. As of today, Dividend Yield (TTM)% is 2.14%. Tracking IDBI Bank Limited dividends might help you take more informed decisions.
IDBI Bank Limited dividend yield was 2.70% in 2024, and payout ratio reached 29.59%. The year before the numbers were 1.85% and 27.86% correspondingly. See high-dividend stocks and find more opportunities for your portfolio.
As of Dec 19, 2025, the company has 19.73 K employees. See our rating of the largest employees — is IDBI Bank Limited on this list?
Like other stocks, IDBI shares are traded on stock exchanges, e.g. Nasdaq, Nyse, Euronext, and the easiest way to buy them is through an online stock broker. To do this, you need to open an account and follow a broker's procedures, then start trading. You can trade IDBI Bank Limited stock right from TradingView charts — choose your broker and connect to your account.
Investing in stocks requires a comprehensive research: you should carefully study all the available data, e.g. company's financials, related news, and its technical analysis. So IDBI Bank Limited technincal analysis shows the sell today, and its 1 week rating is buy. Since market conditions are prone to changes, it's worth looking a bit further into the future — according to the 1 month rating IDBI Bank Limited stock shows the buy signal. See more of IDBI Bank Limited technicals for a more comprehensive analysis.
If you're still not sure, try looking for inspiration in our curated watchlists.
If you're still not sure, try looking for inspiration in our curated watchlists.