Vodafone idea target look maximum 20 Vodafone idea target look maximum 20 and after that it might show reversal. So don't be over optimistic until it retrace after the upper line and then take strong support
Vodafone Idea Ltd
No trades
Market insights

Vodafone Idea has completed a strong falling wedge breakoutVodafone Idea has completed a strong falling wedge breakout backed by a clear BOS and a major liquidity sweep, indicating fresh Smart Money accumulation. Price has flipped a multi-month resistance at ₹9.90 into support and now sits inside an expansion phase with clean imbalance zones leading toward the next major liquidity pool at ₹19.20. Fundamentally, the company is still weak but improving with government backing, tariff hike expectations, and growing ARPU.
This setup offers high risk but very high reward potential. Technicals strongly support the move, while fundamentals provide early signs of a turnaround. A sustained close above ₹10 confirms the bullish continuation.
Disclaimer: I am not a SEBI-registered advisor. All the information shared in this is for education and awareness only. The stock analysis, charts, opinions, and views expressed are based on publicly available data and my personal interpretation. This should not be considered financial, investment, or trading advice. Always do your own research and consult your financial advisor before investing

Idea : Important resistance level crossed @ 10.50 Idea : Important resistance level crossed @ 10.50
( Not a Buy / Sell Recommendation
Do your own due diligence ,Market is subject to risks, This is my own view and for learning only .)

An "Idea" says something here?Idea, has given a powerful breakout on 11th Nov of 10 months rounding bottom pattern or a inverse H&S on daily TF. If sustains above 10 for a day or two, we can expect a strong rally from here. Please share your views
Disclaimer: this is not a buy/sell recommendation. It's for educational purpose only
IDEA | Buy @10 | SL below 9 | Targets 13.60, 16.40, 19Disclaimer:
This is not financial advice. Please do your own research or consult with a financial advisor before making any investment decisions. Investments in stocks can be risky and may result in loss of capital.

IDEA going to retest the top IDEA
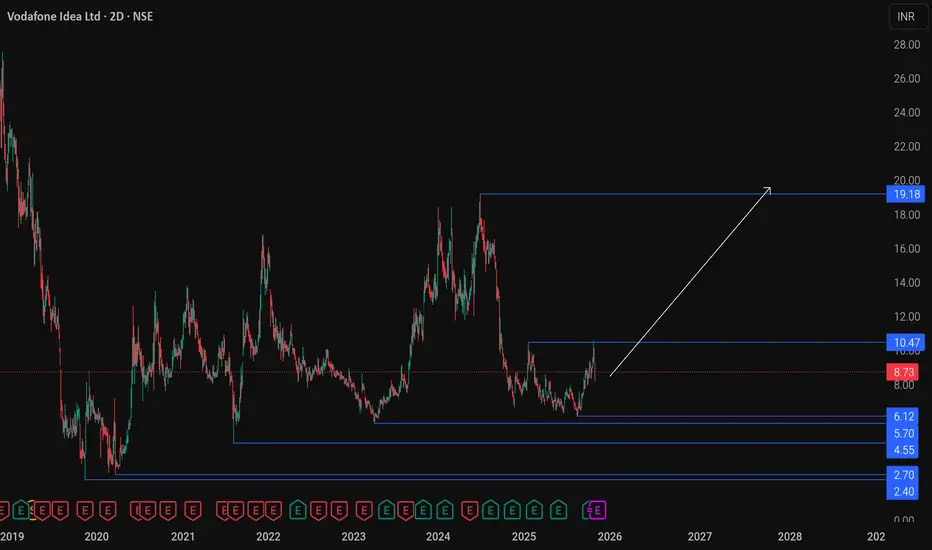
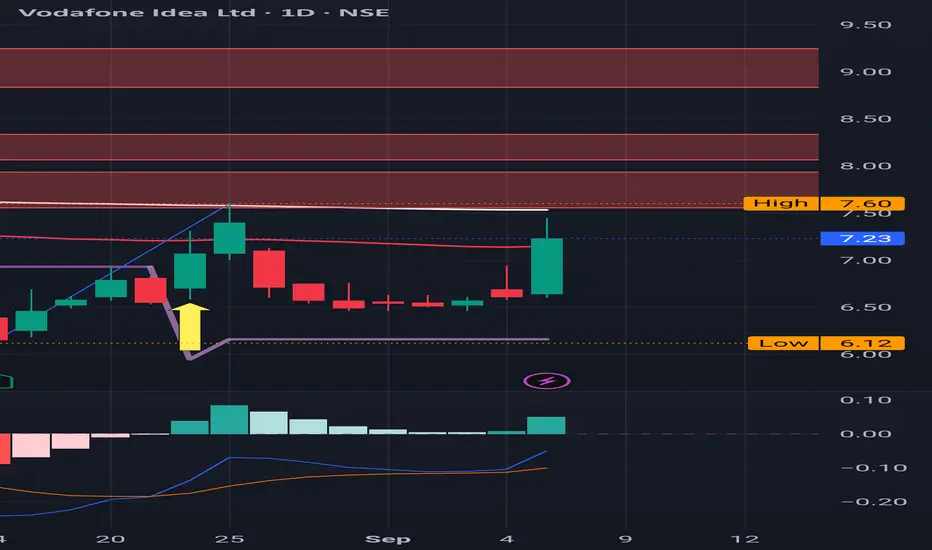
Making higher lows since years ( 2.40 then 2.70 then 4.55 then 5.70 )
After the last low (6.12 )it has given a good move up
A break of higher high (10.47) of the last leg down (19.17 to 6.12) indicated confirmation of the uptrend
This trade can double the amount invested in a short amount of time
Maintain SL, money management, understand the risk involve
Good luck
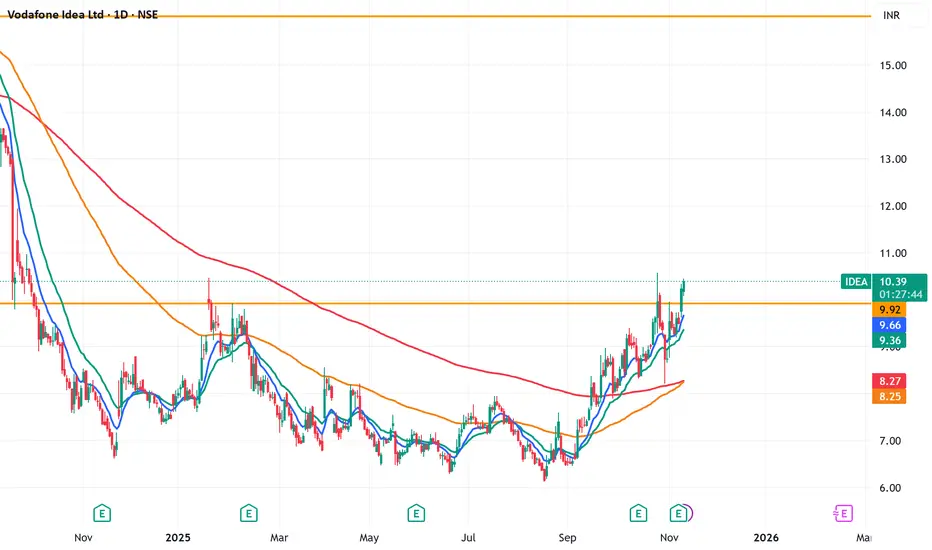
IDEA : Survived the Sell Signal IDEA : Survived the sell signal and managed to stay afloat above the Supertrend Indicator.
Important support level is @ 8.
( Not a Buy / Sell Recommendation
Do your own due diligence ,Market is subject to risks, This is my own view and for learning only .)

Looks like prominent shareholders are trying to rescue IdeaSolid accumulation at medium term support. Something seems to be cooking.
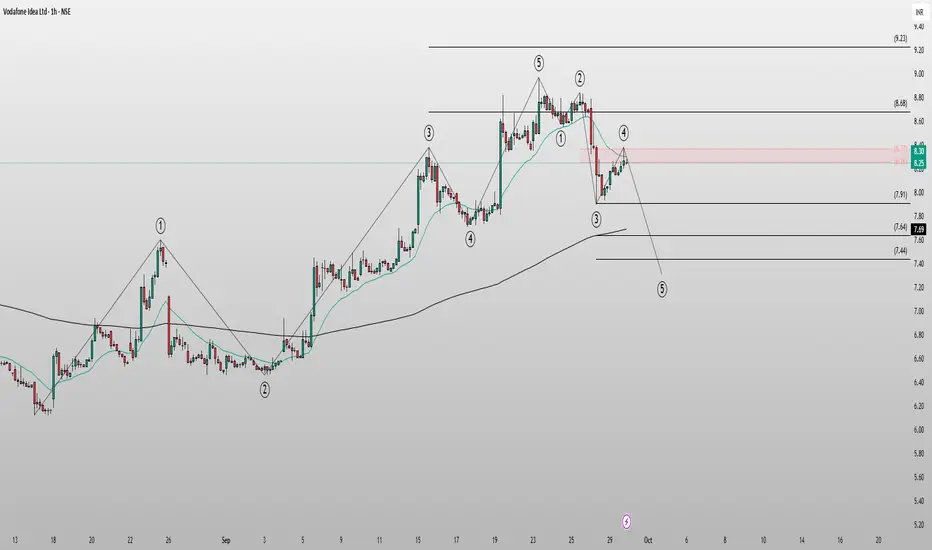
VODAFONE IDEA BEARISH WAVE 5The chart is showing a clear Elliott Wave structure. After completing a 5-wave bullish move, the price looks to be entering a corrective phase.
Current move suggests we are in Wave 4 correction, with Wave 5 downside still pending.
Key support levels: 7.91 / 7.64 / 7.44
Resistance zone: 8.30–8.37 (if broken, the bearish count may get invalidated).
This setup indicates further downside is possible if resistance holds, aligning with Elliott Wave theory.
⚠️ Disclaimer: I am not SEBI registered. This analysis is shared for educational purposes only. Please consult your financial advisor before making any investment decisions.
VodaPhone Idea to $12We have a very strong base with a breakout and retest of the descending trendline. Fib targets and volume support a move to the 1.618 extension at around $12, and possibly a full extension to the $14 level.

Idea : Breached the major Red Band Resistance Idea: Breached the Red Band Resistance. There was another Red Band Resistance at 9 to 10, which has vanished. So the only major resistance is the one that has just been cleared. Hoping to close above it today.
Momentum has picked up.
It's been closing above the 200 SMA for the past few sessions, which is a very important milestone. Already in a buy trajectory.
( Not a Buy / Sell Recommendation
Do your own due diligence ,Market is subject to risks, This is my own view and for learning only .)

vodafone is agreat idea to invest now vodafone idea making base formation looks to enter at cmp for target of 10,12,14

Idea : Major Red Band Resistance Levels
Idea : Major Red Band Resistance Levels .
Although in a Buy trajectory , " Red band Resistance " Levels must be cleared to progress further.
It is under 200 SMA ( White line ) since September 2024 for almost a year and failed to close above it which is also another important test for the script.
( Not a Buy / Sell Recommendation
Do your own due diligence ,Market is subject to risks, This is my own view and for learning only .)
IDEA : After a Buy Signal, sitting at a major Red Band ResistancIDEA : After a Buy Signal, sitting at a major Red Band Resistance
( Not a Buy / Sell Recommendation
Do your own due diligence ,Market is subject to risks, This is my own view and for learning only .)

finally vodaphone idea best place to catch bottom and hold hold hold in it, resistance is very far far away , and now exjackly bottom ha ehde wich

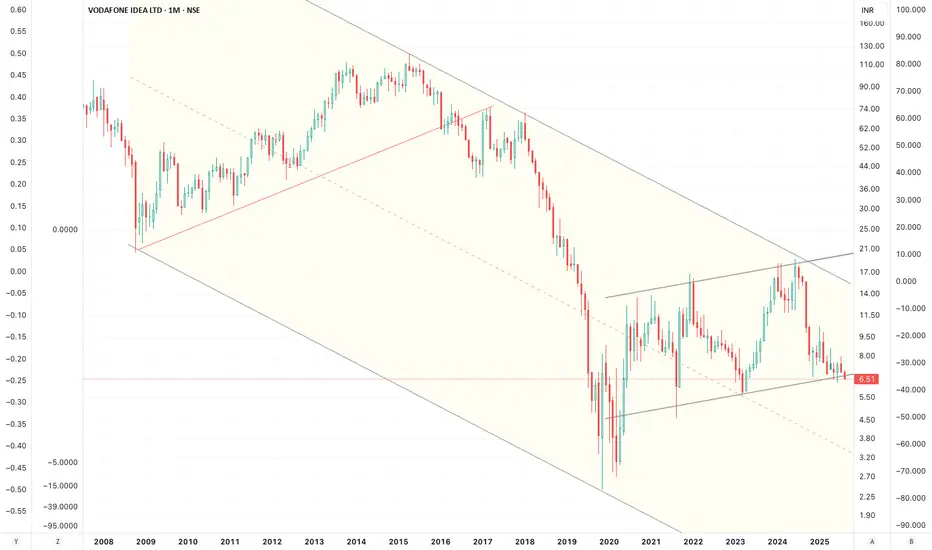
Idea Idea ( 20 years)
One picture which tells the Indian story of greed, investor apathy, political corruption, bureaucratic ineptness and rampant foolish behaviour by all kinds of investors.
This company has no future.
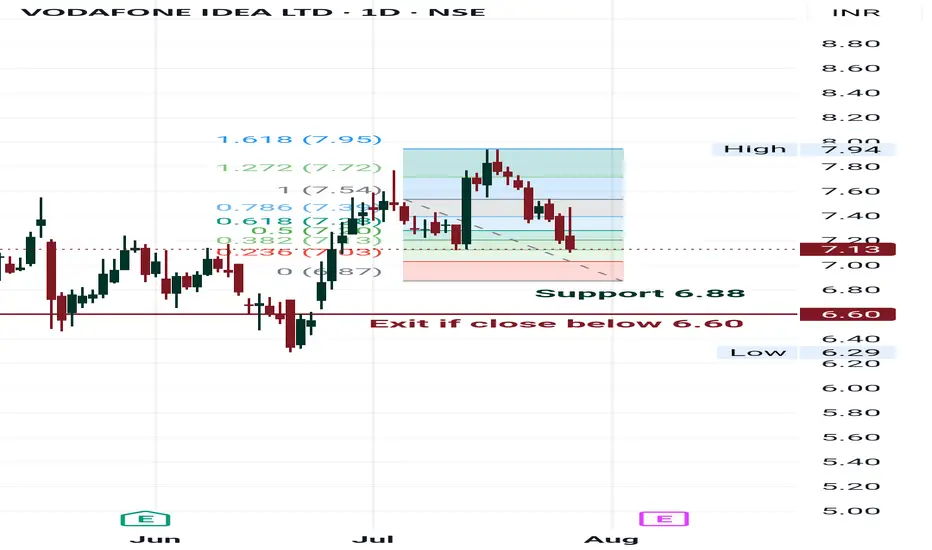
Idea buy at support Idea buy 6.88 , opposition calculation Fibonacci point.
Try to exit below 6.60 on close basis.
IDEA : Watch out for the Red Band resistances IDEA : Watch out for the Red Band resistances
( Not a Buy / Sell Recommendation
Do your own due diligence ,Market is subject to risks, This is my own view and for learning only .)
VI Stock(India) Looking for bullish Rally! {5/07/2025}Educational Analysis says that VI Stock (India) may give trend Trading opportunities from this range, according to my technical analysis.
Broker - NA
So, my analysis is based on a top-down approach from weekly to trend range to internal trend range.
So my analysis comprises of two structures: 1) Break of structure on weekly range and 2) Trading Range to fill the remaining fair value gap
Let's see what this Stock brings to the table for us in the future.
Please check the comment section to see how this turned out.
DISCLAIMER:-
This is not an entry signal. THIS IS FOR EDUCATIONAL PURPOSES ONLY.
I HAVE NO CONCERNS WITH YOUR PROFIT OR LOSS,
Happy Trading, Fx Dollars.


BULLISH PATTERN IN IDEANSE:IDEA
Trend Line Crossed, after strong consolidation.
Crossed successful 1st Lower Point 6.47.
Again closed above 6.77 (May be again Support, if any correction)
Successful closed above 7.01 (Previous 2nd wave low)
Finally Succeeded close above 7.21.

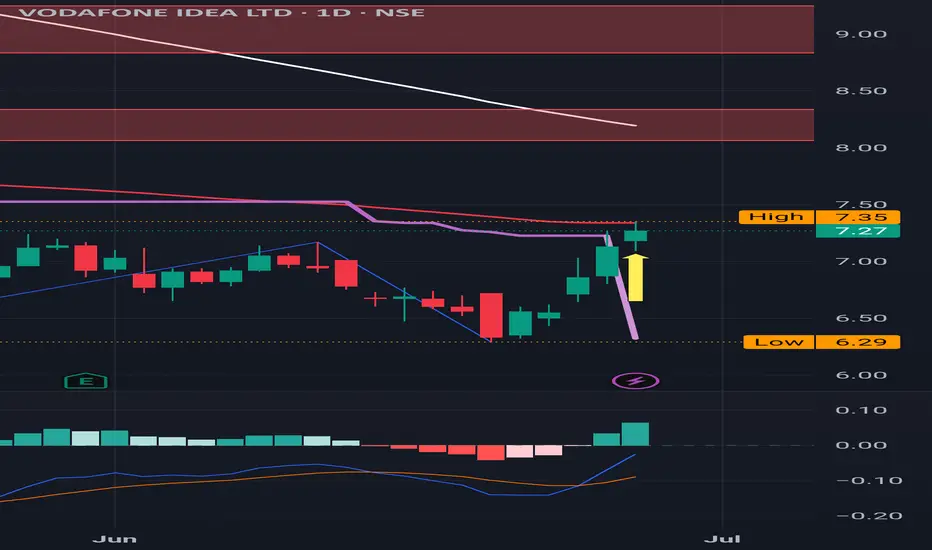
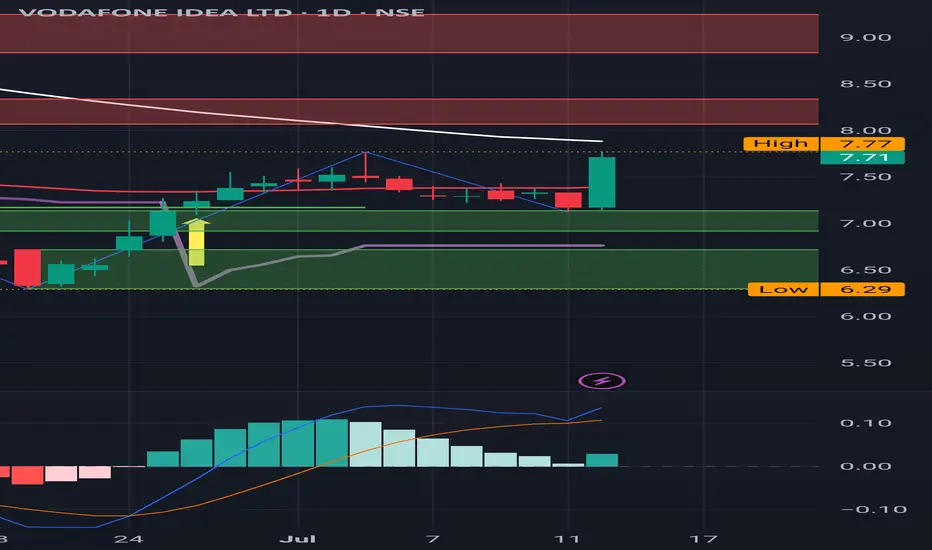
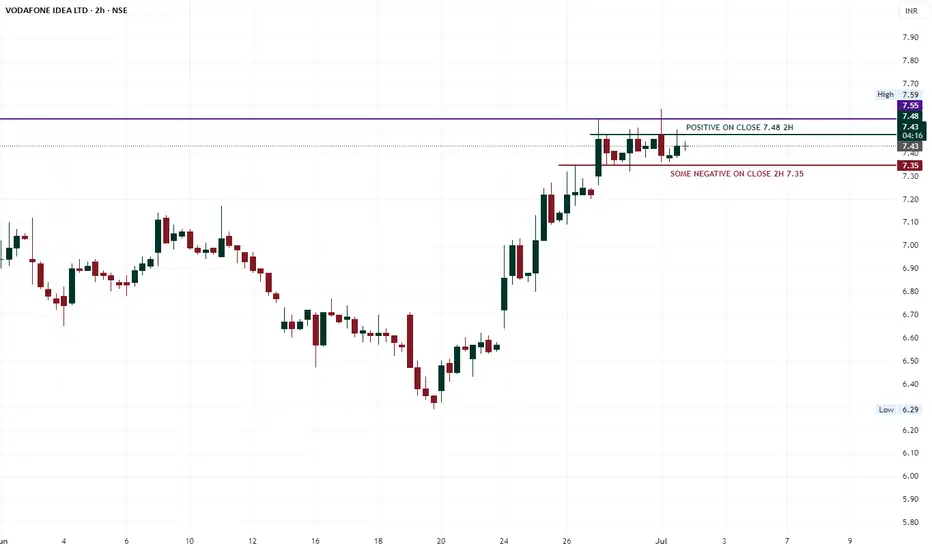
IDEA PATTERN ON PRICE ACTIONNSE:IDEA
If price run & close above only 7.48, then again possible move to up side.
But ma be some correction, if close below only 7.35 (2H)
May be very good sign, if close 7.61 (W)
Vodafone Idea: Moving to a Buy trajectory
Vodafone Idea: Moving to a Buy trajectory
Recovered quite well from the support with back to back Greens as displayed on the Chart
Tough road ahead with multiple Red Band Resistances.
MACD is positive almost approaching an important level of 0.
( Not a Buy / Sell Recommendation
Do your own due diligence ,Market is subject to risks, This is my own view and for learning only .)