Maruti Suzuki India looking for the Protraction Target Hello Guys
Using Smart money concept of Order block theory which suggests a short term upward move towards 16100 level which collides with a gap down opening.
Have a Great trading Day Ahead
Maruti Suzuki India Limited
No trades
Market insights

Maruti : Major Red Band Resistances Maruti : Major Red Band Resistances
( Not a Buy / Sell Recommendation
Do your own due diligence ,Market is subject to risks, This is my own view and for learning only .)

Maruti Suzuki Loses Traction – Short Trade Setup Ahead...!The market generally moves in a sequence of Trend → Consolidation → Trend, and Maruti Suzuki’s price structure over the past few months perfectly reflects this pattern.
During September, the stock witnessed a strong uptrend, supported by rising volumes and higher highs on the daily chart. However, throughout October, the momentum paused as the price entered a sideways consolidation phase between the ₹15,600–₹16,400 zone, indicating indecision among buyers and sellers.
At the beginning of November, Maruti Suzuki broke below the lower boundary of this consolidation range, signaling a bearish breakout. The stock is now sustaining below its previous support, suggesting that the bulls are losing control and a new downtrend phase may be unfolding.
From a price action perspective, a pullback (retest) toward the ₹15,600 level which now acts as a resistance zone could provide a favorable short-selling opportunity.
📊 Technical Outlook:
* Trend: Bearish continuation after consolidation breakdown
* Key Resistance (Retest Zone): ₹15,600
* Support / Target: ₹14,600
* Structure: Lower highs and lower lows forming post-breakout
* View: Sell on rise near ₹15,600 with a target of ₹14,600
💡 In summary, Maruti Suzuki has shifted from a period of bullish momentum to a corrective phase. As long as the price sustains below ₹15,600, the short-term outlook remains bearish, with potential for further downside movement.

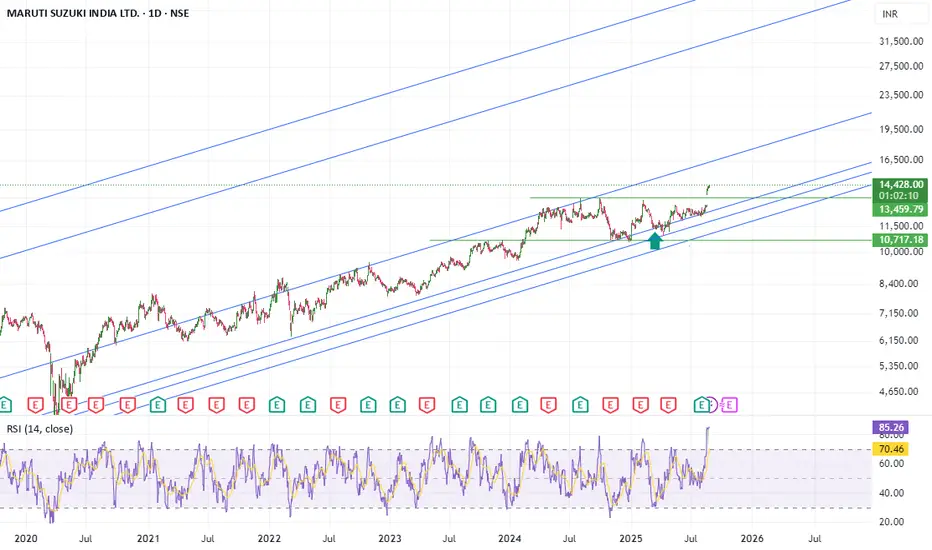
Maruti Suzuki Price Levels1. After a great stretch market may see a good retracement from higher levels.
2. If price breaks the trend line and sustains. may reach lower levels

Short Term SHort OpportunityShort Term SHort Opportunity , If the Price Falls below that then 1:2 Sell Trade can be made


MARUTI 16KMaruti would be touched by the levels leveled
There might be little bit difficulty to reach 16k
Note : Everything is Possible 😎😎

bullish rsi in it it have alreadu break its previous high , now it is going toward 16000 easily noe , that is chart is saying right now , on weekly frame rsi is above 70 v, which is called very very very bullish
Ascending Triangle Alert: Maruti Suzuki 15-Min Setup..!Maruti Suzuki is forming an Ascending Triangle pattern on the 15-minute chart – a potential breakout setup. Keep a close watch for confirmation moves.

Maruti short opportunity Maruti formed a weak green candle near the top. RSI 80+ shows overbought levels. Chances of a pullback are high & stock may fill the gap around 13,000.

Maruti : All Time High Maruti : All Time High .
On a monthly time frame , a buy signal was triggered on Jan 2022 at around 7400 level and since then it hasn't looked back and made an all time high of 14125 today .
What a marvellous run , just brilliant !!!
( Not a Buy / Sell Recommendation
Do your own due diligence ,Market is subject to risks, This is my own view and for learning only .)

Maruti
Current Price: 12257
Upside: 12806.50, 13261.75 and 13717.00
Downside: 10378.50, 9923.25 and 9468.00
Green lines represent the range. it's also the stop loss and resistance.
Stop loss: 11232.56
Resistance: 11955.48

Maruti Suzuki Maruti had been consolidating in this zone for the past 3 months. It has now given a breakout & may potentially move towards the 13500 range in the coming days.

Bearish Black Swan Pattern in Maruti ( Daily ) Bearish Black Swan Pattern in Maruti ( Daily )
pattern clearly suggest bearish move may come
invalidation level 13089 if close abv 13089 on daily pattern will be invalid
harmonic patterns always work on different price degree levels & angels created by specific price
This is pure educational based charts !!!!!

Ye chart kuch kehta hai : Maruti SuzukiMaruti Suzuki India offers a strong long-term investment case due to its dominant market position, steady earnings growth, strategic focus on EVs and exports, and healthy financials. While there are near-term margin pressures and industry growth challenges, these are largely seen as temporary, with the company poised for sustainable growth driven by new product launches and expanding export opportunities.
Maruti Suzuki India is generally considered a good stock for long-term investment based on several key factors:
Strong Market Position and Leadership: Maruti Suzuki is the largest passenger car manufacturer in India, holding a dominant market share. Its extensive product portfolio, including hatchbacks, sedans, and SUVs, caters to a wide customer base, providing stable revenue streams.
Consistent Revenue and Earnings Growth: The company has demonstrated robust financial growth, with total revenue rising from ₹677.89 billion in FY21 to ₹1.42 trillion in FY24, and net income increasing significantly over the years. Earnings per share (EPS) is forecasted to grow at about 9.5% annually, indicating steady profitability expansion.
Healthy Financials and Cash Flow: Maruti Suzuki maintains a strong balance sheet with low debt levels (net debt is negative, indicating more cash than debt), substantial cash reserves, and positive free cash flow, which supports operational stability and future investments.
Growth Catalysts:
Electric Vehicle (EV) Expansion: Maruti is positioning India as a hub for global EV exports, which is expected to be a significant growth driver. The launch of new EV models like the e-Vitara and the company's strategic focus on EV exports with a target of over 20% export growth from FY26 onwards enhance its long-term growth prospects.
New Product Launches: Upcoming SUV launches in FY26 are anticipated to boost market share and revenue.
Export Growth: The company is targeting strong export volume growth (over 20% YoY), which diversifies revenue sources and reduces dependency on the domestic market.
Valuation and Analyst Sentiment: The stock trades at a reasonable price-to-earnings (P/E) ratio of around 27.18 with a dividend yield close to 1%, which is attractive for a growth-oriented blue-chip company. Most analysts have a bullish stance, with many recommending a "Buy" and expecting a potential upside of approximately 16% from current levels.
Risks to Consider:
Margin pressure due to startup costs of new plants, higher R&D and advertising expenses, and commodity price volatility could impact short-term profitability.
Domestic industry growth is expected to be modest (1–2% in FY26), which may limit near-term volume growth.
Margin compression is a key risk to monitor, although it is seen as temporary with expected improvement once new plant utilization ramps up.

Maruthi suzuki long ....Chart Pattern: Volatility Contraction Pattern (VCP)
The chart displays a textbook Volatility Contraction Pattern (VCP), a bullish setup popularized by Mark Minervini.
VCP is characterized by a series of tightening price swings (each dip is shallower than the previous), signaling absorption of supply and a possible explosive breakout when resistance is cleared.
The resistance zone is clearly marked near ₹13,059–₹13,100, with the price currently consolidating just below this level.
Technical Indicators:
MACD (Moving Average Convergence Divergence): The MACD is positive and appears to be crossing above the signal line, supporting bullish momentum.
Volume: The volume pattern shows contraction during pullbacks and should ideally expand significantly on breakout for confirmation.
Moving Averages: Most moving averages (MA20, MA50, MA100, MA200) are in bullish alignment, supporting the uptrend.
RSI (Relative Strength Index): RSI is at 62.12, suggesting bullish momentum but not yet overbought.
Stochastic: Overbought at 98.3, so some caution is warranted for short-term traders.
Breakout and Target Levels:
Breakout Trigger: A daily close above ₹13,100–₹13,150 with strong volume would confirm the VCP breakout.
Targets:
First Target: ₹14,068 (previous swing high and psychological round number).
Second Target: ₹15,025–₹15,200 (projected from the height of the base and marked on the chart).
These targets align with the typical VCP breakout potential, which can yield 20–100% gains over several months if volume confirms the move.
Stoploss Levels:
Recommended Stoploss: Place a stoploss just below the most recent swing low within the pattern, typically around ₹12,400–₹12,500.
This level is just below the last contraction and provides a logical risk point if the breakout fails.....

Maruti : Approaching near Red Band Resistance Maruti : Approaching near a major Red Band Resistance as displayed on the chart.
( Not a Buy / Sell Recommendation
Do your own due diligence ,Market is subject to risks, This is my own view and for learning only .)

maruti is about to go high from here for swing trading.Maruti is about its monthly support 12257, as we all know auto is positive and nifty is also positive so I think Maruti is at its monthly support and can go up from hear. here we have good chance to enter for swing trading.

MARUTI SUZUKI is ready to touch buying zoneMARUTI SUZUKI is coming in its buying zone after touching it , it will move towords 13000, so lets see what happens

MARUTIi Observed these Levels based on Price Action and Demand & Supply which is my own Concept "PENDAM CONCEPTS"... Please don't take any trades based on this chart/post... Because this chart is for educational purpose only not for Buy or Sell Recommendation... Thank Q

Maruti Suzuki Chart Breakout Watch | Ascending Triangle PatternNSE:MARUTI
Maruti Suzuki is currently forming a bullish ascending triangle pattern on the 1-hour chart, indicating potential for an upside breakout.
1. Pattern Formation: The price is making higher lows while facing horizontal resistance near the 12,700 zone — forming a classic ascending triangle.
2. Support Zone: Trendline support is holding well, currently near 12,550.
3. Breakout Levels: A confirmed breakout above 12,700 could trigger a sharp move toward the next resistances at 12,888, 13,075, and possibly 13,454.
4. Bullish: Post-breakout, price action is expected to retest and then rally — as shown by the projection arrows on the chart.
5. Volume Confirmation : Watch for volume expansion on breakout to confirm strength.
Trading Plan:
Buy on Breakout : Enter long above 12,700 with targets of 12,888 - 13,075 - 13,454. Use SL below 12,550.
Wait-and-Watch : If price fails to break out, stock may stay range-bound or retest trendline support.
Conclusion:
Price action suggests strength building up. A breakout from this pattern could lead to a fresh rally — ideal setup for short-term swing trades

MARUTI KEY LEVELS FOR 13/05/2025// The core idea behind this indicator was sparked by a simple but powerful clue:
// 👉 "If you get one level, you get all levels."
// From that point onward, everything—the logic, calculation method, and application—has been developed independently through my own analysis and experience.
// I am not a seller, and no one taught me this system. This method is a result of my own effort and refinement.
///////////////////// Explanation /////////////////////
// This trading system is designed to eliminate blind trades by offering confirmation-based entry and exit points.
///////////////////// Entry/Exit Strategy /////////////////////
// - Use the BLACK line for long trades, and the RED line for short trades, in line with confirmation from your trading plan.
// - Stop Loss:
// - For long trades: below the RED line.
// - For short trades: above the BLACK line.
// - Take Profit:
// - For long trades: target the next RED line above.
// - For short trades: target the next BLACK line below.
///////////////////// Recommended Timeframe /////////////////////
// Use on a 5-minute chart for best results.
///////////////////// Disclaimer /////////////////////
// This setup is shared purely for educational purposes.
// I am not responsible for any gains or losses that may result from its use.
// Always use your own judgment and risk management.

Chartamentals (Charting + Fundamentals) : MARUTIPrice-to-Earnings (P/E): 26.58; Trailing P/E aligns with auto industry median.
Price-to-Operating Cash Flow: ~13.5 (estimated); Reflects strong cash conversion.
Strategic Advantage: 45% passenger vehicle market share in India, Suzuki partnership.
Strong Financial Health: Debt-free, ₹14,500 Cr profit, 91/100 solvency score.
Fundamental Summary: ₹157,935 Cr revenue (FY25, +10.7%), overvalued at ₹11,025 intrinsic value vs. ₹12,677 price.
Price and Trend Data: ₹12,677 (May 2, 2025), +58.81% 3-year, underperforms Nifty Auto (+101.29%).
Price Momentum: +3.52% daily, -3.98% 1-month, short-term downtrend.
Moving Averages Indicate: Below 50-day (₹12,300), 200-day (₹12,500), bearish signals.
Relative Strength Index (RSI): 47.6 (14-day), neutral, nearing oversold.
Volume and Sentiment: 2.59L shares daily, declining volume, neutral sentiment.
Technical Summary: Bearish daily signal, neutral MAs, weak oscillators, RSI suggests potential oversold state.
Conclusion: Strong fundamentals (market leadership, debt-free) offset by bearish technicals, cautious market stance.
this is just for educational purpose only. Not buy or sell recommendation
