TCS - Price Action Analysis NSE:TCS is soon to Fill-up their gap but there is a plot.
As you can see the previous day was created as shooting star candle which indicate sellers would not allow to go price further and also you can see it has touched 61.8% of Fibonacci level at 3757. So both scenario strongly says that price could take reversal.
But any Gap up above 3557 leads price up to 3800 and any gap down below previous day candle leads price to 3615.
BUY : Buy above 3557 or wait till if price corrects up to S1 (3614-3641)
SELL : short trade might not recommended but if any support breaks you can take it or you can play reversal at resistance after confirmation candle occurs.
TCS trade ideas

TCS chart analysis TCS chart analysis
This is my study on TCS, We will see resistance in 3700 to 3760
possibly the upper will break and after breaking 3760 targets of 3850 is not away.
TCS double W formationTCS need to fill the gap but for now it will downtrend and will rise after given entry

TCS Is Looking Good For SwingWhat we believe in :-
°Trade With Logic
°Take Time Before Investment
Saving Your Capital 🙂
I'm not responsible for your profit or loss.
Mainly Stock & Crypto Investor 🕵️
| Interim Trader 📊
DISCLAIMER :- This Channel Is For ( EDUCATIONAL PURPOSES )


Solid Breakout In Tcs IT sector has given the breakout and some of the stocks have given breakout TCS is still left can have big targets, atleast it's very good for intraday.
Long above 3640
Targets 3660/3680/3700
Stoploss 3630

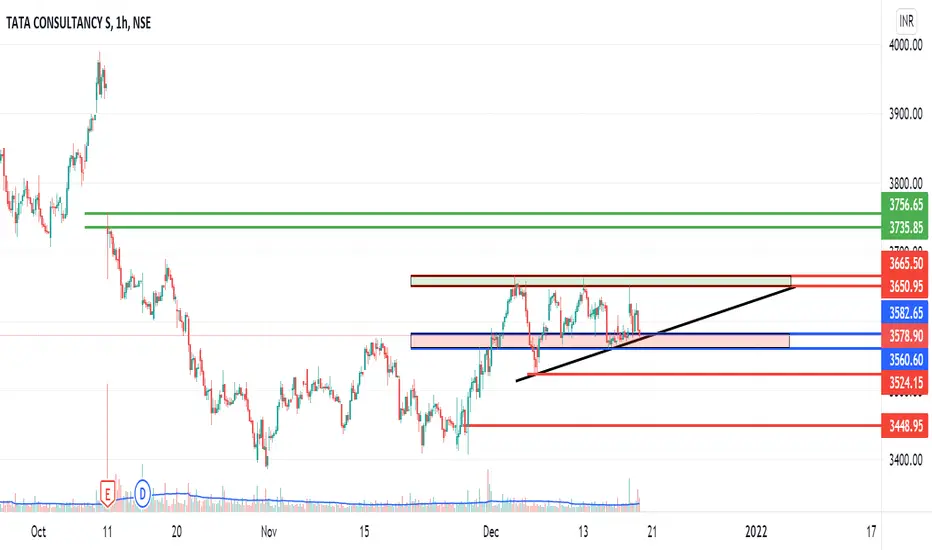
TCS AnalysisResistance Zone: 3650-3665
Upside Target: 3735-3756
Support Zone: 3560-3582
Downside Target: 3524,3448

TATA Consultancy (TCS) May Fall, It can be Shorted 24/02/2021 Tata Consultancy Services Limited (TCS) is engaged in providing information technology (IT) services, digital and business solutions. The Company's segments include banking, finance and insurance services (BFSI); manufacturing; retail and consumer packaged goods (CPG); telecom, media and entertainment, and others, such as energy, resources and utilities, hi-tech, life science and healthcare, s-Governance, travel, transportation and hospitality, and other products. Its services portfolio consists of IT and assurance services, business intelligence and performance management, business process services, cloud services, connected marketing solutions, consulting, engineering and industrial services, enterprise solutions, IT infrastructure services, mobility products and services and platform solutions. Its software offerings include Digital Software and Solutions, TCS BaNCS and TCS MasterCraft, among others. It serves industries, including insurance, healthcare, retail, telecom and others.
Technical:
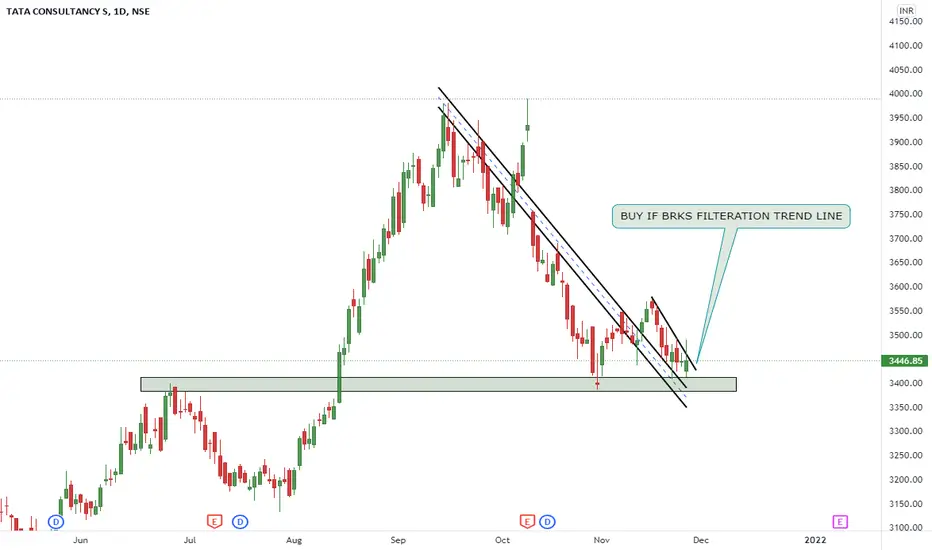
as we can see the price was in a bullish channel and it has now broken the lower boundary of the same channel
there exist bearish Divergence with MACD and MACD Histogram which is the sign of trend reversal and we can be sure after some candle confirmation that this Ticker is going to fall if the Channel break is confirmed by some candle pattern.
as of now we can have an eye on it for shorting it after some confirmation

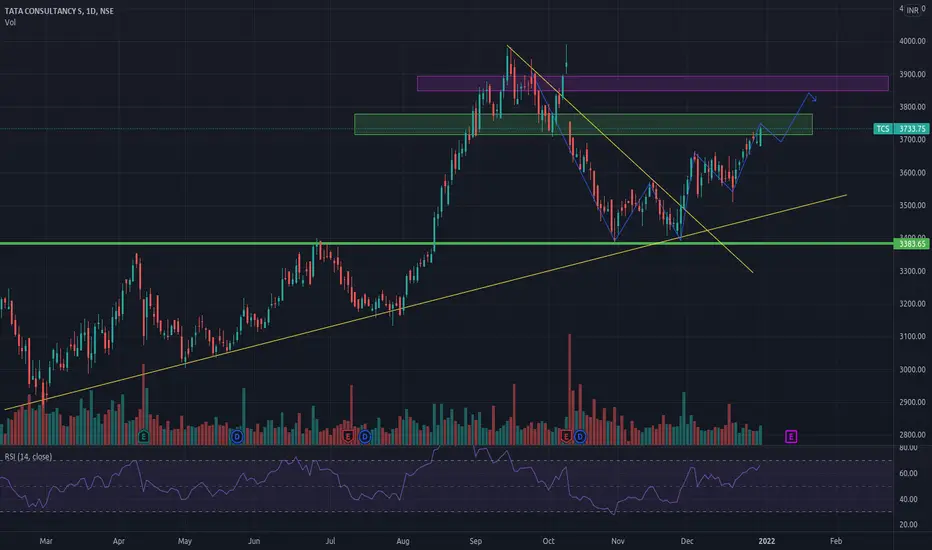
TCS - Change of polarityTCS weekly chart shows breakout retest done & 5-6 weeks base created around support zone. Double bottom pattern with neckline breakout above 3577 last week seen. Need to see a follow-up buying and increase in relative strength, this week to confirm reversal for uptrend towards ATH levels.
Only for educational purposes. Not a buy/sell recommendation.


tcs may be bullishwait for confirmation and price movement on support level high change trade only intraday

TCS breakout till 15th of November.TCS is having is having a 1year support level at 3360 so strong chances are to hold at the moment. Right now it is in consolidation but will have no space to consolidate after the 15th of November leading to breakout having a price target of 4000.

TCS short termTCS trying to outperform the benchmark nifty
Supertrend also turned positive on 2 hour chart
Likely to remain bullish till above 3400 level
Momentum may start above 3575-3580
Small w pattern formation on chart

TCSNSE:TCS
Please note that we are not a SEBI Registered Investor Adviser/PMS/ Broking House.
All the contents over here are for educational purposes only and are not investment advice or recommendations
offered to any person(s) with respect to the purchase or sale of the stocks / futures and options.
You are also requested to apply your prudence and consult your advisers in case you choose to act on
any such content available as WE claims no responsibilities for any of your actions or any outcome of
such action

TCS SHORT-TERM SWING TRADE!TCS short-term swing trade consider buy above 3,535 Targets 3,595 & 3,655 Stoploss 3,480
LOGIC BEHIND TRADE : Price structure going upside & stock bounced from it`s previous resistance looks good for short term swing trade, to identify i use harmonic xabcd pattern level 0.886 PRICE (3,655).
NSE:TCS

TCS Weekly ChartTata Consultancy Services
CMP 3526
Buy In Dips
Trading At Near Support Level
Immediate Support At 3253
Long Term Support At 2890

TCS levelsTCS shows good support at 3391 also taking support on on trend line from Mar20 (3436), and closed above EMA20 on weekly chart. Seeking target of 3800

TCSImportant levels.............................................................................................


Tcs Looking Very Strong Near Day Support Zone 3390 - 3350 Tcs Looking Very Strong Near Day Support Zone 3390 - 3350
Strong Reversal Seen In Tcs After Retest Previous Breakout
Tcs Big Buying Opportunity Cmp 3490 - 3500 Spot
Stop Loss Below 3350
Target 3900 4200 4500 +++

