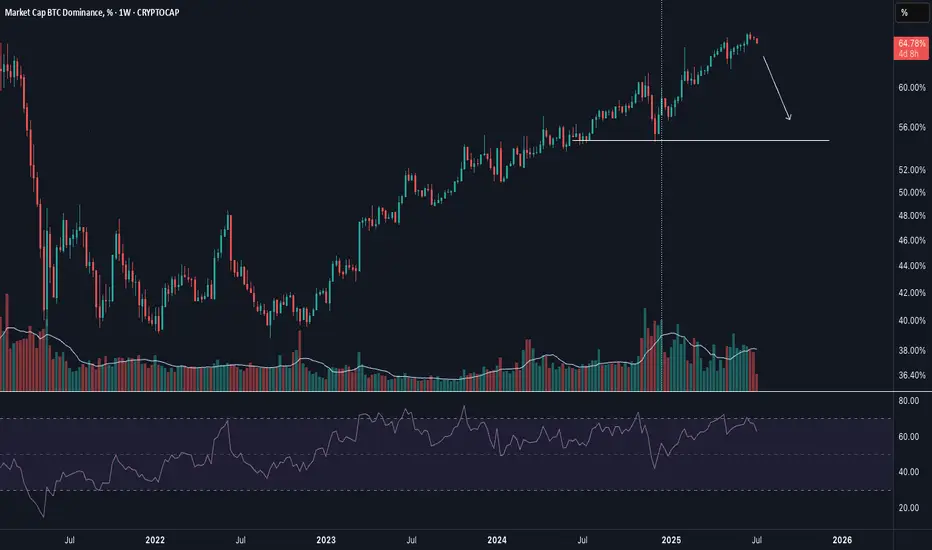
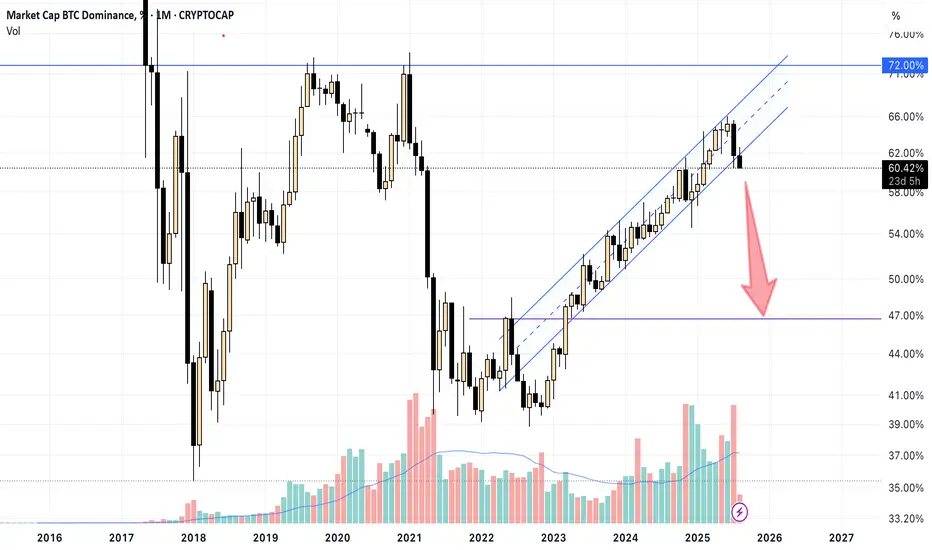
Violent DeclineBitcoin market share % looks ready to drop off a cliff. Took awhile to roll, but the moment has come. Altseason has arrived.
Trade ideas
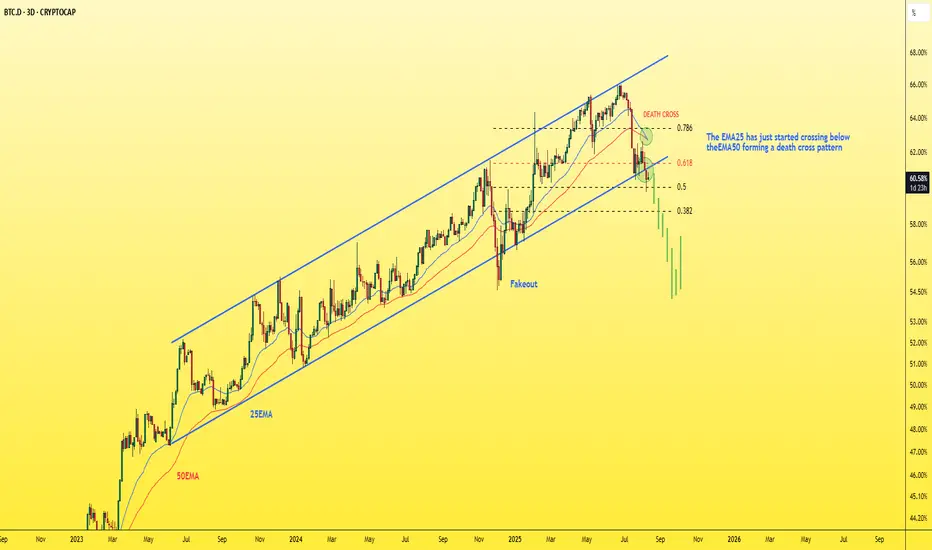
Dominance - Deep dive into Dominance chart!Did you know that dominance is on the verge of collapsing in the coming days? Let me tell you why.
🔸On the 3-day dominance chart:
- We have the beginning of a break of the ascending channel, a close below it, and a retest.
- There’s also a break of an important support level at 0.618 Fibonacci, followed by a retest, and it’s currently trading below it.
- Plus, we have a death cross where the EMA25 crossed below the EMA50.
That’s three confirmations on one chart — can you imagine?
The coming days will likely see a strong pump in altcoins. Remember my words.
Best Regards:
Ceciliones🎯
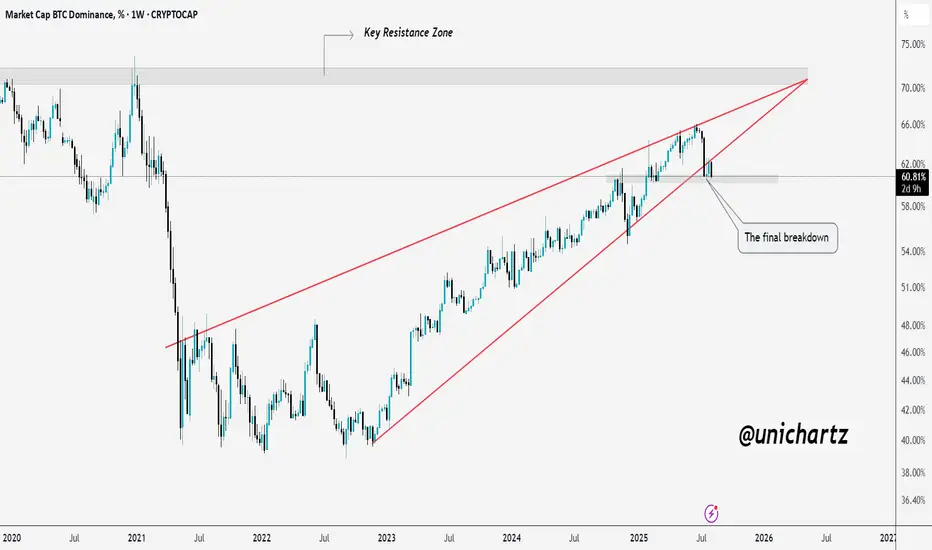
BTC Dominance Breakdown – Altseason 2025 Loading? The BTC Dominance chart is flashing a familiar pattern we last saw before the explosive 2021 Altseason — and history might be about to rhyme. Let’s break it down:
BTC Dominance has once again tapped the same multi-year resistance trendline (red line).
Price has been riding a rising wedge since early 2022 — a pattern that typically resolves to the downside.
Last week, dominance rejected from the resistance zone and broke below wedge support.
Key Technicals:
Resistance Trendline: Serving as a multi-year ceiling since 2019.
Support Trendline: Rising wedge support now broken, opening the door for a deeper decline.
Current Level: 60.81% — sitting right below the breakdown zone.
What This Means for the Market:
If dominance continues to fall, altcoins could see significant capital inflows.
A sustained drop could trigger an Altseason 2.0, with high-beta alts outperforming BTC.
Watch for BTC to consolidate or move sideways — this typically accelerates altcoin gains.
Confirmation & Invalidations:
✅ Bullish for alts if:
Dominance closes weekly candles below 60%.
Momentum builds to retest lower dominance support levels (50%-55%).
❌ Invalidation:
A reclaim of wedge support + breakout above 67% would kill the altseason narrative in the short term.
📌 Conclusion:
BTC Dominance is at a critical turning point. History suggests we could be on the verge of a powerful altcoin cycle if the breakdown sustains.
Patience and positioning are key — the biggest alt rallies start when most traders are still skeptical.
💬 What do you think — are we about to witness Altseason 2025? Drop your thoughts below.

BTC Dominance Analysis with Bitcoin & Ethereum,BTC Dominance Analysis on BTC & ETH over Altcoins Season Start to End Journey. Be Ready Game is start Now.

BTC.D , Bitcoin Dominance Ready to RiseAfter a descending wedge pattern, Bitcoin Dominance has shown the first signs of an upward move. A CHoCH (Change of Character) has formed on the 4-hour timeframe, signaling a potential trend reversal.
We are now awaiting a retest of the broken resistance level before continuation of the bullish trend. However, the price might skip the retest and proceed directly higher.
Stay tuned for confirmation and manage your positions accordingly.

Alts Crypto Game PlanAs you can see the triangle at BTC dominance has met the minimum norms.
I think:
1) The setback will reach 0.382 - 0.5% level of the micro degree, after which we may see another decline to finish the micro degree 5.
2) A Zizgzag, correcting the Minor degree 5.
3) And another intermediate 5-wave downward wave, because the first 5 downward waves are usually never the end. It is usually a complex double combined zigzag.


BTC Dominance Mirroring 2021In 2021, Bitcoin dominance respected this key trendline twice before breaking, which triggered a 35% dominance drop in just 3 months and one of the largest altcoin rallies in recent history.
Today, we see a similar technical setup unfolding:
Cycle 1 (2021): Bounce → Break → Alt-season
Cycle 2 (2025): Bounce → ???
If the trendline breaks, we could see capital flow from BTC into altcoins at scale, potentially marking the next major market rotation.
I’ll be watching closely for a confirmed break and weekly close below.
📊 Do you think this time will be different?

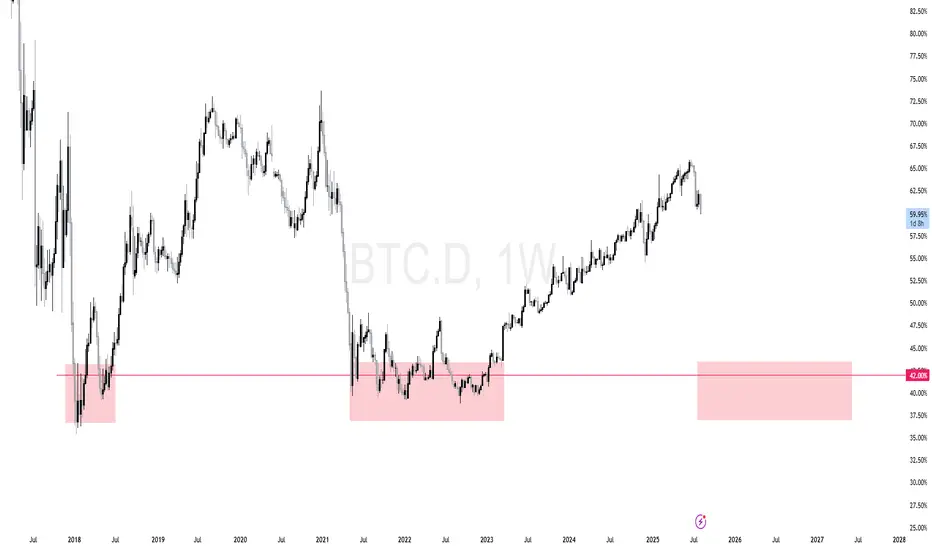
Timing the Crypto MarketBitcoin dominance measures the percentage of the total crypto market cap held in Bitcoin. As crypto investors, it’s one of the most valuable indices we can use to time market cycles. My personal strategy, proven over years of investing, is straightforward:
When Bitcoin dominance is high, I start accumulating altcoins.
When Bitcoin dominance is low, especially around the 42% zone, I take profits on altcoins.
This simple principle has helped me consistently enter and exit the market at the right moments.
Looking at the current Bitcoin dominance chart, we’re still sitting around 59%. This means a large portion of market capital is still concentrated in Bitcoin, and the significant money flow into small-cap altcoins hasn’t begun yet. In other words, altseason is just getting started.
For now, patience is key. The bigger moves in altcoins are likely ahead as capital rotates out of Bitcoin and into the broader market.
Dominican bitcoin selllThe start of the biggest alt season
Ethereum 7500
Ada 5$
Shiba 0.001
Altcoins longggggggggg
🤪🤪🤪🤪

BTC.D Has Started a Monthly Downtrend — Altseason, With CautionBTC.D Has Started a Monthly Downtrend — Altseason, But With Caution
Market data shows that BTC Dominance (BTC.D) has likely formed a peak on the monthly timeframe and is now entering a downward slope that could last for the next few months.
However, TOTAL, TOTAL2, and TOTAL3 still indicate sustained capital inflows into the crypto market. This suggests that profits taken from BTC are being rotated into the rest of the market rather than exiting entirely.
That said, investors should stay alert: Crypto TOTAL is in the process of forming a macro top. When this top completes, we may see significant capital flowing out of the crypto market.
The current altcoin wave is still relatively short and hasn’t reached the explosive phase of a full-scale bull run. Exercise caution before TOTAL, TOTAL2, and TOTAL3 complete their monthly tops and shift into a corrective phase.

Hoho BTCBitcoin’s recent consolidation above key support levels suggests strong buyer interest, with market sentiment shifting toward accumulation.
Technical indicators like rising moving averages and bullish RSI momentum reinforce the potential for an upward breakout.
Macro factors, including institutional adoption and decreasing exchange reserves, point to a supply squeeze scenario.
A break above resistance could trigger a sustained rally, making the current setup favorable for a long BTC position.
Eth/Btc vs Bitcoin Dominance Ethbtc parity and bitcoin dominance parabolic curve breakout occurred. bitcoin dominance down ethbtc will start the up process

BTC.D Distribution ModelBTC.D finally confirmed it's distribution model. Technical target is the range low, invalidation above the high.


Btc dominance crystal ballJust publishing a version of btc dominance over the next year.
Highly speculative and just based of time fibs and levels I'm eye balling

BTCD Bear Market Confirmed · Altcoins Bull Market ConfirmedThis is a rising wedge pattern and it broke for the first time after 792 days. We are looking at Bitcoin Dominance (BTC.D) on the monthly timeframe, super long-term.
A classic long-term double-bottom in 2022 launched a massive uptrend. This uptrend developed within a perfect rising wedge. Last month BTC.D broke this pattern with a full red candle and the highest volume since November 2024.
To add some perspective, the highest volume months were last month (red) and November 2024 (red). The highest volume before these two only happened during the climax of the 2021 bull market, so you can have an idea how strong the volume is this time around.
Since Bitcoin Dominance has an inverse relation with the growth in prices of the Cryptocurrency an Altcoins market, when Bitcoin Dominance was ultra bearish and crashing down, 2021, the Cryptocurrency market was ultra bullish and moving up. Seeing this major long-term signal, the highest bearish volume month to break a 792 days long uptrend, reveals the start of another major crash on this index. The major crash on this index is the confirmation of the late 2025 altcoins bull market.
Bitcoin and the altcoins market will continue growing on all terms.
Thanks a lot for your continued support.
If you agree, leave a comment.
Namaste.

The channel is broken. BTC dominance might drop from here.The channel is broken. If BTC dominance drops from here, altcoin season is on. 🤞
If might drop to about 47%
If $BTC.D breaks down the green box we'll see Altcoins running If CRYPTOCAP:BTC.D breaks down the green box we'll see Altcoins running 💨

Is It Time for Alts? | 8-8 Double Luck Live Update🤩🍀 Is It Time for Alts? | 8-8 Double Luck Live Update 🐉💫
8-8 -2025 — In Chinese culture, 88 means double fortune, and in numerology it’s the angel’s number for alignment and abundance.
Feels like the perfect day for a market check.
Ethereum (ETHUSD)
✅ Tagged $4,000 exactly as tracked in my Unicorn Breakout ideas (Part 1 & Part 2).
💨 First-touch rejection is normal — needs time to reload for any break above $4K.
Bitcoin (BTCUSD)
⚡ Holding above 115,800 — key structural support.
📈 As long as we stay here, bullish bias remains intact.
🎯 Next upside targets: 120k – 138k.
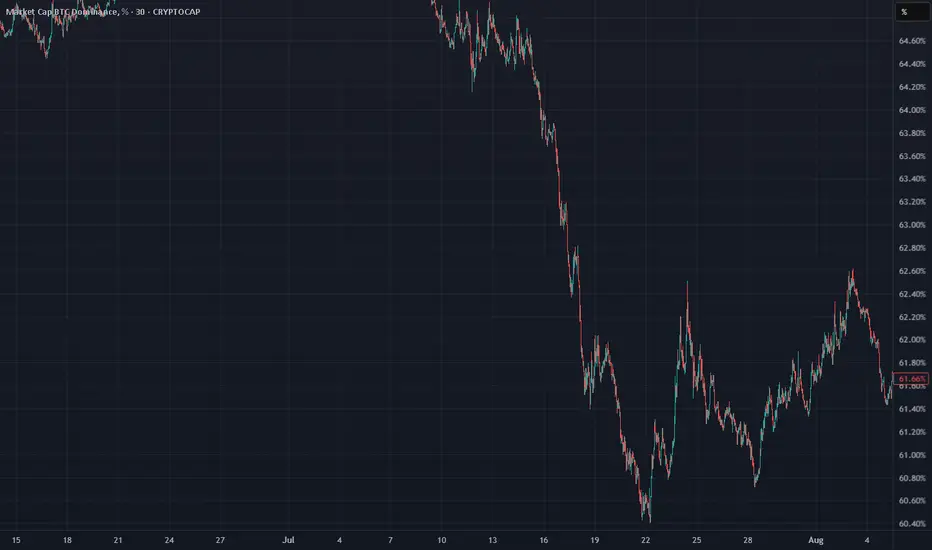
Bitcoin Dominance (BTC.D) — The Game-Changer
📉 Finally dropped under 60.80%, which is now major resistance.
💎 Staying below this favors altcoin strength, as long as BTC stays stable or climbs.
⚠ If BTC.D reclaims 60.80%, the edge shifts back to Bitcoin leadership.
Altcoins Outlook
✨ ETH’s $4K tag sets the stage for alt rotation.
🔑 Conditions look favorable when:
BTC > 115,800
BTC.D < 60.80%
💥 Weekend could be strong for selective alts.
S&P 500 (SPX)
📊 Still in the same range since rejection at resistance.
🚦 No breakout yet — waiting for a catalyst.
Summary:
ETH hit $4K, now consolidating.
BTC stable over support.
BTC.D under resistance = potential “Alts Window.”
SPX sideways.
Plan: Hunt for strong alts while BTC.D stays under 60.80%. Guard BTC’s 115,800 support like a hawk.
📊 Charts attached: BTCUSD, BTC.D, ETHUSD, SPX
One Love,
The FXPROFESSOR 💙
Disclosure: I am happy to be part of the Trade Nation's Influencer program and receive a monthly fee for using their TradingView charts in my analysis. Awesome broker, where the trader really comes first! 🌟🤝📈

Altcoin Bulls Watching This Retest CloselyBTC Dominance has cleanly retested the breakdown from its rising wedge pattern after failing to break the key resistance zone.
This retest is a critical point if sellers maintain control here, dominance could trend lower toward the next support range, potentially sparking an altcoin relief rally.
However, a reclaim above this breakdown zone would invalidate the bearish setup and shift momentum back in Bitcoin’s favor.
DYOR, NFA
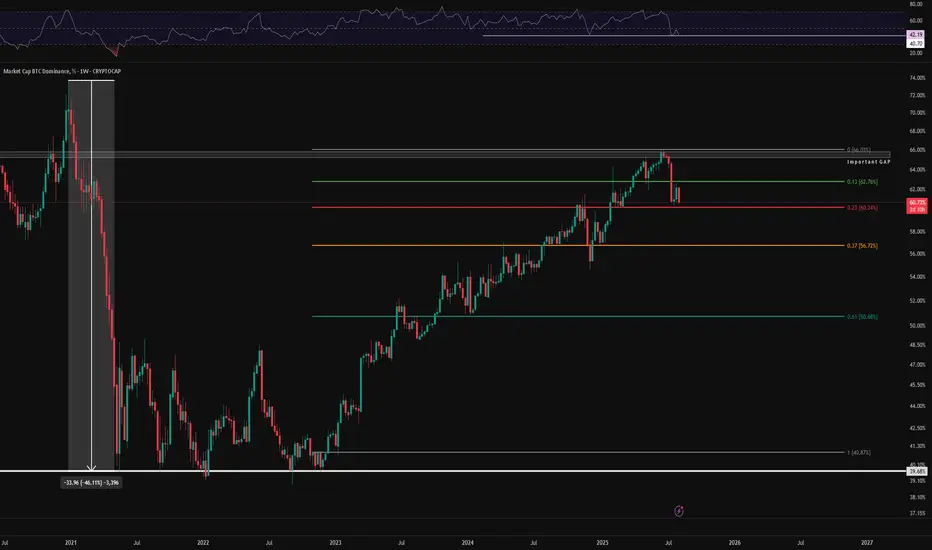
BTC.D Are We in bullrun ? | BTC.D on Fibonacci Level💀 Hey , how's it going ? Come over here — Satoshi got something for you !
⏰ We’re analyzing BTC.D on the 1-Week timeframe .
🔜 On the weekly timeframe of Bitcoin dominance, here’s what we observe :
👀 In the weekly Bitcoin dominance chart , we had a sharp 46% drop after the Bitcoin halving in 2021, which led to the altcoin party .
🎮 Today, for the first time , its figures were adjusted and turned into a custom Fibonacci , drawn on the chart as follows :
Our starting point in the Fibonacci is at the beginning of 2023 , from the breakout above 40.87 to the peak at 66.03, which, in terms of timing, coincides with the Bitcoin halving .
A strong rejection from the 0 Fibonacci level caused a move towards the 0.13 level . A strong whale candle broke below this level , followed by a pullback to it, and then we moved towards the 0.23 level. With a break below the 0.23 level and losing that low , we can say that our bull run has started .
⚙️ Our key RSI zone is drawn at 41.49 . On the first touch of this area , we bounced and moved towards the 50 level , but were then rejected from 50 and moved towards the current low . Once this low is broken , we can say the altcoin party has begun .
❤️ Disclaimer : This analysis is purely based on my personal opinion and I only trade if the stated triggers are activated .
$BTC.d Peekaboo20 mins for NY
bored so waiting to see if corn defends $115720 and flips 117500ish downtrend line
yellow thick line still our line in the sand
shall keep an eye on the monthly rsi seems to be curling up so could go for yellow thick line again but then get knocked back down
either way fun soon .. easy on the leverage wait on daily close and expect a reaction at trend line circ 60.5
