BTC.D UPDATEBitcoin dominance has been in support since 2022. If this down breaks, the altcoins will fly. It is very important for us.
Trade ideas

Bitcoin dominance analysisIf you doubt my analysis, read my previous analysis on Ethereum and Bitcoin.
Bitcoin dominance is moving towards 60% support but I don't think it has the strength to break it. Why? Divergence in "new RSI" as I SHOWN. I think we will have a small Pull back on Major Altcoins like Ripple for the coming days.
This analysis is not a financial recommendation. Crypto is a very risky market and you may lose some or all of your money in it. Especially futures trading.

Bitcoin DominanceI'm hating it if I have to apologize to that lady who said stablecoins were going to prevent Bitcoin from closing the gap in the chart. So far, she's right, and that's aggravating.
So far, the ratio is still in the bullish channel. It has not broken down, but it is staring at yet another retrace of the top of the descending fib channel, so.....
It remains to be seen what happens. I'm still predicting a 95% test. It may come soon, or it may come later, but the price, or in this case the ratio, is drawn to the gap close - make no mistake.
I've been pointing to the stock to flow model for a while now. If you haven't looked it up, and plotted Bitcoin price over it, then you haven't even begun to do your due-diligence.
A real paradigm shift in Bitcoin price could bring about that gap close, just sayin


Altcoin Season Still Nowhere in SighThis cycle is shaping up very differently for altcoins compared to what we’ve seen in the past. Typically, about a year after the Bitcoin halving, altcoins begin to rally hard against their USD pairs, with the run generally continuing until Ethereum tops out — which usually happens in Q4 of post-halving years. However, this time around, altcoins have remained largely dormant. With the exception of the pre-election pump in 2024 — when retail traders prematurely priced in perfection without fully grasping what lay ahead — the altcoin market has barely moved.
To better visualize this, I’ve overlaid BTC Dominance (BTC.D) with the ratio of (TOTAL3 - USDT) to BTC. On that overlay, the 0.25 level stands out as a key historical marker. In previous cycles, once that 0.25 level was hit, BTC Dominance would peak and then drop rapidly, marking the beginning of the blow-off phase for altcoins. Ethereum and other major alts would then play catch-up, often resulting in massive upside. But as of now, we haven’t even touched that level, and BTC.D remains elevated.
This deviation from past patterns likely stems from growing institutional interest in Bitcoin. Unlike previous cycles, capital is not flowing into altcoins at the same rate. Bitcoin has increasingly positioned itself as an asset in its own league, attracting large-scale investors who are ignoring the broader crypto space. That institutional support is creating a clear separation between Bitcoin and the rest of the market.
I still believe we’ll eventually see an altcoin season, but it hasn’t happened yet. For that to occur, we need to see the 0.25 level on the TOTAL3/BTC chart get hit and for BTC pairs of altcoins to bottom. Only then will the conditions be right for altcoins to rally and for Ethereum to begin its catch-up phase. Until then, patience is critical.

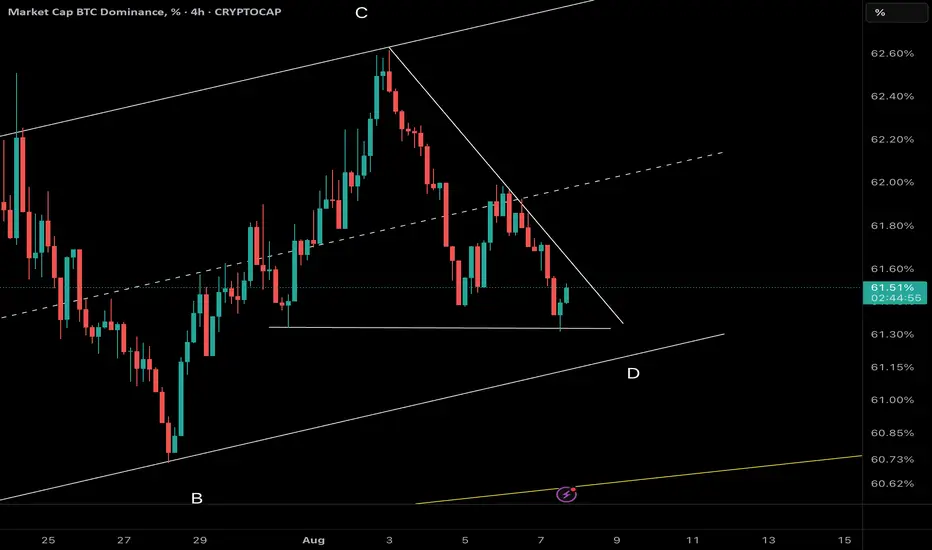
Bitcoin Dominance at Critical Juncture – Triangle Breakout Could🔍 Technical Overview
Bitcoin Dominance has declined from 62.6% to around 61.3%, forming a clear corrective leg within a rising channel. This drop has currently paused at a major static support, where price action is consolidating in a contracting triangle pattern near the channel’s lower boundary.
⸻
🧠 NeoWave Interpretation
We are likely in the final stages of Wave D of a larger Diametric structure, unfolding within a rising channel. The correction from 62.6% resembles a complex, slowing wave D that may be near completion.
Two key scenarios are now in play:
1. 🔺 Breakout of the triangle’s upper boundary would mark the start of Wave E, pushing BTC Dominance higher and triggering a sell-off in altcoins.
2. 🔻 A breakdown of static support (61.3%) would likely be short-lived, as the channel’s lower trendline may provide dynamic support — still leading into a bullish Wave E.
⸻
📊 Smart Money Summary
• 🟡 Wave D likely completed near a strong confluence zone
• 🔼 Watching for a triangle breakout — potential early signal for Wave E
• 🟥 Failure of altcoins to maintain strength supports this thesis
• 🧭 Bias remains bullish BTC.D unless 60.9% channel support decisively fails
⸻
🎯 Strategy Outlook
In such wave structures, Wave E tends to be sharp and sentiment-shifting. With BTC.D sitting on strong support and consolidating in a terminal triangle, exiting altcoins before a breakout is a risk-averse decision.
⸻
✅ Conclusion
BTC Dominance may be at the end of Wave D. If the triangle resolves to the upside, expect dominance to climb rapidly — likely reversing the recent strength seen in altcoins. A bullish Wave E appears imminent unless invalidated.
⸻
📌 Save this analysis
💬 Share your altcoin views in the comments
Bearish Head and Shoulder Pattern = Bullish As you can see, a bearish Head and Shoulders pattern is forming on the BTC dominance chart, specifically on the 4-hour timeframe. The neckline has already broken down, which indicates potential downside movement in dominance. This could lead to a strong pump in altcoins in the coming days. So, if you're thinking about selling right now, it’s better to hold and wait. You may start seeing results within the next two to three weeks. Keep an eye on this setup and watch how it plays out

Bitcoin feminine?Is Bitcoin dominance slipping?!
I think bitcoin dominance is about to lose 60% concretely! Prepare for top Alts to run hard!!

Bitcoin Dominance Theory: Why It May Shrink More Than EverBitcoin dominance — the percentage of total crypto market cap held by BTC — has followed a fascinating evolution, each cycle telling a different story.
2017: The Altcoin Wild West
In early 2017, BTC dominance was a whopping 96%, but it plummeted to 35% by the peak of the bull run. Why?
Back then, altcoins were viewed as competitors, not complements. “Bitcoin killers” were popping up weekly — Bitcoin Cash, Bitcoin Gold, Bitcoin Diamond, SuperBitcoin — each claiming to fix perceived flaws in BTC. Ethereum itself faced internal rifts (remember Ethereum Classic?).
Even niche projects with totally different aims — like Power Ledger or SpankChain — were riding the hype wave. Dominance dropped because belief in BTC’s sole supremacy wavered.
2019: A Comeback Without Conviction
After the brutal crypto winter, BTC dominance rebounded to ~72% in 2019. But it never reclaimed its former glory. Altcoins were quiet, and BTC was seen as a safer store of value.
Still, the seeds of change were being planted.
2021: Rise of Smart Contract Platforms
The next bull run told a different story. BTC dominance fell under 40% again, but not due to forks or airdrops. This time, it was about DeFi, NFTs, and utility.
Smart contract platforms like Ethereum, Solana, Avalanche, and others were exploding in value — not by competing with Bitcoin, but by unlocking new economies. Bitcoin had no answer to smart contracts or decentralized finance.
2025: Enter the Integration Era
Now in 2025, we’re seeing:
Real-world adoption of DLT technologies (e.g., Hedera’s state-level integrations).
Altcoins with real-world utility, not just speculative value.
Governments and enterprises exploring blockchain for tokenized treasuries, identity, compliance, and more.
This shift means BTC, while still the king of store-of-value, is no longer the entire castle. It’s digital gold in a world that’s now building cities, roads, and digital economies on other chains.
Prediction
In this cycle, BTC dominance may shrink even more than before — perhaps dipping below 35%, not because BTC is weak, but because the rest of the ecosystem is stronger than ever.
But here's the kicker: this time, the total market cap could be soaring at the same time. A shrinking BTC.D might not signal weakness, but rather an explosion of utility across the crypto space.

Rising Wedge + Falling Three MethodI see a Bearish Falling Wedge in a downtrend with the most recent 12 hour candles forming a Falling Three Method Pattern (Blue Circle). Anything can happen but I wouldn't be surprised to see this break down and out of the Falling Wedge, retest former support and flip it to resistance and then break down to the bottom of this macro channel indicated by the red circle.

BTC DOMINANCE Analysis (4H)The previous analysis, which was for a higher timeframe, did not play out. The price bounced upward from higher support levels, which suggests that after the current sideways movement is over, we are likely to see another move to the downside in the coming weeks.
But what's happening on the lower timeframes? Let's take a closer look.
Based on the recent data, it appears that a triangle pattern is forming on the chart from the point where we placed the green arrow.
Wave C could complete either in the supply box or within the FVG zone.
With a drop in this index for wave D, altcoins may have a chance to recover.
However, if a daily candle closes above the invalidation level, this entire outlook will be invalidated.
For risk management, please don't forget stop loss and capital management
Comment if you have any questions
Thank You

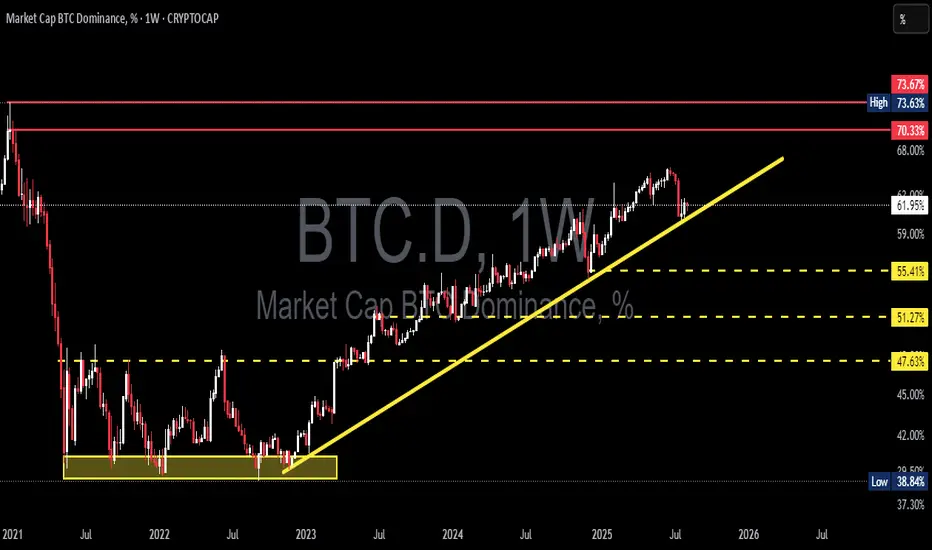
BTC Dominance at a Critical Point – Is Altseason About to Begin?🔍 Technical Breakdown (BTC.D Weekly Chart)
The weekly BTC Dominance chart shows Bitcoin's dominance is now testing a critical ascending trendline, which has supported its bullish momentum since early 2023.
After hitting a major resistance zone between 70.33% – 73.67%, BTC.D faced a sharp rejection — signaling a potential capital rotation from BTC into altcoins, which is often the first clue of an incoming Altseason.
---
🧩 Structure & Pattern Highlights:
✅ Rising Trendline Support:
A strong uptrend structure has been in place since the 2022 bottom (~39%), marked by consistent higher highs and higher lows.
⚠️ Minor Double Top near 70.33% – 73.67%:
This classic reversal pattern at a macro resistance zone hints at possible exhaustion in BTC dominance.
🟡 Historical Accumulation Zones:
Key horizontal levels at 55.41%, 51.27%, and 47.63% have acted as major decision zones in the past and will serve as critical support if the trend breaks.
---
🟢 Bullish Scenario (BTC Dominance Rises):
If BTC.D can:
Successfully hold above the ascending trendline
Print a strong weekly bullish reversal
➡ Then a move back up to retest 70.33% is likely.
A confirmed breakout above 73.67% would suggest BTC dominance could surge further.
📌 What it means? Altcoins would likely underperform, as BTC reclaims market control — usually a risk-off signal for crypto.
---
🔴 Bearish Scenario (BTC Dominance Falls):
If BTC.D:
Breaks below the ascending trendline
Fails to hold the 61.91% support zone
➡ This could signal a significant capital outflow from BTC to altcoins — an early indicator of Altseason.
Bearish targets below:
55.41% – First support area.
51.27% – Key psychological and technical level.
47.63% – A drop to this level would be a strong confirmation that Altseason is in full effect.
📌 In this case, we’d expect strong moves across sectors like AI tokens, DeFi, L1s, and mid/low cap altcoins.
---
📊 Key Confirmations to Watch:
1. Weekly candle reaction to the trendline
2. Volume – strong selling on breakdown confirms trend shift
3. ETH.D and TOTAL2 (Altcoin Market Cap) – if rising while BTC.D falls, it's strong evidence for Altseason
---
🚨 Final Takeaway:
BTC Dominance is now at a make-or-break level that could define the direction of the broader crypto market for the next several months.
A breakdown = risk-on environment, favoring altcoins.
A bounce = BTC continues to dominate while altcoins stall.
Either way, the next big move is coming — this is the moment serious traders and investors have been waiting for.
#BTCdominance #AltseasonAlert #BitcoinVsAltcoins #CryptoRotation #CryptoBreakout #AltcoinSeason #CryptoMarketAnalysis #BTC.D #CryptoTrend #SmartMoneyMoves #CryptoTA #TradingViewAnalysis
(updated) BTC Dominance Playing Out As ExpectedBTC Dominance broke the downtrend, retested the breakout line, and just rejected the resistance zone again — all exactly as charted.
📌 Structure is still bullish above ~61.4%
📌 Altcoins may stay suppressed if dominance holds higher
⏱️ Timeframe: 1H
#btcd #bitcoin #dominance #marketcycle #altseason #chartanalysis #quanttradingpro #tradingview
Has the altseason started?Bitcoin dominance is moving towards the 60% support. If this support is broken and dominance declines, we can expect the price of major altcoins such as Ripple and Ethereum to rise. Of course, Bitcoin’s decline should also stop. So the answer of my question is "sill no".
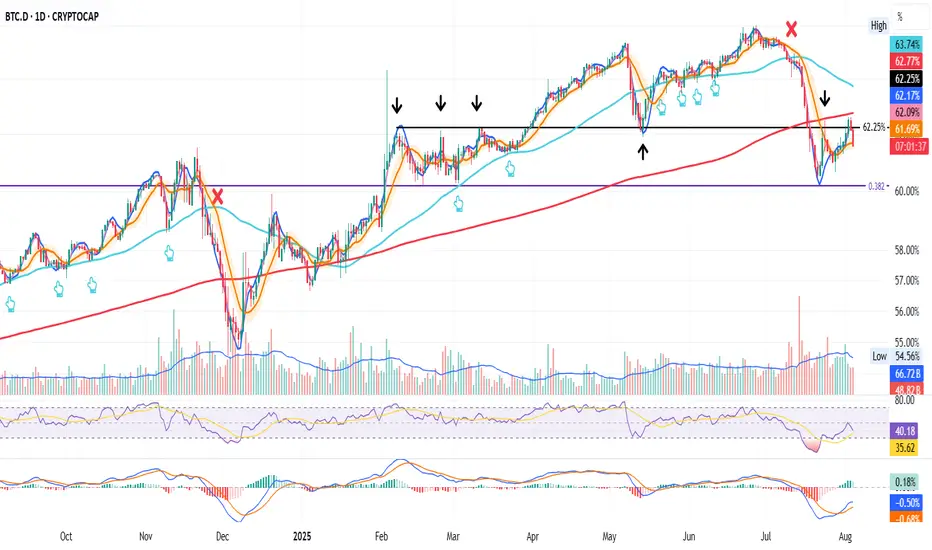
BTC.D on the Daily – Key Rejection in Play
BTC Dominance pushed into the 200MA on August 2nd.
On August 3rd, it got rejected and closed below the 62.25% key resistance.
Today, August 4th, that same level is acting as resistance again.
If today's candle closes below the BB center (orange),
we could see another move back to the bottom of the range
with the 0.382 Fib near 60% as the next key level to watch.
Momentum is fading at resistance.
Structure favors a deeper retest.
We’ll be here to watch it unfold.
Always take profits and manage risk.
Interaction is welcome.
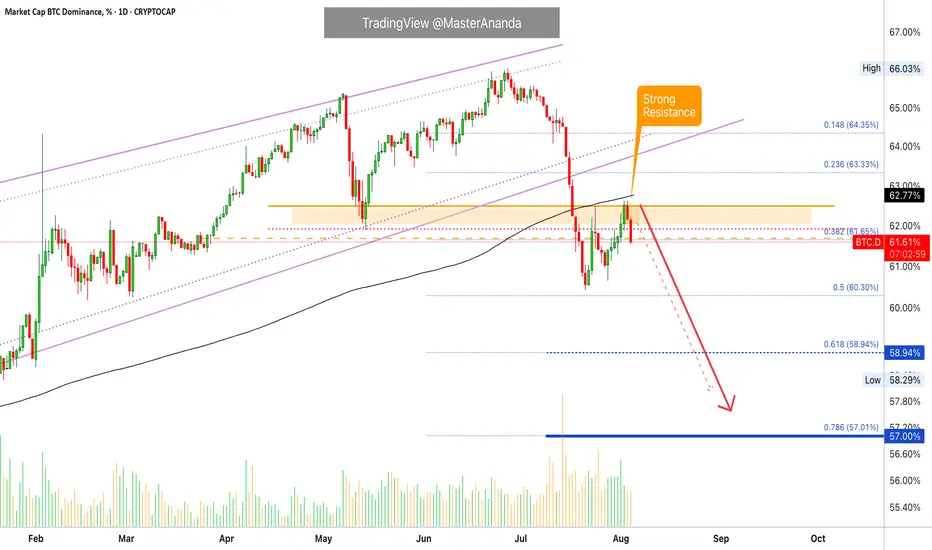
Bitcoin Dominance Update · Daily TimeframeThe rejection is happening right at "strong resistance." Notice that this is the same drawing from my previous update so it was drawn before the fact. Since resistance has been confirmed and the action is happening just as we expected, we can continue to follow our map as it is working.
The next logical move is a drop on Bitcoin Dominance Index (BTC.D), which translates into the resumption of the bullish wave for the altcoins, specially Ethereum and the big projects. It can also signal that Bitcoin will stop dropping and will either consolidate or move higher. This index reveals more than anything else the expected directions of the altcoins.
The retrace is over
The altcoins produced a retrace mainly between 21-July and the 2nd of August. In this period we saw many of the altcoins we are buying and holding move lower but only to produce a strong higher low. This higher low now will resolve into a very strong bullish wave, a bullish resumption.
Moving averages
Here MA200 daily has also been confirmed as resistance and trading below this indicator with a bearish bias, coming from a high point, gives out a very strong bearish signal. It means that long-term bearish action is now in place, the direction/trend. If the action was happening below MA200 but coming from a low point, this signal can have bullish connotations, right now it is bearish.
Bearish Bitcoin Dominance = Bullish Altcoins
The altcoins market will continue to grow, this is only the start. We are set to see growth long-term including now, next week, next month and until late 2025; maybe even for some portion of 2026, maybe even beyond.
Thank you for reading.
Namaste.
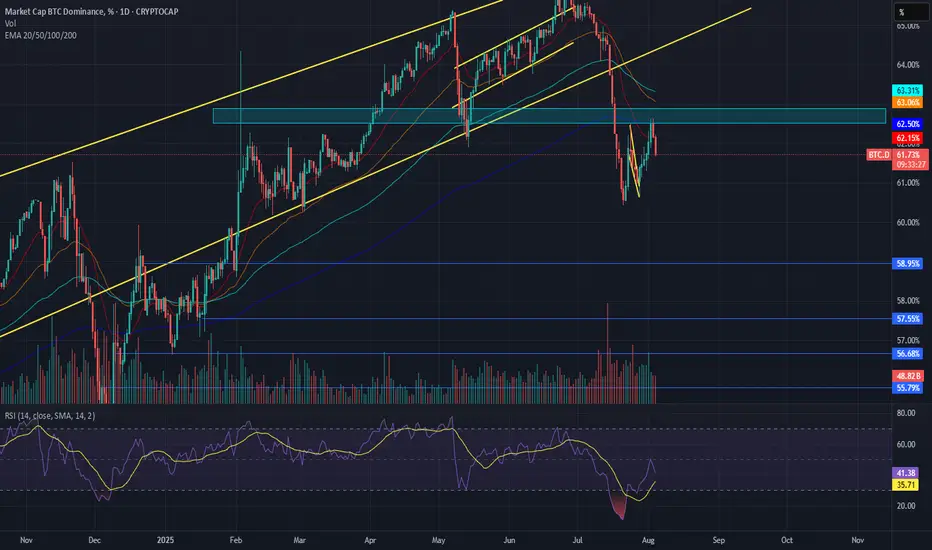
BTC.D trendBTC.D bounced from the support zone of 60% two times, this is a strong level which we have to break out to see altseason in near future. The BTC.D made a correction reaching 62% resistance zone and bounced back from this level, as a result we see how altcoins and ETH are started growing again, I expect to see a strong downfall and as soon as the BTC.D will breakout the support level of 60%, this will be a clear sign of bull run
$BTC.D are we there yet?? Silly $$ timeok people is it just me excited af
survived yet another cycle of dominance lets run it back to hades from here ;)
time to step on the gas
when you do see a flush moving on !
all the best
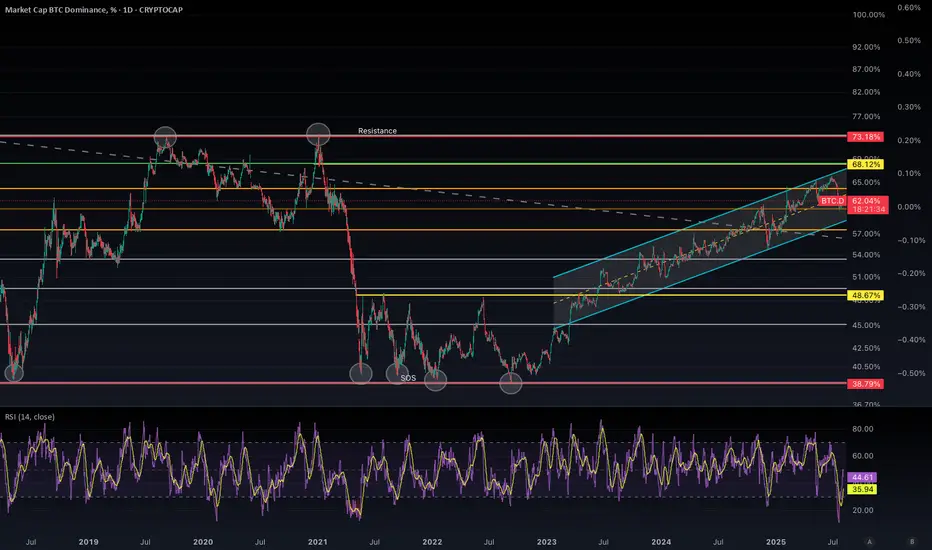
This Level Will Decide the Next Big Move in Crypto Markets🔍 General Chart Context
This chart tracks Bitcoin Dominance (% of total crypto market cap), currently sitting around 62.04%. BTC Dominance reflects Bitcoin’s market share vs altcoins — when it rises, BTC is outperforming alts; when it falls, altcoins are gaining.
🔄 RSI Analysis:
VERY IMPORTANT
BTC.D RSI against BTC RSI (daily candle)
BTC dominance dropped 46% from December 2020 - May 2021, while the price has dropped 55%. 6 months of bear market created an all time low for the RSI on the daily - rightfully so, RSI went all the way down to 10.
NOW (Last week)... the RSI has dropped down to the same level for the first time in 3 years! However, the difference is (outside the fact were already in a bull market) BTC dominance only dropped 10%. This is literlly music to my ears, massive sign of strength!
BTC RSI on the daily will use that 10-11 level as a support (historically speaking extremely low probability RSI will decline further) and continue rising until BTC price reaches $138K we could see a 68% dominance and a 80 RSI, after BTC price topping out, price will rotate into the ALT's starting the ALT season everyone has been waiting for late August and resulting in BTC to drop most likely to the 100K level. Which will be my next accumulation zone for the next big leg up over the new year.
🔁 Historical Levels & Key Zones
Resistance (73.18%): This is a long-term top marked with historical rejections (highlighted with circles).
Major Resistance Zones:
68%: Also a local high from prior cycle — current short-term resistance.
65%: Interim structural resistance, previously tested as a top and support.
🔮 Interpretation & Probabilities
🟩 Bullish Scenario (High Probability)
As long as BTC.D stays in the channel, the most likely path is a retest of 65%–68%.
RSI nearing oversold supports a relief bounce soon.
If BTC price continues up, altcoins may bleed further — pushing BTC.D higher.
Key levels to reclaim: 65% and 68%. If broken, next target is the cycle top (73%).
🟥 Bearish Scenario (Moderate-Low Probability for now)
If BTC.D breaks below the ascending channel and loses 60%, we could enter:
An altcoin-led market (altseason).
Watch for confirmation via RSI divergence, price structure break, and volume drop in BTC.D.
🧠 Macro View & Correlation to Crypto Market Cycles
The trend since late 2022 shows BTC regaining strength over altcoins — consistent with risk-off sentiment and macro uncertainty.
A move above 68% dominance typically signals BTC dominance in bull runs, often preceding parabolic BTC price increases. Something I am personally expecting moving into the new year.
Conversely, a breakdown from the channel would mark a risk-on phase — favouring alts.
✅ Conclusion
BTC.D is in a macro uptrend but approaching a critical test of channel support + RSI bounce zone. If 60% holds, expect a move back toward 65–68%. If it breaks, altcoin dominance could surge. This chart is pivotal for allocating between BTC and alts. BTC will eventually rotate into ALT coins creating a price drop in BTC and an increase in price with majority of ALTS. I believe this will happen after BTC tops out late august at $138000, then a true ALT season is necessary.
Disclaimer:
The content provided in this post is for informational and educational purposes only and should not be considered financial or investment advice. I am not a financial advisor, and this is not a recommendation to buy, sell, or hold any cryptocurrency, asset, or security. Always do your own research and consult with a qualified financial advisor before making any investment decisions. Trading and investing involve risk, and past performance does not guarantee future results.
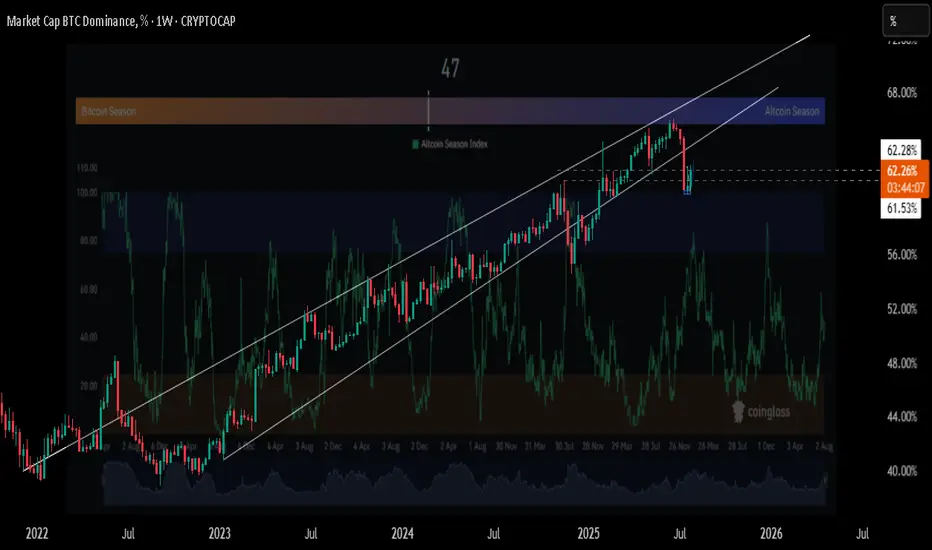
Altseason Countdown: When Will Alts Explode? Hey traders,
✅ Altcoin Season Index
Currently at 47, a neutral zone — not yet favoring altcoins
True altseason usually begins when the index rises above 75, showing consistent altcoin outperformance
Historically, transitions from this level to full altseason take around 1–3 months, assuming BTC dominance declines
✅ Bitcoin Dominance (BTC.D)
BTC dominance is rebounding from strong support near 61%, now around 62.25%
As long as Bitcoin holds dominance, capital remains concentrated, delaying altcoin rallies
If BTC dominance tops out near current levels and begins trending lower, it could trigger broad altcoin strength
✅ Macro Insight: Fed & Liquidity Outlook
Based on current macro conditions, I anticipate that the Federal Reserve may introduce rate cuts as early as September
A rate cut would inject more liquidity into markets, increase risk appetite, and historically benefit altcoins more than BTC
This potential shift in monetary policy aligns well with the technical setup for altseason acceleration
🧠 My Timeline Projection
If BTC dominance reverses within the next few weeks, altseason could begin around September–October 2025
If dominance remains strong or climbs above 63–64%, the shift may be delayed into late Q4 2025
📌 Final Thoughts
Altseason isn’t here yet, but multiple signals are aligning: a mid-level index, a possible BTC dominance top, and a favorable macro window.
Share your thoughts in the comments box.
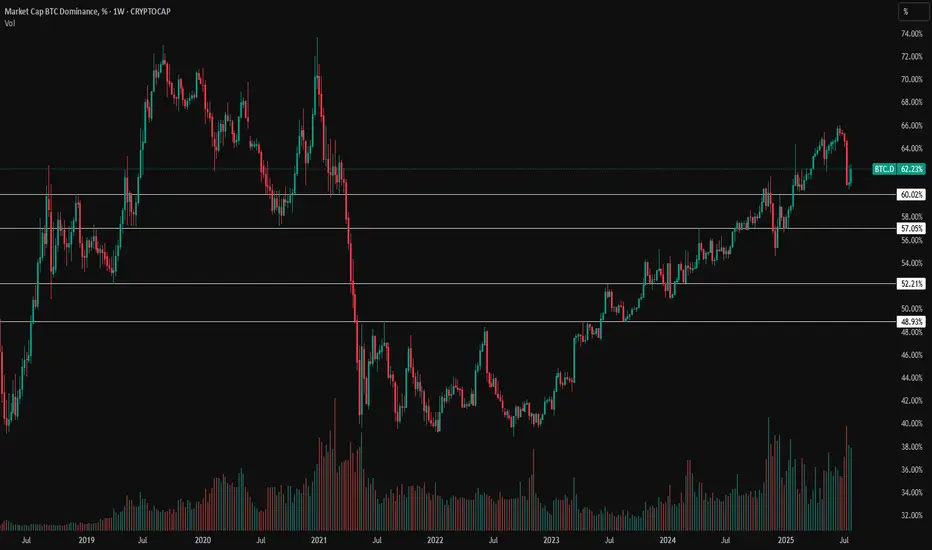
Bitcoin.Dominance Key LevelsThese are the important BTC.D levels we need to be looking at:
60% - ETH will finally break $4k.
60%-57% - ETH all time high
57%-52% - This is the most important range. If we fill this 5% gap, ETH will be at a very nice all time high price which we have been waiting for for years.
53%-49% - ETH continues to pump and at an all time high, I dont know if any further drop in BTC.D will be fueled by mainly just ETH or if we will see a ETH --> midsize marketcap --> small size marketcap rotation of money like we did in the 2021 altseason. If we do fill that 57%-52% gap mentioned above and i see money start to rotate into other coins fueled by euphoria, i will be looking at coins such as GETTEX:QNT , EURONEXT:ALGO , CRYPTOCAP:LINK any many more.
Below 49% - money to be made everywhere, throw your money in and watch it go up 50% in one day. be smart, but there will be opportunities everywhere. dont throw all your money in one place, enjoy euphoria for a bit, but you want to sell while everybody is euphoric and thinks price will never go down.
I'm not saying these levels ARE going to be hit, im just speaking on what I think will happen WHEN these levels DO get hit.
I mostly have my eyes on Ethereum Ecosystem coins, but i also have my eyes on a lot of AI coins. Everybody is investing in AI currently, in 2021 we saw Facebook announce their Metaverse and we saw metaverse coins like INDEX:GALA go up 9x.
BTC.D is on the verge of a collapse...Hello Traders 🐺
In this idea I want to use one of my favorite trading tools to identify the support levels for BTC.D — and as you probably guessed, it's the EMA Ribbon!
As you might know, EMA Ribbon is one of the best types of EMA indicators you can use, because it gives you a wide range of dynamic support and resistance based on exponential moving averages. Most importantly, when you apply it on higher timeframes like the weekly or monthly chart, it becomes incredibly accurate.
In the BTC.D chart, we now have two points of confluence meeting each other:
the red weekly support box
the last strand of our dynamic support, which is the EMA Ribbon
But what now?
Well, considering the bearish divergence on the weekly chart, the overbought zone on RSI in the monthly timeframe, and the current setup in altcoin charts, I think we can say — with a high degree of certainty — that BTC.D is on the verge of a collapse...
Make sure to act accordingly — and as always, remember our golden rule:
🐺 Discipline is rarely enjoyable, but almost always profitable. 🐺
🐺 KIU_COIN 🐺

$BTC.D🩸 CRYPTOCAP:BTC.D ⁀➷
#BitcoinDominance. Macro chart Another
💯 Intermediate Target - 48%
🚩 Macro Target 1 — 44 %
🚩 Macro Target 2 — 40 %
🚩 Macro Target 3 — 35 %
- Not financial advice, trade with caution.
#Crypto #BitcoinDominance #BTC.D #Investment
✅ Stay updated on market news and developments that may influence the price of Bitcoin Dominance. Positive or negative news can significantly impact the cryptocurrency's value.
✅ Exercise patience and discipline when executing your trading plan. Avoid making impulsive decisions driven by emotions, and adhere to your strategy even during periods of market volatility.
✅ Remember that trading always involves risk, and there are no guarantees of profit. Conduct thorough research, analyze market conditions, and be prepared for various scenarios. Trade only with funds you can afford to lose and avoid excessive risk-taking.
