BTC Dominance Update 03.06.2025🚨 BTC Dominance Update – The Moment We've Been Waiting For! 🚨
As I highlighted in my last analysis, BTC Dominance (BTC.D) just completed a deep retracement and bounced back perfectly from the black line I previously marked. 📉🖤 That bounce confirms one key thing: the last leg up was just a retracement—not the start of a new BTC.D rally!
And what does that mean for us?
🔥 It’s finally time for Altcoins to shine! 🔥
BTC Dominance is starting to give up its grip, and that means capital is flowing back into our beloved Alts. This shift has officially begun. 🚀💸
As I also mentioned in the previous update:
📍 A breakout of the black line will be our first strong confirmation of a long-term bullish trend in BTC Dominance. But as long as we stay under it, **Altcoins have room to breathe**—and run! 🏃♂️💨
So, are you ready to take advantage of this opportunity?
⚠️ Stay sharp. Stay focused. Watch those setups.
This could be the beginning of the next Alt season wave! 🌊🌈
Let’s ride it together. 💪🚀
#Altseason #BTC.D #CryptoUpdate #TradeSmart
Market insights

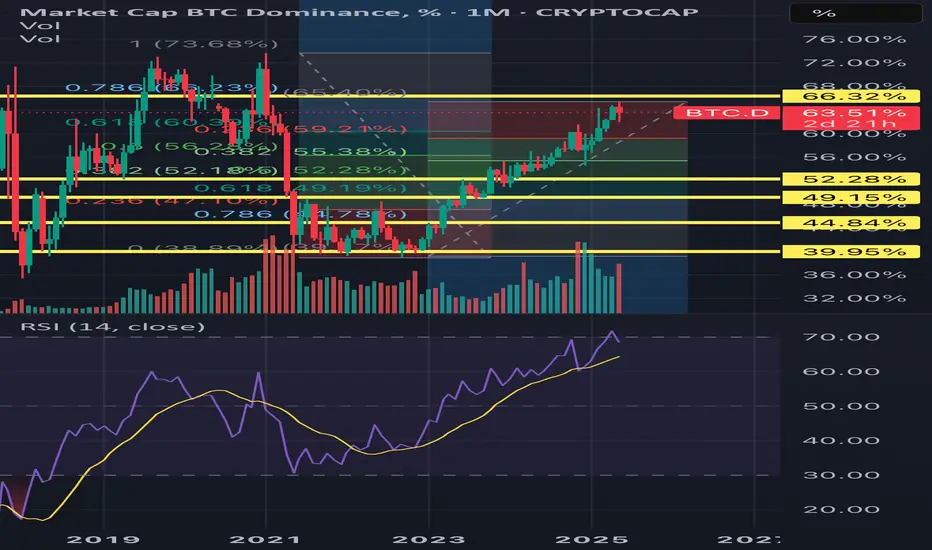
No Alt Season For You YetAccording to Fibonacci retracement levels, you’ve been getting scammed by the so called crypto experts about the dominance weakling for 2 years. This chart shows that the dominance broke below 0.618 level where people started calling for alt season, but when 0.618 turned into support non of the scammers on trading view warned you that alts will get crushed. Afterwards, dominance surged to above the 0.786 level. Soon after breaking above the 0.786 level domiance momentarily broke below this level where the crypto scammers told you that the alts season is coming. Surprisingly, the chart printed a weekly close above the 0.786 level and this level became the new support level for dominance. It has been a good support level so far and the next resistance level stands at 70-73 %. The fact is that your crypto gurus are as clueless as you and I, so analysis your own charts and don’t listen to these fake crypto experts.

Why there is no hope for alts at least before 73% BTD.DHey,
I'm watching market for last 1year to see what happens where.
No long Story, CRYPTOCAP:BTC.D needs to hit 73% first, Like next 1-3 months,After that we can see a HUGE altseason where everyone will lose their mind.
GL
DYOR

BTC.D – Rising Wedge Under Pressure🔍 CRYPTOCAP:BTC.D is currently tracing a rising wedge pattern, with price pressing against the trendline resistance.
⚠️ Watch for a potential rejection or breakout. A confirmed breakout and retest could signal stronger BTC dominance ahead!
👀 Remember, BTC dominance often moves inversely to altcoin market cap — this setup could impact alt season momentum. Stay tuned!

Phoneix is coming backdoes not include financial advice.
the graph is back to its 2019 appearance
let's see if he can spread his wings this time

TOTAL3(except Stables) Vs BTC.D🔍 Left Chart – TOTAL3/BTC (Altcoins vs BTC)
Shows relative strength of altcoins vs. Bitcoin.
Currently at 0.29, retesting previous support (yellow line).
Clear breakdown from 0.30–0.32 zone, which was an important range.
🟥 Red drops at support = further altcoin weakness likely.
🟡 Moons/suns = former balance zone → now resistance.
This suggests altcoins are underperforming BTC—capital may be flowing back to Bitcoin (or out of the market).
🔍 Right Chart – BTC Dominance (% Market Cap)
BTC dominance is approaching the key 64.57% resistance level (yellow line).
If BTC dominance breaks out, it confirms capital rotating into BTC and away from altcoins.
🟥 Red drops above = a potential reversal/resistance zone—but if broken, altcoins may bleed more.
📊 Implication:
Altcoin vs BTC pair is weakening, while BTC dominance is strengthening.
This combo suggests a "Bitcoin-only" phase, often seen during risk-off periods.
Traders may prefer to rotate into BTC or stablecoins, avoiding alts for now.

BTCD They say nothing goes up in a straight line… well BTC dominance have plowed its way to the top half the year has gone and we have yet to see a real significant turnaround after going up several years.
My thesis is that we tank super hard it won’t be gradual at all.
Time wise..? I figured it should have turn around at 62.% but we have that crazy wick up the up side . And continued to fill it in going up to 65% where we are still ranging.
Very curious to see where the 4 months going lead us .


BTC & BTC.D – Key Moves in 1H TF
BITSTAMP:BTCUSD CRYPTOCAP:BTC.D
🚀 CRYPTOCAP:BTC is breaking out from a falling wedge on the 1H timeframe — currently in a healthy pullback phase. Bulls need to hold $107.2K–$109.3K to flip bias fully bullish, with resistance re-tests ahead.
📈 Meanwhile, CRYPTOCAP:BTC.D is forming a rising wedge on the 1H — a bearish pattern that could break down and boost altcoin momentum.
⚠️ Shorter timeframes always come with more risk, so stay sharp and watch those key levels closely!

BTC.D Divergence Detected – Altcoin Window Ahead ?Hello Traders 🐺
In the past few weeks, I decided to publish fewer ideas in order to step back, observe, and see what’s really going to happen in the market — especially in the Altcoin market.
Now I believe it's a good time to take a look at the chart and break down what’s most likely to happen:
As you can see on the weekly chart, we have a descending channel on the RSI, which means the relative strength of BTC.D is diverging from the BTC.D chart itself.
But why does this matter?
Let me explain:
As a trader, you should always follow the bigger picture. The higher the time frame you analyze, the more reliable your analysis becomes.
If you only follow lower timeframes like 4H or 1H, chances are high that you’ll get manipulated by the bigger players — because the market is extremely volatile and requires real discipline to survive and grow.
But what about the immediate short term?
📉
In my opinion, BTC.D is most likely about to test the 0.786 or 0.88 Fibonacci levels in order to form a double top pattern.
So we can expect a bit more downward pressure on Altcoins, and this area could be considered a great entry point if you’re planning your next move!
I hope you enjoyed this idea — and as always, remember:
🐺 Discipline is rarely enjoyable, but almost always profitable 🐺
🐺 KIU_COIN 🐺

$BTC.D Dominance forecast: update May 2025📉 BTC Dominance (%BTC.D) Update – At Resistance, Altseason in the Balance
Back on April 5th, I published a forecast highlighting the critical 65% resistance level on BTC Dominance. That analysis still holds: BTC.D reached 65% and got rejected, pulling back to 62% as of now.
⚔️ What’s Happening?
Bitcoin dominance is compressing, and we're approaching a make-or-break moment:
🔹 Resistance confirmed at 65%
🔹 We bounced down to 62% — not up
🔹 Market is hesitating, and the next move will shape the short-term direction for alts
🔍 The Bigger Picture
Bitcoin pumped hard recently, mostly due to:
MACD reversal on the weekly
Oversold conditions now turning bullish
Renewed institutional interest in risk-on assets
But let’s be clear:
🚫 We’re not in a full altseason yet.
What we’re seeing is cautious altcoin rotation, not a blow-off alt rally.
📊 Tech Indicators
MACD: Overheated
RSI: Still has room to move up
So technically, BTC.D could still break out above 65% — but it hasn’t yet.
⚠️ What to Watch:
If BTC.D breaks out above 65%, expect:
➡️ Altcoin bloodbath
➡️ BTC.D could head toward 70%, crushing the mini-altseason
But if BTC.D continues to drop from here?
➡️ Altseason starts to heat up
🔮 Outlook
A true altseason might not arrive until September/October. For now, the market is stuck in a range of uncertainty.
Keep your eyes on:
BTC.D reaction at 62%–65%
TradFi stress (bond markets, macro fears)
Bitcoin strength and ETH/BTC ratio
🧠 Take profits when you can. Protect your capital.
📌 Follow me for future updates—and don’t forget to DYOR.
📎 Original forecast:

Bullish Altcoins: Bitcoin Dominance In Correction ModeHere BTC.D is still moving within a classic ABC correction. The peak happened 7-May. After 14-May there was a bounce but this bounce ended in a lower high. The correction is not over.
As this index moves lower, the Altcoins market will grow.
When Bitcoin turns sideways, retraces or consolidates, it is an opportunity for the smaller Altcoins to move forward. This is the scenario we are entering right now.
» Bitcoin sideways. Altcoins bullish. Long-term growth.
The 2025 bull market is only starting now. Prepare for growth until late 2025 or beyond (early 2026).
Namaste.

King BTC - Bitcoin Dominance Continues to Go Up OnlyIf market cycles still matter, this current one will be remembered as a disappointment by many crypto traders. With Bitcoin Dominance up-only, this has been the cycle of institutional traders who accumulate Bitcoin. For years, crypto traders hoped that institutions would 'buy our bags'. But for now, only 'King BTC' has benefitted. From its low point at less than 40%, Bitcoin market cap dominance versus the rest of the crypto markets is now sitting at 65%. The times when crypto traders would 'hunt gems' and hold Altcoins that would go up 10-100x are over. Between the 'crypto trenches' of memecoin traders hunting very low cap memes that can go up multiples and then go back to 0 even quicker and 'King BTC', not much of the rest of the market has caught a bid.
The picture is completely different on the institutional side. For many funds, Bitcoin is now part of a core treasury strategy. Pensions and endowments dip in through ETF exposure. Especially in the US, the regulatory and legal outlook are improving rapidly under a pro-crypto US administration. Asset managers like BlackRock are promoting BTC as a long-term store of value with lower correlation to equities than previously assumed.
In fact, institutional Bitcoin FOMO is accelerating rapidly. Michael Saylor's MicroStrategy famously leveraged its balance sheet to borrow funds, buy Bitcoin for its treasury and then rinse and repeat. The strong performance of MicroStrategy has unsurprisingly led to copy-cats. This week, GameStop became the latest one, confirming that it had bought 4,710 BTC worth about $513 million. In a sign that the buck might not stop here, SharpLink, a performance-based marketing company serving the U.S. sports betting and global iGaming industries, launched a $425million private placement to accumulate Ethereum into its treasury.
Leaving aside the question of who would lend so much money to a sports marketing company, other burning questions remain. Will Bitcoin FOMO lead to another parabolic rally? Will Ethereum treasury-buys finally lead to new all-time-highs for the 2nd largest Crypto Coin by market cap? And will that lead to a 'more traditional' Altcoin rally? Maybe most importantly: how sustainable is the MicroStrategy Treasury accumulation?
As always in Crypto markets, reflexivity is strong on the way up, but critical on the way down. If the BTC price ever drops below the average purchase price of its Bitcoin and debt-rollover deadlines are approaching, will MicroStrategy end up having to sell Bitcoin in a fire sale? Past market history tends to agree with Murphy's Law: usually, whatever can go wrong in crypto, eventually does go wrong. Maybe the day will come when the rise of Bitcoin dominance will stop 'the hard way'.

Almost locked inBuy B4 dominance goes down
Wen down?
Locked out for now
Seems like repeat of the past,
First hit Fib lvl again
Global market stress imo
W8
GL

BTC.D updateIntersection at end of July 25/early Aug 25
That would be the altcoin top
Alts should be starting extremely extremely extremely soon. They all look primed.
Not financial advice

WARNING! Sell Your Altcoins, -40% Drop AheadHello, Skyrexans!
The title of this article is made specially for haters. I see euphoria on each small drop of CRYPTOCAP:BTC.D and understand that altseason now will not happen. People are still holding and dreaming Lambos. This is very bad for potential growth, so I expect only dump on risky alts with the new dominance push!
Look at the 4h time frame. As you remember from my previous analysis I expect the global wave 5. In my opinion waves 1 and 2 have been finished already. Wave 2 represented as an irregular ABC correction. Target at 0.38 Fibonacci has been reached. Now it's time for wave 3 which will reach 67%. During this dump on altcoins I wanna see total disappointment of moon boys and selling on every local bounce. I will repeat once more, market shall be cleared from the crowd to go up.
I am not an altseason hater. I am also holding some altcoins, but it's important to understand the real picture and have the right exaltations. Otherwise you will be disappointed and go out from rocket. I wish for clever, patient and realistic people to earn on the altseason, but first of all market need to persuade greedy and disrespectful people to escape altcoins.
Best regards,
Ivan Skyrexio
___________________________________________________________
Please, boost this article and subscribe our page if you like analysis!

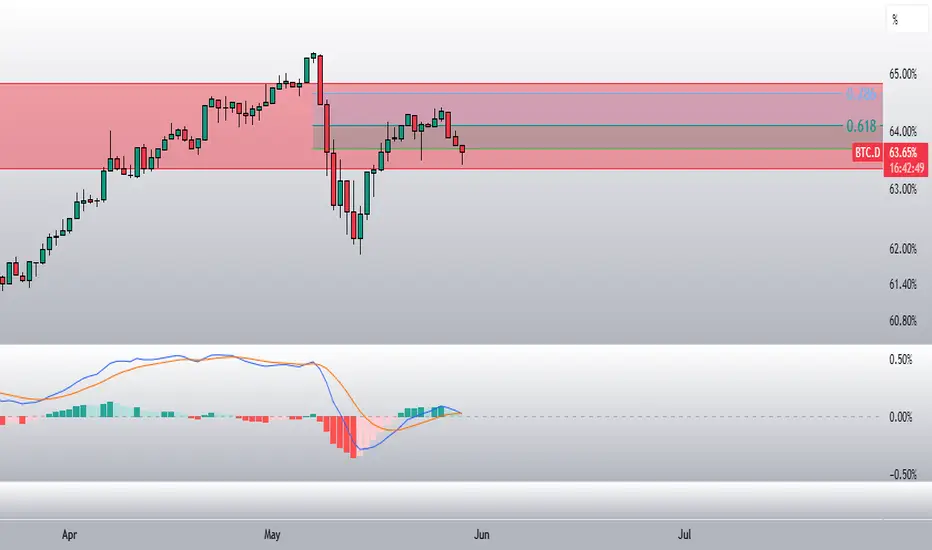
The tides are turning again for BTC.DWhile we are trading below the golden pocket again, the daily MACD is also about to cross bearish again. The weekly MACD may do so as well by the end of the week.
BTC Dominance – Round Top Pattern Brewing on 4H🔶 BTC Dominance is forming a Round Top pattern on the 4-hour chart, signaling potential reversal pressure.
🛑 Watch the key level at 63.5% dominance — a break below this could pave the way for altcoins to rally hard.
👀 This zone is critical for alt momentum shifts. Stay alert for decisive moves!

$BTC.D is starting to show relative weakness to AltcoinsCRYPTOCAP:BTC.D is starting to show relative weakness to Altcoins.
This could be a real liquidity rotation from Bitcoin into Altcoins.
Or just Bitcoin taking a breather before stealing the show again.

BTCDIt’s time for BTC dominance to prove itself!
Watching the hourly closely here to see if we continue to reject .

The FUN Begins!BTC.D looks ready for a reversal. Seems to have reacted @ around 66% dominance or the .786 fib. RSI is also showing overbought at 70.
Bullish cases for Ethereum (and other alternatives):
Recent Pectra Upgrade
coinmetrics.substack.com
ETH ETF Staking In Progress
cryptomus.com
🔥 Monetary Policy:
Deflationary ETH, low issuance, gas burn
💸 Income & Yield:
Staking yields + restaking = ETH as productive asset
🌉 Scaling:
L2 growth, rollup-centric roadmap
🏛 Regulatory Clarity:
Spot and staking ETFs, ETH viewed as a commodity
🧠 Innovation:
Fastest-moving ecosystem, leading dev activity
📊 Valuation:
ETH/BTC ratio and on-chain revenue imply undervaluation, deflationary aspect
📈 Institutional Access:
ETFs, staking rewards in ETFs, custody solutions, DeFi
🔮 Bottom Line: Bitcoin Dominance will most likely decline because:
• The market in general is expanding beyond just a monetary hedge.
• Assets like ETH and others offer yield, utility, and flexibility.
• Developers and institutions are building on platforms, not commodities.
Bitcoin may retain its crown as digital gold, but it’s no longer the center of gravity in the crypto universe. Only time will be the true test! May the best tech prevail!
NOT FINANCIAL ADVICE!!!
BTC.D top is inIt’s the phenomena of the so called alt season.
Alt coin make massive rallies, extending their waves beyond any rules, all thanks to the btc.d collapse. This will be 3 to 6 months long and the effect will be stronger below 50%.

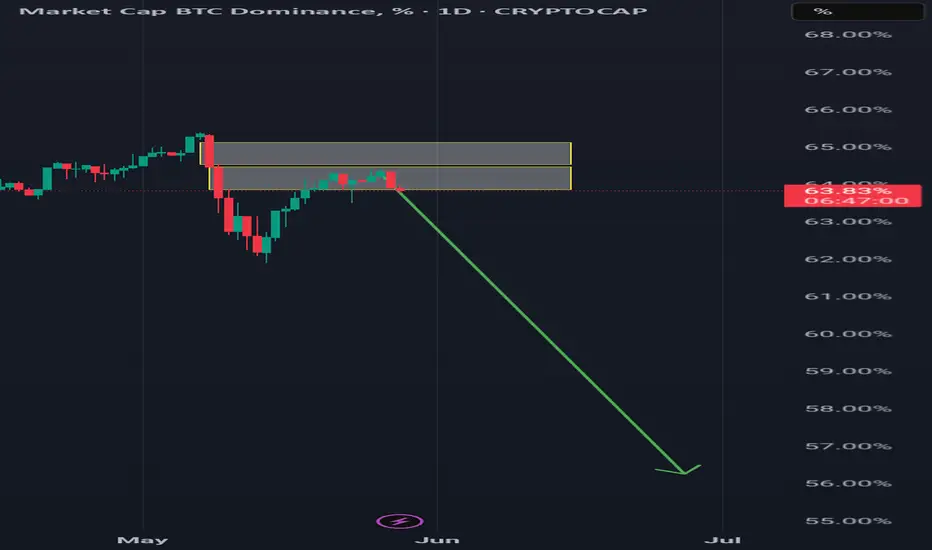
Bitcoin’s Dominance (BTC.D)I spotter 2 order blocks which seem to have been rejected from the lower. Fibonacci retracement tool didn't align perfectly with the retracement, I however used it for my July target