btc DBTC DOMINANCE UPDATE
I think it will rebound from Fibonacci 4.23 in the coming weeks and will be positive for the currencies. Wait for the bullish rockets.
Market insights

DECEMBER PUMP REPEAT?1-The Btc.d has fallen super greaty. it was suppose to fall from the OB it is staying on due to this, when market went more high it actually helped increase seller movement.
2-The weekly rsi, Daily Smc and Rsi, all together suggest a massive drop close to 60%.
3-The weekly last low will not break, it can be swept but not break. In this condition after massive drop a massive high of Btc.d will occur.
4-If market actually close below weekly high and new week candle didnt close bullish or swept the previous weekly high. the Alts Will Pump crazily.
5-The Alternative Of this means Bullish for BTC.D and Bearish for Alts.
6-Be Alert in news, if massive rally comes due to news book least 70% because market is gonna crash harder.
7-Trade carefully,with patience and earn well.
Hope We all Get Good Profits.

BTC.D breaking key trendlineDominance fell below the trendline it was maintaning since November 2024 and it appears it's being rejected by it.
Remember that RSIs and other indicators don't work that well on dominance and even less in fomo phases.
Good luck

BTC Dominance Rejected Perfectly at 65.48%CRYPTOCAP:BTC.D
Hi everyone,
In my previous idea, I highlighted the 65.48% level as a key resistance — and today, we’ve seen a sharp and clean rejection right from that zone. The reaction aligns perfectly with the levels and path I mapped out earlier, reinforcing the idea that BTC Dominance may be topping out.
This update confirms the original thesis. No need to overcomplicate — the plan is in motion, and unless the structure changes significantly, the outlook remains the same.
Best regards,
Stealth

BTC.D is about to die , long live Alts !Hello Traders 🐺
Oh I told you, my friend!
I predicted this dump a few months ago...
Now I can only say one thing to my audience:
👉 This is where patience finally pays off!
So my friends, this is the beginning of the end for BTC.D, because as you know — nothing can go up forever!
And yes... the Altcoin Season officially started yesterday 🔥🚀
📊 Let’s look at the data:
We’ve got a huge blow-off top on the BTC.D chart and a strong pump on both ETH.D and ETH itself 👇
📉 ETH Dominance:
📈 ETH Price Action:
💥 My ETH trade setup before the breakout:
Okay my friend, I’ve already shown you the path on the weekly chart, and in my opinion, this is one of those life-changing opportunities to load up on Alts — especially ETH and large caps — because we’ve officially entered Phase 2! 😎📈
If you're still not sure what I mean by Phase 2, check out this idea I posted earlier:
🔗
📉 Let’s zoom into the 4H for a better entry:
As shown above, the price may retest the 64.11% level before another leg down, so make sure to act accordingly!
And as always, remember our golden rule 💎:
🐺 Discipline is rarely enjoyable, but almost always profitable 🐺
🐺 KIU_COIN 🐺

Dominance BTCHere’s something interesting on the 4H chart.
We can clearly see that BTC dominance has broken its bullish structure. A retest around 64.50% is likely, followed by a potential 2.60% drop toward 62.50%.

Bitcoin dominance hasn't turned bearish yet.
The timeframe for review is daily.
Due to the decrease in Bitcoin dominance and the price increase of Bitcoin, altcoins experienced significant growth.
The overall trend on the daily timeframe is still bullish, so don't act based on FOMO. To buy coins in the spot market
, we need to wait for a weakening trend in Bitcoin dominance on the daily timeframe.
With confirmation of a weakening trend on the daily timeframe,
it's possible to buy some coins that are bullish relative to Bitcoin.

BTC Dominance Cliff DivesWe’re seeing one of those rare moments in crypto – Bitcoin is rising, and Bitcoin dominance is falling hard at the same time. That’s like spotting a unicorn renting a beachside apartment on Mars.
This move is largely being led by ETH, which I’ve been screaming was overdue for a breakout. To be fair, I’ve been early on that call... for a while now. But it’s finally happening.
ETH massively outpacing Bitcoin on a move like this is the clearest signal yet that an “alt season,” or something close to it, might be on the table. When ETH leads, the rest often follow. The rising tide lifts all boats – even the dead ones.
The dream scenario for altcoin holders? Bitcoin keeps climbing slowly or goes sideways, giving ETH and the broader altcoin market room to run. Confidence is returning, and for now, the rotation is real.

BTC Dominance at Crucial Support– Altseason Incoming OR Ending? 📊🚀 Bitcoin Dominance at Crucial Support – Altseason Incoming? 🌈💰
If you’re wondering why I’ve been focused on BTC more than altcoins recently, this is exactly why! Dominance plays a critical role in understanding market cycles and timing those explosive alt moves.
📚 Quick Recap:
BTC dominance reflects Bitcoin’s market share versus altcoins.
Historically, altcoin bull runs often begin when BTC dominance tops out and reverses.
The last big altseasons kicked off from the 73% dominance zone—but remember, history doesn’t always repeat, it often rhymes!
🔎 Current Chart Observations:
BTC dominance is currently testing support at 63.41% within an ascending channel.
Resistance sits at 64.25%.
The dominance is flirting with re-entering the channel, but hasn’t confirmed yet.
📈 Probability Outlook:
✅ 62% chance BTC dominance breaks down—bullish for altcoins!
❌ 38% chance dominance holds and moves higher—bearish for altcoins.
If BTC dominance breaks down from this level, it won’t just be a red candle—it’ll be a flashing green light for altcoins! 🚦📈
Mastering these cycles is crucial if you want to position yourself properly ahead of the next big alt moves.
One Love,
The FXPROFESSOR 💙

BITCOIN DOMINANCE TOPPED FINALLY? Bitcoin Dominance Peaked Finally 🚀 🚀
You can see in the image that Bitcoin Dominance is now Breaking its Bullish Structure, and clearly indicating that it's topped and Altseason is ready 40x to 50x gains are coming for you if you are still here surviving all the pain and Blood in past years and months.
Congratulations to you. People will call you lucky but they don't know how much you have suffered.
Let's go back and talk about Btc Dominance
BTC dominance is breaking the bullish structure we just need some candles close below these levels which i have marked.
And on weekly timeframe 3rd tap of RSI Bearish divergence also done.
So many things are coming together.
Let's hope for the best and Good Luck

btcd trendline bottomThe term "BTCD" refers to Bitcoin Dominance – a metric that measures Bitcoin’s market capitalisation as a percentage of the total cryptocurrency market. It gives insight into whether investors are favouring Bitcoin over altcoins.
When we mention a "trendline bottom", we're referring to a key support level on the dominance chart that has historically prevented BTCD from falling further. If BTCD is now touching or bouncing from this trendline, it may indicate a potential reversal or resurgence of Bitcoin dominance.
Why This Matters:
Support Level: If the trendline has acted as a bottom several times in the past, a bounce here could signal renewed strength in Bitcoin compared to altcoins.
Rotation Signal: A BTCD bottom often precedes a capital rotation from altcoins back into Bitcoin, suggesting that BTC may outperform altcoins in the short to mid-term.
Macro Sentiment: A strong BTCD trendline can reflect investor caution – moving into Bitcoin as a "safer" crypto during uncertain times.
BTC.D : READY FOR ALT-SEASONHi Guys, Hope You well
As you can see, the trend is finally breaking and the downtrend is starting again for the growth of the altcoins in the market. I hope you get the best profits from this alt season, which may be the last alt season and the best in this market cycle.
SecondChanceCrypto
⏰ 9/May/26
⛔️DYOR

Bitcoin Dominance: Don't Be So OptimisticHello, Skyrexians!
My previous CRYPTOCAP:BTC.D forecast now is playing out well. I bet for the reaching 65.35% before drop, we have seen 65.5% which is almost the same. Now dominance is dumping, but I warned you it's not the end. Now I will give you small update.
I will not cover higher degree waves, you can check previous articles, let's cover only this Elliott waves cycle. The wave 3 now is finished slightly above the 1.61 Fibonacci level and now is printing wave 4, to make sure that wave 4 is finished we want to see the Awesome Oscillator zero line cross and reaching the target area next to 63.5%. After that I expect wave 5, it's not going to be extended because wave 3 is extended, so, the target is 65.5% again to retest. After that we can wait for bigger correction to 61%.
Best regards,
Ivan Skyrexio
___________________________________________________________
Please, boost this article and subscribe our page if you like analysis!


BTC.DThe way this chart has been I'm not even going to guess lol.
Great to finally see some down pressure, now the key here is to see some follow through.

Bitcoin Dominance being rejected at major resistancePlan is simple. If the Bitcoin Dominance getting rejected it will draw down other altcoins as well. Probably leading to an altseason if ETH explodes.

A Table to show you Money Flow when BITCOIN DOMIANCE MOVES
A Simple Rule of Thumb can be followed when BITCOIN DOMINANCE moves up or down and it can save you a fortune if you use it properly.
BTC.D - BTC - ALTS
increase - increase - Decrease
increase - Decrease - Decrease Rapid
increase - Stable - Stable
Decrease - Increase - Increase Rapid
Decrease - Decrease - Decrease / Stable
Decrease - Stable - Increase
Currently we are seeing BTC.D Decreasing and yet the BITCOIN Price in Increasing and ALTS are INCREASING
Tjhis is Great BUT you need to watch BTC.D like a Hawk now because when that changes and begind to rise again, as it will do one day, maybe soon maybe in a month....then the likly hood of ALTS dropping Quickly is high
Bitcoin is now in heavy resistance and pushing through.
Pay attention to how long it can do that
The table above is your Saviour

BtcDominance will not BITCOIN Dominance will not hit 70%, idk why people keep saying this. Maybe 66% tops but as of now the falling wedge it ranges in the last two cycles do not play out with btcd hitting 70%.
We are on the cusp of alt season starting. However with crypto development since last cycle, this season is all about utility not memes. Xrp/ada/hbar/sol and any iso20022 compliant crypto will moon.

BTC Dominance Update… top could be formed. Too could be formed with btc dominance. We could be seeing the beginning of alt season start to unfold.

BTC.D done or not?I like to think that 65% may be the top for BTC.D, but it cannot be ignored that BTC.D has gone to around 72% in the last three cycles. Will it do the same this cycle?

The 4 Crypto Dominance charts and 4 x TOTAL charts -ALT ?
There are some charts we should always refer to in times where we feel change may be upon us.
The chart above are
Bitcoin Dominance ( BTC.D ) - Ethereum Dominance ( ETH.D )
Others Dominace ( OTHERS.D) and USDT Dominance ( USDT.D) ( I use USDT as it remains the largest Stablecoin by market cap)
The RED line in these Daily charts is the 50 day SMA
In most of my posts recently, I have been mentioning how Strong BITCOIN is remaining while under a Lot of resistance.
But we really should not forget the rest of the market. THE ALTS
The Fabled ALT Season has been running away from us, making many wonder just what is happening.
To explain, while BTC.D remains high, it shows us that the Money remain invested in Bitcoin.
When this Dominance Drops, in the past, it has signalled the rise of investment into ALTS.
Called ROTATION, the money rotates from one asset to another.
Due to the corporate investment in Bitcoin, this rotation has not happened.
BUT IS IT ABOUT TO ?
Let look at a few things
BTC.D has been rising continuously for Months now, It is way above that 50 day SMA. PA could fall a Long way before the support of that 50 SMA is required and I notice as I type, that is is beginning to drop. It's local support may help
ETH.D has begun to Rise but we need to pay attention to this as it could get rejected once again by the 50 SMA. Ethereum has had a very hard time this cycle and has yet to show any sustained recovery
OTHERS.D - Now OTHERS is the one I watch most. Others is the Top 125 Coins MINUS the Top 10 by market cap. This shows us the Mid to Low cap Alts coins.
This is also rising right now but once again, we need to wait and see if it breaks through the 50 SMA that has rejected it many times.
The USDT.D has been dropping. This shows that USDT has been rotated into other assets. Bullish but I have to say, that as I write this, I have just noticed that this has begun to rise also though only on a 1 hour chart so maybe just Noise but it is worth watching.
So, on these dominance charts, we see a potential start to a rotation but with the likely hood of rejection of the 50 SMA, It could be the First step of a bigger move.....But with potholes in front.
The Next Logical thing to do is to look at the TOTAL market Cap charts, to compare this dominance.
This chart shows us the Daily charts for
TOTAL Crypto market Cap - TOTAL2 ( minus BTC )
TOTAL3 ( Minus BTC & ETH ) - OTHERS ( Top 125 coins Minus top 10 by Dominace )
SMA;s in chart are RED= 50, BLUE = 100, GREEN = 128, YELLOW = 200
The TOTAL is the ONLY one that has PA above all the SMA's, potentially offering Support on many fronts. It has also had the most sustained Rise. Hence the high level of Dominance in the Market.
TOTAL2 is above the 50 SMA that has rejected it previously and is about to hit into the 100. We need to see if this will be rejected or not.
Remember how the ETH.D is also facing rejection off the 50SMA - ETH is under pressure
TOTAL3 is above the 50 and appears to have broken through the 100. This is VERY Bullish for the ALT coins and could show us some potential for a continued rise as sentiment continues to turn positive. But we should watch that 200 as a potential problem
OTHERS has the largest and strongest rise and again, is above the 50 and appears to have broken through the 100. This chart has the largest gap between current PA level and the next SMA that may reject it. This is the same on the Others.D chart
SO, in conclusion, The potential for a Rotation does exist but it is going to be hard fought. There is the possibility of a HIGH volitle state for the next few days, possibly Weeks.
If you are going to rotate out of Bitcoin, Be VERY CAUTIOUS until at least the next SMA have been claimed on both sets of charts.
The nest bets are on the Mid to lower Cap ALT coins.
BUT I will say this. I cannot See BITCOIN Selling off to invest in ALTS. I also see Bitcoin continuing higher against the USD.
IF we get an ALT season now, It will be Quick, Volatile and possibly with Quick Pump and Dumps on most ALTS.
The larger ALTS will survive this better than the Meme, small caps in my opinion
For me, the ROTATION that creates an ALT Season will occur with the rotation of money from ALT to ALT and NOT BTC to ALT
What ever you do, Remain in Peace and Safety

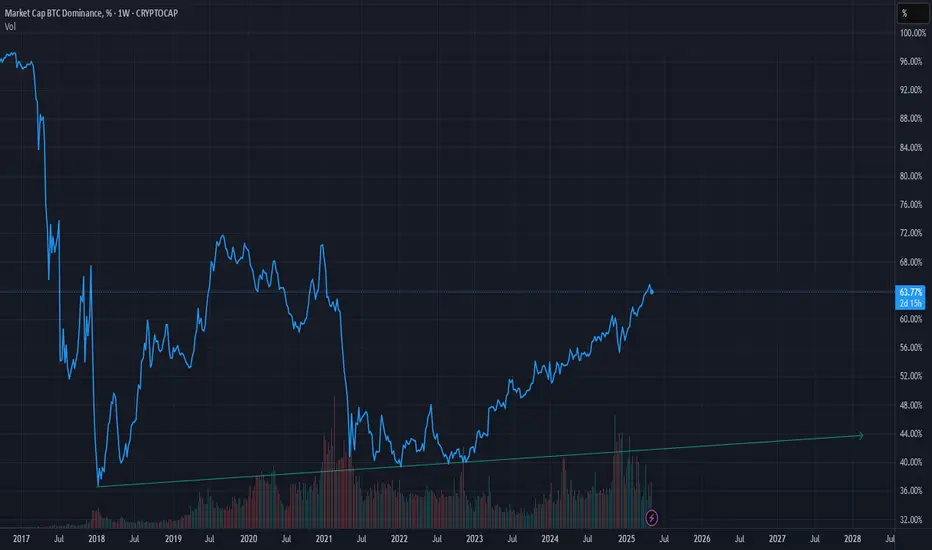
BTC Dominance: Approaching Major Resistance!!BTC.D is nearing a major 66%-68% resistance zone within a long-term ascending channel (since 2018). Historically, this area has triggered BTC.D pullbacks, often leading to altcoin rallies. The chart itself anticipates a rejection from this level.
If BTC.D rejects, a move towards the 53-54% lower channel support is likely, potentially bullish for alts. Watch for bearish weekly candle closes and increased selling volume as confirmation. Altcoin price action should also be monitored for signs of strength. This key resistance zone presents a significant point for the broader crypto market. Exercise caution and await.
If you find this analysis helpful, please hit the like button to support my content! Share your thoughts in the comments, and feel free to request any specific chart analysis you’d like to see.
Happy Trading!!

Is dominance finally due for a pullback?- Bitcoin dominance has been in a relentless uptrend
- 3D RSI now hitting levels that historically have resulted in at least temporary pauses/pullbacks in trend
- should this materialize I expect alts like ETH, Maker, EOS and SUI to do very well
