Crypto Phases Explained: From Bitcoin Season to Full-On FOMO !Hello Traders 🐺
I hope you're doing well. In this idea, I want to dive into the different phases of the crypto market, because I feel like many new traders — and even some semi-pros — still don’t fully grasp this fundamental concept. So make sure to read this until the end and feel free to ask your questions in the comments below!
🔹 PHASE 1 – Bitcoin Season
This is where it all begins.
You can guess from the name: BTC starts outperforming almost every altcoin, especially ETH. In this phase, Bitcoin’s price often grows rapidly while most alts lag behind. As BTC's market cap rises, Bitcoin Dominance (BTC.D) also increases — and this is clearly visible on the chart.
In the current market, BTC.D is rising toward a key resistance level, suggesting we are still in late Phase 1, but possibly approaching a shift.
🔹 PHASE 2 – Ethereum Season
Why ETH and not the rest of the altcoins?
Because when smart money rotates out of BTC, the first stop is usually Ethereum, the second-largest asset by market cap. ETH is also the backbone of many other projects, so it makes sense that it leads the altcoin wave.
When ETH starts to outperform BTC, that’s your sign: Phase 2 has begun.
🔹 PHASES 3 & 4 – Altcoin Season
This is the fun part. 🤑
In Phase 3, we typically see larger cap altcoins (top 100 projects) begin to surge and hit new all-time highs. Then comes Phase 4, the final leg of the bull cycle — full-on FOMO. Even low-cap coins start doing 20x or more, and yes, many small investors suddenly feel rich.
🔎 So… how do we know what phase we’re in?
Excellent question. But a tricky one.
As mentioned, BTC.D is showing signs of weakness near a long-term resistance trendline. That could mean BTC is topping short-term, and ETH might soon start to take the lead. To confirm that, just watch the ETH/BTC chart closely.
For deeper confirmation, add these charts to your watchlist:
OTHERS/BTC
TOTAL2
TOTAL3
They help you see when capital starts flowing into mid and low-cap alts — and help you track the sunrise… and the sunset. 🌅
Final Note:
If you’re still confused during market volatility, don’t worry. Trading is a long and tough journey — and patience is key. Learn from your mistakes, stay disciplined, and always remember:
🐺 Discipline is rarely enjoyable, but almost always profitable. 🐺
Stay sharp,
🐺 KIU_COIN 🐺
Trade ideas

BTC Dominance - AltseasonExpecting a move down to the 200MA in white or grey
This aligns with the fib circle 1.618 in blue
This will be the third strong alt season
Bearish for dominance for now
Weekly timeframe

Bad News From Bitcoin Dominance: Pain AheadHello, Skyrexians!
I got sick for these 5 days that's why has not shared updates, but market was very boring so we didn't miss any significant move. CRYPTOCAP:BTC.D concerns me now because to end this trend we need to see any significant correction, but we didn't. On the 12h Awesome oscillator was not able to cross zero line and reversed to the upside, so our main change is that daily time frame measures the wave 3 inside the major impulse.
If we count waves inside this impulse price is approaching 1.61 Fibonacci level at 65.3% and trust me it's much better to see it's reaching before the drop. When this wave will be finished, wave 4 will happen. It can bounce significantly to 61%. This is strong target area and I am sure we will be there soon. Wave 5 can be extended, can be not. The max target is 71%! Sounds awful. The likely target at 66-67%, to make it more precise let's wait for wave 4 finish.
I plan to close in profit those part of trades which has been opened after Feb 3 dump on this potential bounce to have money to add on the last huge shakeout. People believe in altcoins too much, very unlikely to have altseason now. Ready for hate!
Best regards,
Ivan Skyrexio
___________________________________________________________
Please, boost this article and subscribe our page if you like analysis!

Altseason Loading? BTC Dominance Hits Key Resistance!The BTC Dominance chart is testing a long-term weekly resistance zone.
Every time it hit this trendline in the past, we saw a strong reversal. If history repeats, altcoins could soon gain serious momentum.
Stay alert. A shift might be coming.
#BitcoinDominance #Altseason

Btc.d targetting lows.This is the short term target.
* The purpose of my graphic drawings is purely educational.
* What i write here is not an investment advice. Please do your own research before investing in any asset.
* Never take my personal opinions as investment advice, you may lose your money.

buyingThe launch of altcoins is approaching. We are still in the Bitcoin dominance zone. Many of those who rush will lose patience. A lot of patience.
Soon things will become clear.
This is not financial advice

BTC Dominance weakness of uptrend Bitcoin's dominance has failed to establish a new high, suggesting a significant weakening and a lack of upward momentum. This failure strongly indicates that Bitcoin's dominance is poised for a reversal from this point, potentially initiating a new downtrend. Furthermore, a compelling bearish divergence is forming on Bitcoin's dominance on the weekly timeframe's Relative Strength Index (RSI). This bearish divergence is a robust indicator of a potential trend reversal. Considering these factors, there is a high probability of witnessing a decline in Bitcoin's dominance in the near future.

when is ALTCOIN #bullrun??if the bitcoin dominance managed to reach
67.8_ 70.7 by the date of 9 June
I'll be expecting a top formation
so I'll be looking for bearish price action there
trade safe
and follow for more

Bitcoin Dominance: Neutral — But Bears Are LurkingBTC.D holds the 50 EMA... but barely.
Momentum flattening. Volume drying.
No breakout = Structural risk increases.
Failure here could trigger altcoin rotations.
Neutral isn't safety.
Neutral is a loaded spring.
Stay tactical.
#Crypto #BitcoinDominance #AltseasonWatch #QuantMindset

BTC Dominance: What a Rise Could Mean for the MarketTechnical view:
Rejecten from EMA 20 & 50 as support and the upward move has been confirmed by a breakout above the 63.47% level.
The next target for BTC.D is around 64.34% – 64.49%.
This scenario remains valid as long as price holds above the 63.17% level.
Understanding BTC Dominance (BTC.D) and Its Market Impact
Bitcoin Dominance (BTC.D) measures the percentage of total crypto market cap that belongs to Bitcoin. When BTC.D goes up, it usually signals that money is flowing into Bitcoin and out of altcoins. This often happens during risk-off sentiment, uncertainty, or when BTC is making a strong move.
➡️ A rising BTC.D can mean:
Altcoins may underperform or correct
Bitcoin is leading the market trend
It's safer to focus on BTC-related trades
On the other hand, when BTC.D goes down, altcoins often shine—especially mid and low-cap ones—marking what traders call an altseason.
⚠️ So if BTC.D breaks resistance and trends upward, it might be a good idea to reduce exposure to altcoins and monitor BTC closely for momentum trades.

Crucial Level to Watch on BTC.DWe can see that CRYPTOCAP:BTC.D is still in a bullish trend and is currently testing a crucial level, which will determine whether it continues to make a higher high or starts weakening towards its previous low.
The influence of CRYPTOCAP:BTC.D on the crypto market is simple: if CRYPTOCAP:BTC.D moves higher, it means more money is flowing into Bitcoin. For example, if CRYPTOCAP:BTC.D is at 64%, it means 64% of the total crypto market capitalization is in Bitcoin, and the remaining 36% is spread across altcoins like CRYPTOCAP:ETH , CRYPTOCAP:SOL , CRYPTOCAP:DOGE , CRYPTOCAP:PEPE , etc.
Conversely, if CRYPTOCAP:BTC.D moves lower, it means more money is shifting into altcoins.
Strategy when CRYPTOCAP:BTC.D is rising:
You can allocate more into Bitcoin rather than altcoins. Alternatively, you can find altcoins that are outperforming Bitcoin.
How to find altcoins that outperform Bitcoin?
Look for altcoin/BTC pairs, for example: BINANCE:WIFBTC , BINANCE:NEARBTC , or $BINANCE:TAOBTC.
If the price of BINANCE:WIFBTC is going up, it means SEED_WANDERIN_JIMZIP900:WIF is gaining more value compared to $BTC. If it's going down, it means Bitcoin is performing better than $WIF.
Back to CRYPTOCAP:BTC.D :
Currently, CRYPTOCAP:BTC.D is testing the 64.19% – 64.10% zone.
This area will determine whether CRYPTOCAP:BTC.D continues upward or starts to weaken.
To get early confirmation, you can zoom into the 1-hour chart and look for signs of bullish divergence.
If bullish divergence appears on the 1-hour chart, it often leads to a bounce on the 4-hour chart and a potential continuation of the bullish trend, possibly breaking the previous high.
However, if there's no bullish divergence confirmation, or if there's a strong rejection at the support level, CRYPTOCAP:BTC.D is likely to weaken and move towards its previous low.

A wonderful ALTCOIN Bullrunis all set in motion.
If my chart resonates with you in any way.
The combined dominance charts of the big four.
#BTC.d
#ETH.d
#USDC.d
#USDT.d
We are on our way to my anticipated target zone.

WELCOME TO THE BEGINNING OF ALT COIN SEASON!Traders, Hodlr's and Soon to be Liquidity (late retail buyers),
This is likely the moment we have been waiting for. Last week in our weekly VIP market update we discussed just a few things that would really show us if we just saw the bottom of the alts and if it was now time to start seeing some new local HH's and then HL's showing us a shift in trend. I had posted a few trades pointing this out. We have now at this point accomplished what we were looking for to see if we would be starting Alt coins season.
We have been watching a few things. The first being Bitcoin Dominance or CRYPTOCAP:BTC.D as this is a great chart to watch and look for reversals prior to looking at the chart of the specific alt coin against BTC to see if it also is showing it could have a rally or a pullback based on your bias on this BTC.D chart. For instance if I were to want to see maybe when XRP would likely start breaking out say that this BTC.D chart is in fact correct and the triangle trend line will end up being the top for btc dominance at around 64.4% of the total market I would go to BITSTAMP:XRPBTC to give myself some insight on confluence of market movements.
Being that we are now here at the point that I believe we will start to see money flow into alts based on this chart and others such as CRYPTOCAP:TOTAL2 , CRYPTOCAP:TOTAL3 and CRYPTOCAP:TOTALDEFI and the specific BTC pairings that I am holding by looking up the ticker of my alt coin/BTC and studying that chart I will honestly say that I am in the 90%/10% bullish on alts to bearish.
I hope this information helped you in your journey to get more information and come up with your own analysis to base your investment decisions and you become prosperous for doing soo!
Stay Profitable Folks,
Savvy!

BTCD
As we have continue to be bullish after every point. I think its going turn around lol.. been stuck here a few days lets see which direction it picks.

BTC dominanceI know its hard to wait... but it will be worth! Altcoin season should be here very very soon.
Also ETH dominance hit all times low :D

BTC.D: Time to go down!Will BTC.D finally grab the liquidity at 64.83% this weekend and top out? Altseason seems to be closer than ever this cycle.


BTC.D Needs to Hit 71% For Alt Season To HappenI hate to be the bearer of bad news, but the face-melting Alt Season we are all patiently awaiting is not arriving until BTC.D reaches 71%
Having said that, there WILL be an outlier of Alts that outperform CRYPTOCAP:BTC , such as CRYPTOCAP:SOL 💯

Dominance the system core- for me it has always been very complicate to explain BTC.D to peoples, because it's complicate ! lol
- it's weird to understand the moves and many factors have to be compared together an alchemy have to happen to see something happening.
- So basically to explain it, i will tell you what "we want to see" or "what we don't want to see" in the future. if the story repeats again.
1/ BTC.D have to grow up, then Altcoins will struggle down trying to find a potential bottom.
- While BTC.D grow up, BTC price have to grow up also or at least stabilize ( this is a good sign )
2 / if BTC price down and BTC.D up, it's bad, it's just the normal way ( No Divergence )
- When BTC price + BTC.D both up together, it's a kind of " inversed divergence ", it means something good gonna happens. ( get it ?)
- Basically also if USDT/USDC Dom Grow and BTC price stabilize and not goes down anymore, it's a good sign.
- Normality the normal way is : BTC up / USDT/USDC.D Down OR BTC Down / USDT/USDC.D up.
- Before we had no reason to check those Stables coins because they had not much DOM in markets, but now have to count with them.
- So While BTC.D is growing, altcoins will just make some weak moves.
- When BTC will reach is next Dominance's ATH ( witch have to be lower than last years because more concurrence )
- BTC.D will crash and ALT SEASON will start.
- it took me many years to understand that, but it's pure logic ( Fibonacci is working perfectly on it )
- again it's not easy to get it.
- if you have any questions feel free to add a comment.
Happy Tr4Ding !

bitcoin dominance & etheriumSure! Here's the English translation of what you just wrote:
In the past, when Bitcoin dominance reached around 70%, Ethereum tended to rise.
And here's the expanded version of the explanation I just shared, also translated into English:
📈 Summary of Past Patterns: When BTC Dominance Approaches 70%, ETH Tends to Rise
💡 Typical Flow
BTC Dominance Rises
→ The market moves primarily with Bitcoin, while altcoins (including ETH) are relatively ignored.
→ ETH price either moves sideways or declines.
BTC Dominance Reaches Around 70% (a historical high)
→ Bitcoin's dominance trend reaches a potential peak.
BTC Dominance Starts to Decline
→ Investors start to take profits from BTC.
→ Funds rotate into altcoins, especially large-cap ones like Ethereum.
→ Ethereum begins to rally.

btc.d chartbtc dominance chart easy breif where i want to tell you that dominance breaking this trand may result shift of money from btc to altscoins.

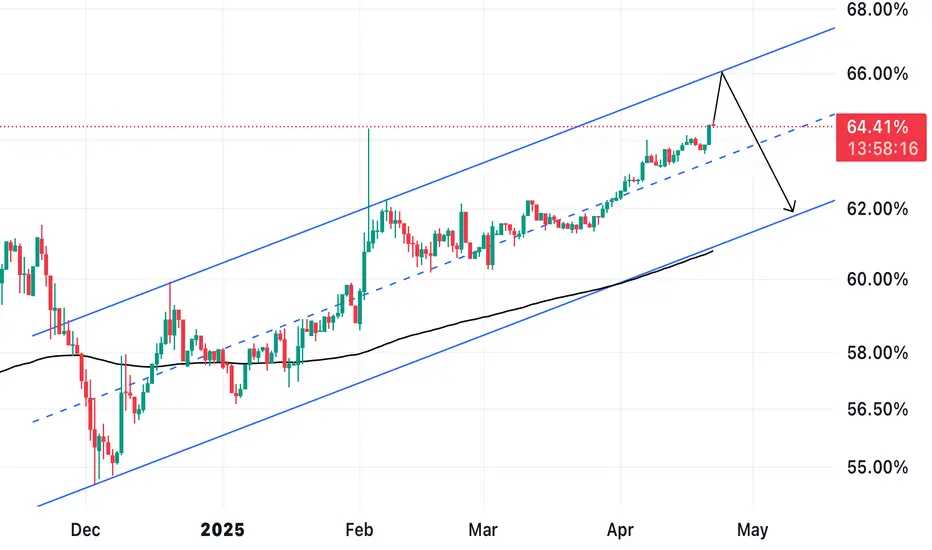
The D to 66%This ascending channel is still valid. If dominance reaches 66% and then drops drastically, it will make room for alts to recover from the bloodbath.
Where is the liquidity ?BITSTAMP:BTCUSD COINBASE:BTCUSD BINANCE:BTCUSD CRYPTOCAP:BTC COINBASE:BTCEUR
Here I present you the chart that shows the dominance of CRYPTOCAP:BTC.D and the major stablecoins CRYPTOCAP:USDT.D and CRYPTOCAP:USDC.D is in the crypto market. These assets now hold 68% of the total market cap. This means :
" For every $1 coming into crypto, about $0.60 goes into BTC and stablecoins, but only $0.40 goes into thousands of other cryptos."
Will this dominance decrease?
At some point, yes. The fall of BTC and stablecoin domination together with new money coming into the market is often the precursor for an Altseason. If fresh money do not flow into the market, altseason may be underwhelming as funds would merely rotate between BTC and stablecoins in addition to other assets, rather than growing the market.
But why does BTC tend to hold relatively well during market corrections while altcoins face harsh drops?
This is a function of market structure and liquidity distribution, something you can read about in my article "Portfolio Stability" , a must read to better your understanding of crypto market dynamics.
