$BTC.D Triple Top Reversal – Dominance Peak Cracking?CRYPTOCAP:BTC.D CRYPTOCAP:BTC.D Triple Top Reversal – Dominance Peak Cracking?
Current trend: BTC.D's etched a textbook triple top at 60.1% resistance, now crumbling below neckline with bearish engulfing—classic reversal setup squeezing alts for a potential relief rally 📉.
Hold support? Shaky at 59.4%; volume confirmation on break could hold if buyers defend, but momentum favors sellers.
Breakout above resistance? Low odds—needs 60.5% recapture to invalidate, otherwise deeper fade 🚀.
Dip risk? High to 58.5% on confirmation, unlocking alt dominance shift.
Target: Downside 58% short-term; rebound max 59.8% if support bites.
Indicators tracking: RSI (45, bear divergence), Volume spike on reds, and neckline breach 📊.
#BTCDominance #TripleTop #AltcoinPioneers
Trade ideas

$BTC.D Dominance Squeeze – Bulls Defending the Throne?CRYPTOCAP:BTC.D CRYPTOCAP:BTC.D Dominance Squeeze – Bulls Defending the Throne?
Current trend: BTC Dominance is coiling in a tight range after a rejection at 60.5% resistance, now testing the critical 59.7% support—signs of BTC's grip tightening amid altcoin fatigue 🦅. That purple support line is acting as a magnet for buyers on every dip.
Hold support? Strong yes, with low-volume rejection candles and rising histogram—dominance unlikely to crack lower without fresh alt pumps.
Breakout above resistance? Watch for a close over 60.5% to signal deeper BTC outperformance, potentially squeezing alts harder 📉.
Dip risk? Moderate to 58.5% if ETH/BTC rallies, but stochastic oversold (below 20) hints at a quick reversal.
Target: Upside to 62% on confirmed break; downside buffer at 58% for contrarian alt plays.
Indicators tracking: Stochastic for momentum shifts, Volume Profile for support validation, and 20 EMA crossover 📈.
#BTCDominance #AltcoinSeason #CryptoMarkets

A gift from Trump will launch the ALTSEASON - BTC dominance!📣 Hello everyone!
US President Donald Trump has said he wants to pay the country's citizens "dividends" from customs duties in the amount of at least $2,000 per person. The corresponding entry was posted by the head of the White House on Sunday, November 9, on the Truth Social network.
"People who are against tariffs are FOOLS! We are now the richest and most respected country in the world, with virtually zero inflation and record stock market performance," Trump said.
"We are receiving trillions of dollars and will soon start paying off our HUGE DEBT of $37 trillion. The United States is experiencing record investments, and factories are being built everywhere. Everyone will be paid dividends in the amount of at least $ 2,000 (excluding those with high incomes!)," the message continues.
__________________________________________
The National Cryptocurrency Association has presented the results of its largest study on cryptocurrency owners in the United States, showing a wide and diverse population using digital assets for everything from purchases to long—term investments. The report, based on a Harris Poll conducted in late January and early February 2025, analyzed the responses of 54,000 adults, identifying 10,000 current cryptocurrency owners.
The audience is far from elitist: 21%, or one in five American adults — approximately 55 million people — own at least a small part of the cryptocurrency. Some use it to invest in their financial future, others for art and games, and still others are just curious and trying out a novelty. In addition, many are already using cryptocurrency for everyday purchases.
__________________________________________
Anonymous Trader: Part of these payments from Trump will inevitably go into investments in the cryptocurrency market. Against the background of a reduction in the interest rate of the US Federal Reserve, risk appetite will grow, at least until a certain plateau in the rate is reached or the question of raising it against the background of renewed inflation does not arise at all, but it's too early to think about it yet! At least one more decrease is forecast on December 10, 2025, and the next Fed meeting will be held only on January 28, 2026! And of course, it is worth noting the curtailment of the QT program from December 1, 2025, the balance will no longer be reduced, but there are also no words about printing money until the labor market collapses - but this is a positive moment in any case for risky assets.
In the meantime, where should I invest the $2,000 I received for free?? - Of course, to the violas! - People don't want to earn 10-20-30% in Bitcoin in half a year, but they want to earn +200-300% in alts in a month!
__________________________________________
Technical information:
1. For the first time in the last 3 years, a "death cross" has formed on the Bitcoin dominance chart, which threatens Bitcoin's dominance for at least the next 1-2 months.
2. We saw exactly the same bearish crossover in April 2020! The dominance of Bitcoin has collapsed from 69% to 57%
_________________________________________
Total: The exact date on which payments of the $2,000 gift from President Trump will begin is unknown. Despite this, the chart shows BTC dominance.D I expect a decrease in November-December to at least 55%, which will have a positive impact on the altcoin market. I do not rule out that dominance may break through the 55% support and go even lower, launching a full-fledged altcoin season for strong fundamentals and from the point of view of altcoins charged for growth. 🚀🚀🚀
That's all for today, I wish you good luck in making independent trading decisions and profit. Please analyze the information you receive from me, always think only with your head!
Goodbye! ✊


$BTC.D Support Test – Altseason Tease?CRYPTOCAP:BTC.D CRYPTOCAP:BTC.D Support Test – Altseason Tease?
BTC Dominance sliding bearish on 1H, hugging support at 59% after bounce from 60% resistance—hold here eyes mild rebound to 59.5%, but breakdown targets 58.5% for stronger alt gains.
Positive for alts!
Key indicators: RSI at 40 (bounce zone), declining 50MA, low volume on upside. 📉🌙
#BTCDominance #Altseason #AltcoinPioneers

BTC Dominance at Resistance! Alt Season Possible? Folks, take note! The BTC Dominance is currently hovering at a crucial resistance level
If it decides to drop, then brace yourself for an Alts Rally during an Uptrend. But if it breaks out, the Alts may either tumble or move sideways based on the Market Momentum

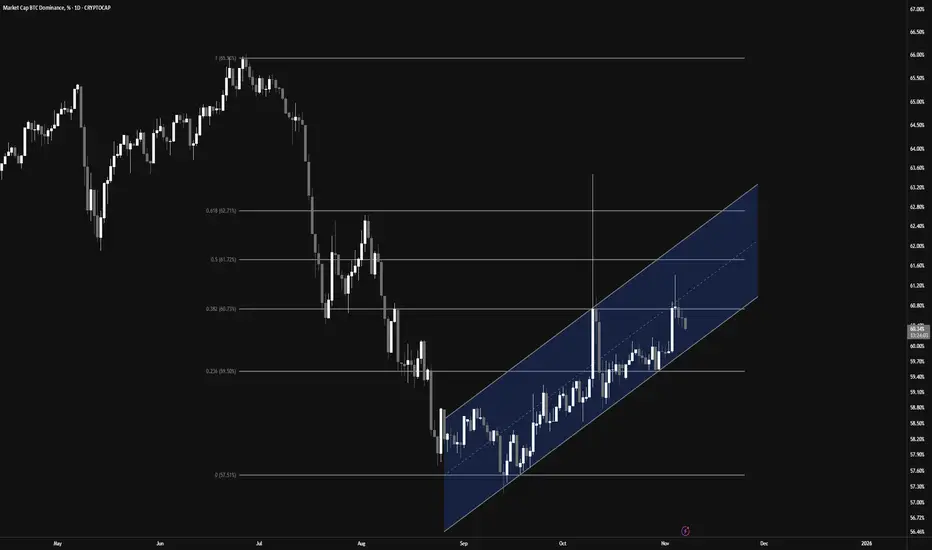
$BTC.D 4hBitcoin Dominance has broken down from the Ascending Channel and aiming Head & Shoulders pattern, signaling a potential shift in market momentum.
After several higher lows, price failed to sustain the uptrend and confirmed a downside breakout, suggesting money may start rotating back into altcoins.
Trend Bias: Bearish
Pattern: Ascending Channel → Downside Breakout and forming Head $ Shoulders pattern
Implication: Altcoins could gain short-term strength while BTC dominance cools off.
#BTCD #BitcoinDominance #Altcoins #CryptoMarket

$BTC.D Dominance Dip Signals Alt Rally?CRYPTOCAP:BTC.D Dominance Dip Signals Alt Rally?
BTC Dominance trending bearish on 1H, testing key support at 59.6% after sharp pullback from 60.5% highs—holding here could spark rebound to resistance, but risk of deeper dip to 58.5% if breached, fueling altcoin surge.
Bullish for alts overall! Target: 58% on breakdown.
Watching: RSI at 35 (oversold bounce potential), declining 50MA, low volume. 📉🚀
#BTCDominance #Altseason #CryptoMarkets

Bitcoin Dominance Breakdown Ahead? Altseason Signals Emerging!Analysis:
BTC Dominance is showing strong signs of weakness.
After a failed breakout and rejection from the upper boundary of the descending channel, dominance is now testing the short-term ascending trendline (orange).
Losing this level (~59%) could trigger a deeper drop toward 57% and possibly 54.5%.
Main scenario (65% probability):
🔻 Breakdown below 59% → bearish continuation → capital rotation into altcoins.
Alternative scenario (25%):
⚖️ Sideways movement between 59–61% before decision.
Bullish invalidation (10%):
🟢 Daily close above 61.5% → short-term BTC strength continuation.
Momentum and structure both favor downside — altcoins may soon take the lead.


BTC Dominance Retests 50 EMA — Alt Season Loading?BTC dominance broke below the 50 EMA and is now retesting that zone after a sharp correction.
If it fails to reclaim the EMA, we could see dominance sliding lower, giving room for altcoins to rebound.
But a clean reclaim above this level might extend BTC’s lead a bit longer before the next rotation.
DYOR, NFA

BTC.D ANALYSISBTC.D has been falling in recent days, while BTC stabilizes above level 102000 leading to Altcoins to get into new upward momentum, seems that the market dominance will keep in a downtrend for a while, that is if it breaks its current level let's keep watch

Once againHere we go a battle of the 20mma
Gains below this line
Pain above it.
Only good thing right now Others Dominance looking like some at the moment…

Bitcoin Dominance Rejection and Altcoin Pump👋🏻 Hey everyone! Hope you’re doing great! Welcome to SatoshiFrame channel.
✨ Today we’re diving into the 1-Day Bitcoin Dominance analysis. Stay tuned and follow along!
👀 On the daily timeframe, Bitcoin dominance has reached a key resistance zone at 60.73%. If this level breaks, we could see a deeper correction across altcoins. However, a rejection and move downward could trigger a strong rally for altcoins. As Bitcoin’s market weight decreases and capital flows into altcoins, we might be entering an early altseason, presenting potential profit opportunities.
🕯 From a technical perspective, Bitcoin dominance is moving within a well-structured ascending channel. The midline of the channel acts as a solid rejection point. A Fibonacci retracement from the previous downtrend shows a 38% overlap with this midline — a tough level to break. After a strong bearish candle rejection from that area, dominance is now heading lower. If the move continues, we could see a test of the channel’s lower boundary, and a confirmed breakdown would strengthen the altcoin bullish scenario.
💰 Typically, capital rotation in crypto follows this pattern: money flows into Bitcoin, then Ethereum, then the top 10 coins, and finally into smaller altcoins — before converting to USDT and exiting the market. With Bitcoin dominance currently at high levels after a solid Bitcoin season, this could signal the early stages of capital shifting toward altcoins. Traders should watch closely for these shifts to maximize profitability.
❤️ Disclaimer : This analysis is purely based on my personal opinion and I only trade if the stated triggers are activated .
BTC DOMINANCE Final phase of my analysis.
If this high at 60-62% stays here then this high will be the right shoulder.
Anything above will invalidate this idea.
A weekly hns is massive for downside.
So 44% still on table in the overall channel.
Lets see how this plays out nove-dec-jan
Btc should start going up also.

BTC.D and altseason until the end of 2025BTC.D will refuse to show a significant fall in 2025. First week of 2026 is the beginning of altseason preview. It will end in March.
Currently BTC.D is #overbought and relief bounce in alts is imminent lasting for a couple of weeks with suddent reversal.

BTC Dominance Analysis (1D)It seems that wave G is not yet complete because its time frame hasn’t fully played out, and the upward momentum is strong enough that with a little pause, it could move toward higher zones to complete wave G.
A key area has been marked on the chart; if it gets breached, this index could experience a deep drop.
The chart is a bit complex, and for now, this is our view on Bitcoin dominance.
Let’s see what happens.
For risk management, please don't forget stop loss and capital management
When we reach the first target, save some profit and then change the stop to entry
Comment if you have any questions
Thank You

BTC.D May not TOP until next September!Despite alt/BTC pairs looking battered
**Capitulation is likely not complete**
Most Altcoins remain in downtrends v BTC
Timeline:
2025: grind to 63-65%
2026 Final Push to 73%?
Altcoins to seek relief once this finally turns around.
You may be able to start DCA'ing BTC as early as next March in preparation to buy beaten down quality Alts...
focusing on ETH, SOL, and 2's that have usage... not simply clogging up the landscape of empty chains.
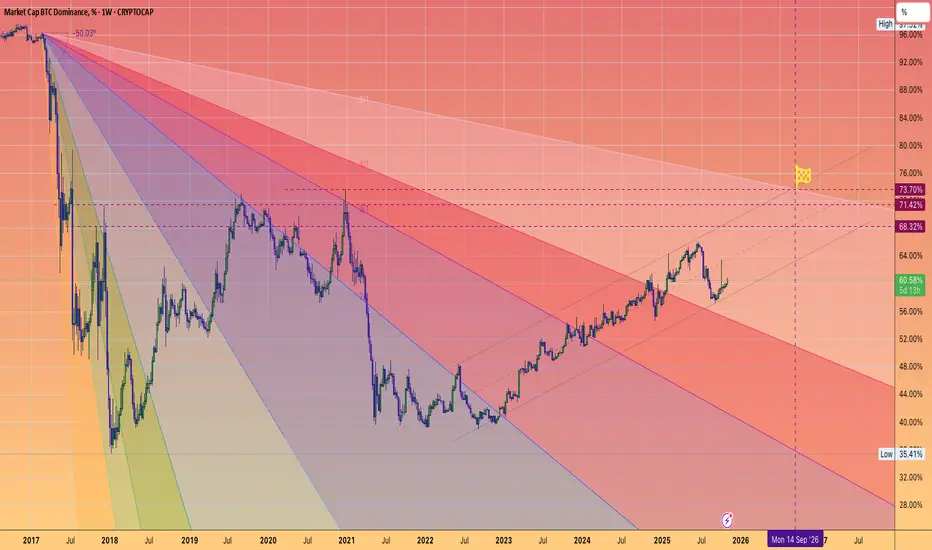
BTC.D wyckoff accumation playing outBeen monitoring this for 2,5 years. BTC.D is aiming at 73% after backtesting 53%. Implosion of non-BTC crypto.

BTC DominanceBitcoin Dominance gives up 1 year after each halving. You should accumulate altcoin as long as Bitcoin dominance is above 50%.

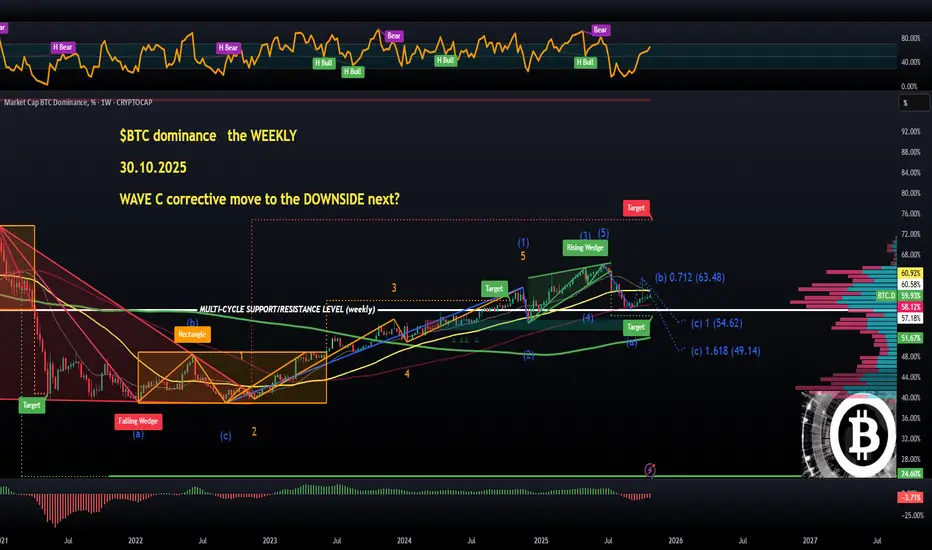
$BTC dominance (WEEKLY): WAVE C to the DOWNSIDE next?One of the last bits of hopium that still makes sense from a technical perspective is this WEEKLY CRYPTOCAP:BTC Dominance chart, which shows a clean Elliott Wave structure.
Based on this count, the dominance either has completed, or is currently in the middle of a dead cat bounce (WAVE B) — which briefly peaked around 63.5% during the 10/10 market collapse.
If that’s correct, the next move should be a WAVE1 C down, targeting a deeper correction toward 54.6% or even 49.1%.
This outlook perfectly aligns with the expected #Altseason which typically kicks in during Q4. As long as BTC.D remains below the yellow 50 MA, the trend stays bearish — with a lower low already printed and a lower high likely forming.
Being a strong believer in both Elliott Wave Theory and the cyclical nature of markets, I’ll continue buying dips — since several altcoins are likely to see powerful rebounds from key support zones.
That’s my main strategy for Q4.
👽💙
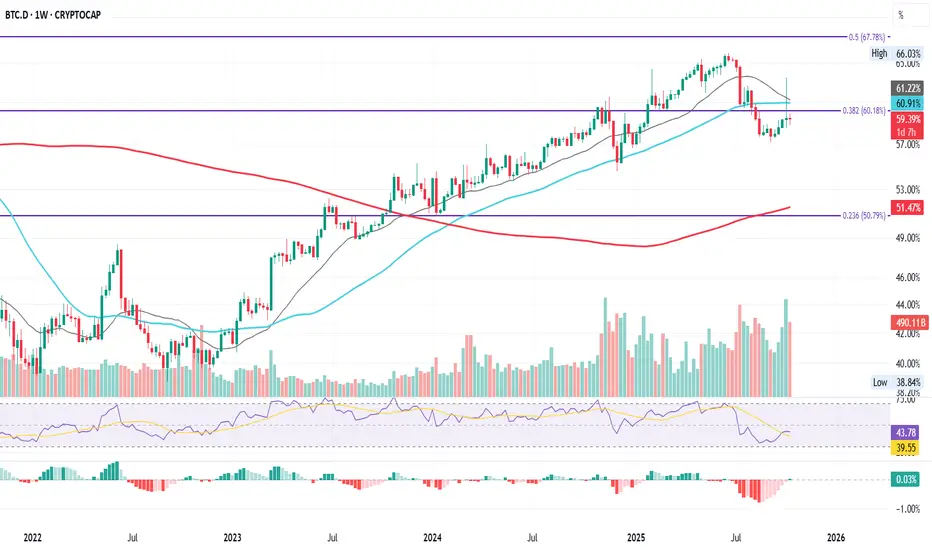
BTC.D Weekly Series – Tracking the 60% level , Week by Week
This is BTC Dominance (BTC.D) on the weekly.
After climbing steadily since January 2023, BTC.D followed both the 21-week (grey) and 50-week (cyan) MAs all the way up, reclaiming key Fibonacci levels at 50% (0.236 Fib) and 60% (0.382 Fib) before finally getting rejected at the 0.5 Fib near 67%.
That rejection in June 2025 marked a structural shift: BTC.D dropped below the 21W and 50W MAs, and back under the 0.382 Fib (60%).
Last week’s flash recovery briefly spiked above these levels, but failed to hold, closing back under.
This week’s candle is confirming that weakness again.
Until the 0.382 Fib turns into solid support, dominance remains technically in a downtrend: meaning capital might be slowly rotating away from BTC toward ETH and large-cap alts.
For traders, this level defines the next phase:
Hold above 60% → BTC continues to dominate.
Break lower → rotation and volatility spread wider across the market.
Either way, BTC.D is the map, and this chart is worth watching closely in the coming weeks.
Bias: Bearish-to-neutral short term, trend losing momentum while capital flow diversifies.
Always take profits and manage risk.
Interaction is welcome.
Alt Coin SeasonAlt season has not started yet. Probably it is about to start.
The red lines mark important 2021 support levels for BTC dominance (Blue line).
Purple line is the alt coin dominance.
Black line is the BTC price in USD.
It would be easy to jump to the conclusion that ALT coin season is starting, upon this chart, because the critical support level on BTC Dominance, from 2021, has been broken. Nevertheless a warning:
Warning: Alt coin season truly depends on BTC price going up. If BTC price drops marking the end of the cycle, so it is for Alt coins too. It would be over. Therefore, one must keep a careful eye on BTC/USD price action, to ensure not to fall into a bull trap!
FED cut rates impact: I expect Sept. 17th, to be bearish on the FED cutting rates, for a short time. This would be a "Buy the rumors, sell the news" type of event. I think, but I may be wrong of course.
However, in the middle term (Oct-December) it wold mark the last bull run of this cycle, for everyone, alts and BTC, hopefully.
Disclaimer: this is not a financial advice. Do your own research. I own several cryptocurrencies and this idea and plot represents only my mere opinion. I hold no responsibilities for misinterpretations from this material.
