$ETHBTC: Weekly trend turning bullish again...Good afternoon lads,
Ethereum vs Bitcoin is now bullish in the short and mid term and can trigger a monthly timeframe trend soon if strength persists in the coming month.
Sentiment had reached the depths of hell by Friday Nov 21st, when I was at the Devconnect event, chatting with traders and people there I noticed that everyone was against my bullishness, and very keen on confronting or even ridiculing me for my views.
Since then, I started to DCA back into crypto positions after having reduced exposure massively when BITSTAMP:BTCUSD was at $115k and CRYPTOCAP:ETH circa $4k.
Let's see how things evolve, but know that reward to risk is skewed to the upside here.
Best of luck!
Cheers,
Ivan Labrie.
Market insights
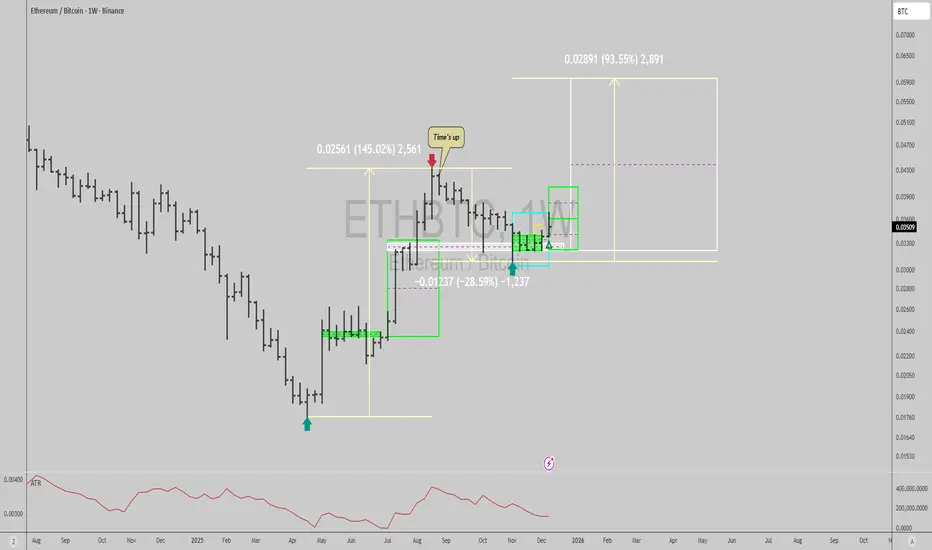
ETHBTC - HTF 3 Wave Buildup + Key Support & ResistanceMost important chart in crypto right now.
Be positioned before 0.043
Buy any dips after the Santa Rally down to current resistance 0.037
Distribute/TP within the shaded box area
ETH/BTC 6 hour Coinbase ChartETH/BTC Just closed a 6 hour candle at 0.03452 the same close 18 hours ago, but a higher wick than the previous close. The RSI is was higher this last 6 hour period. The Chaikin Oscillator sits at 0 with my settings.
I’m not predicting anything, it’s just an interesting observation. I will remain neutral adhering to risk management.

$ETH / $BTC Breakout on Daily TimeframeETH/BTC has appeared to breakout on the daily timeframe, with a successful backtest and continuation higher. This is a great sign for alts in general, but remaining cautious with all the volatility that comes with FOMC decisions. Would like to see this hold and have a strong weekly close to give a clearer picture on mid term direction!
Ehtereum/Btc chart and timing for altseasonPotential targets in theory by timing (May 2026) end of altseason and top in BITSTAMP:ETHBTC pair for Ethereum
I don't think we will reach level of May or Dec 2021
Targets more conservative without any idea of supercycle for altcoins
We retested and hold the line around Point of control by volume
Bearish scenario for support its again test of Weekly FVG
Bullish uptrend to Order Block/Buy side liquidity and main order block!

ETH/BTC MULTI MONTH HIDDEN BULLISH DIVERGENCEETH could be gearing up for continued outperformance against BTC. This with BTC.D set to decline, gives the bulls ammo to push alts higher.

Altcoins Get a Boost as ETH/BTC Breaks StructureETH/BTC breaking out of the falling wedge is a positive sign for the altcoin market.
When this pair starts gaining strength, it usually boosts overall altcoin performance.
If ETH holds this breakout, it could ignite a broader altcoin rotation in the coming sessions.
DYOR, NFA
#PEACE
Please hit the like button if you like it, and share your views in the comments section.

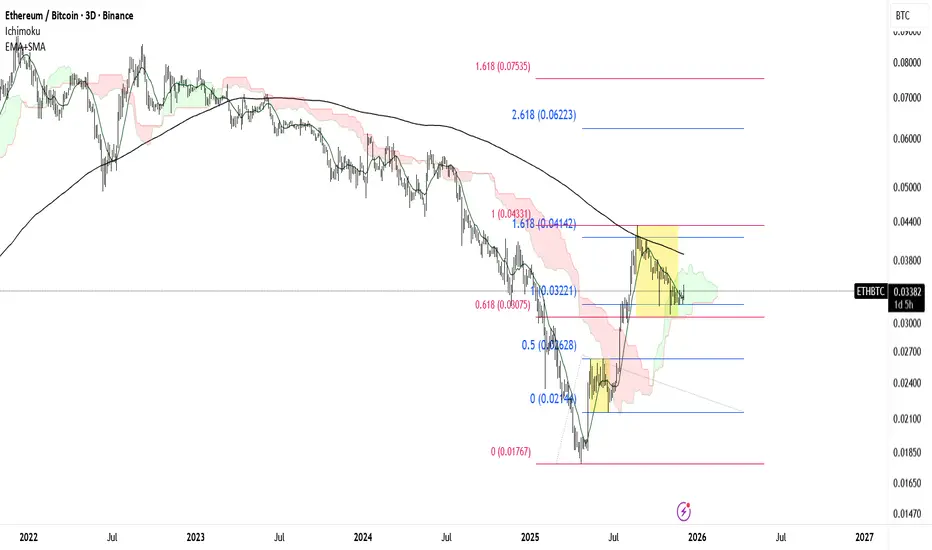
ETH/BTC on the Edge of a Macro BreakoutIt appears that #Ethereum is on the verge of its next major bullish leg.
The 3 day 237 SMA has acted as a key structural resistance, and #ETHBTC has now completed its retracement into the 0.618 Fibonacci zone a level I consider the end of the corrective phase.
A clean breakout above the 237 SMA would likely open the path toward the 0.06 channel, where the next macro resistance cluster resides.
the rise of eth.good eve'
i bring you this really clean chart today.
ethereum divided by bitcoin.
historically, after bitcoins run, money begins to rotate into ethereum, and then into alt coins.
i believe we are at the edge of what could be a pretty solid run in the ethereum ecosystem,
especially since the fusaka upgrade is now live.
scaling eth has never been easier, nor faster, and we believe the speeds are only going to improve as the devs create more breakthroughs in their research.
---
eth/btc came down in a clean 3 wavy move from the recent highs in august.
i choose to label it as a triple zig-zag, the same way i choose to label both eth + btc's waves during the same timeframe.
3-3-3, hypothetically completing at the recent low.
if my postulation is correct, ethereum should return to its all time highs. if it does, and there's enough momentum, we could enter into a price exploration.
not sharing any real targets beyond the ath.
---
eth/btc 🎯 = 0.04327

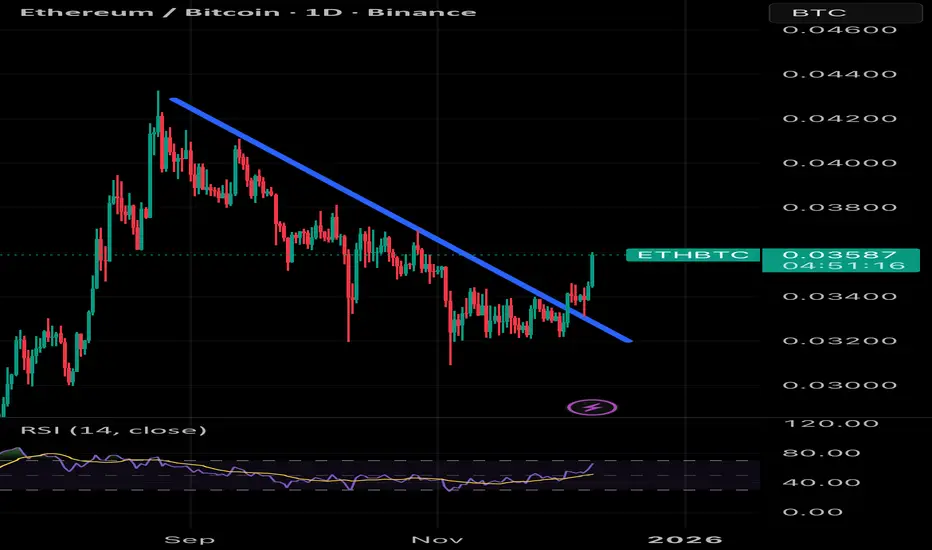
ETHBTC: Trend-Line Break to outperform BTCThis weekly chart maps ETH performance relative to Bitcoin over the last few years and highlights a long, persistent downtrend. The red line captures the major descending resistance that has capped every significant ETHBTC rally since 2022, while the blue line marks the latest corrective downswing inside that broader structure.
The recent move forms a series of lower highs and lower lows against Bitcoin, compressed under the blue trend line. If price breaks and closes above this blue line, it would signal that the current micro downtrend is over and that ETH is starting a new leg of outperformance versus Bitcoin.
Such a breakout often acts as confirmation that capital is rotating back into ETH, favoring ETH‑heavy allocations.
Above, the red trend line remains the key macro resistance and a logical first upside objective for any ETHBTC recovery. This line has rejected multiple rallies in the past, so even if price breaks the blue trend line and accelerates higher, the red line is where many traders will look to take profits or at least tighten stops, expecting potential rejection.

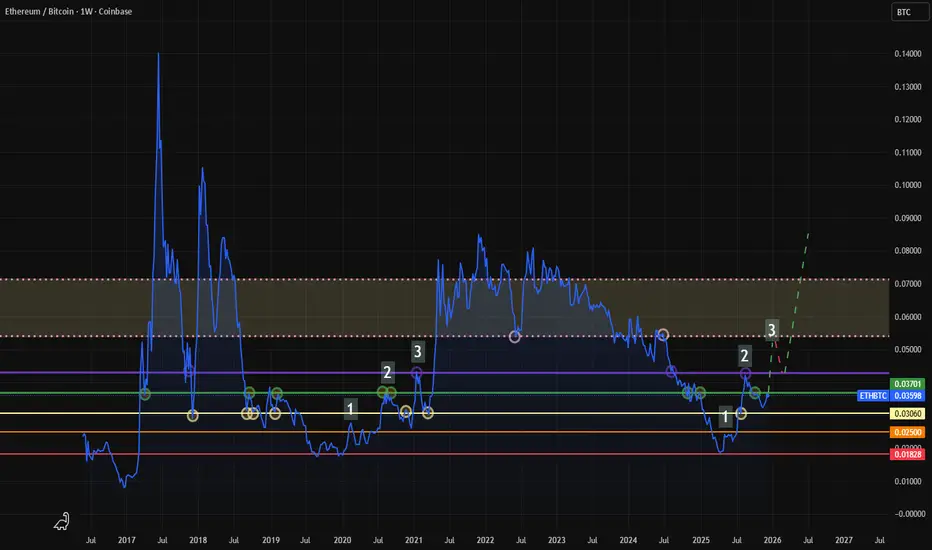
ETH/BTC – Weekly Fractal Repeating the 2020 SetupThe chart currently shows a highly similar structure to the Ethereum/Bitcoin weekly pattern from late 2020, right before the major altcoin season.
2020 Pattern Recap
• A clear S9 Buy signal triggered on 16 Nov 2020
• Price broke above the red Ichimoku cloud, confirming a major trend shift
• A retrace into support followed in December
• Momentum flipped bullish and ETH/BTC accelerated into a multi-month rally
• Strong continuation after retest → Last major altseason (Q1–Q2 2021)
2025 Current Structure
• A new S9 Buy signal triggered on 10 Nov 2025
• ETH/BTC has broken above the red Ichimoku cloud, signaling potential trend reversal
• Market is currently in the first retracement, same as in Dec 2020
• Weekly structure shows higher low formation + early momentum shift
• If the fractal continues, the next move historically was a strong vertical expansion phase
• Major resistance zones above align with long-term equilibrium levels
Key Idea
The ETH/BTC pair is replicating the same sequence:
S9 → Cloud Breakout → Retrace → Expansion → Altseason
If the fractal holds, ETH dominance expansion could follow into 2026, just like 2021.

ethbtczero volume, RSI going down, in a down trend, Short trade???
there is no catalyst for this to go up. if it does its pure manipulation.
happy dec 1st

ETH vs BTC- Sometimes when we look at markets, we get confused by all the noise, Trump and governments news, ETFs, FED, bans, SEC, FUD, FOMO, fake stories, and more.
- As a trader, you must always step back from news, view the trend from a distance, and filter out that noise.
--------------------------------------------------------------------------------------------------------
Trading Parts (Monthly TF) :
--------------------------------------------------------------------------------------------------------
- Look at the trend and indicators, that’s what you should focus on first. ETH reached its all-time high in November 2021, and then retested that same ATH level in August 2025.
- Now look at the RSI and MACD levels at that time... In 2021, the RSI was overbought and the MACD crossed downward.
- Alright, now compare with where we are today. The RSI is only halfway to the top (even though ETH has already reached $5K again), and the MACD just crossed upward a few months earlier.
--------------------------------------------------------------------------------------------------------
In my opinion, we’re not topped yet and ETH still low. They will always try to scare you out so they can buy your bags cheaper.
Keep your attention on the opportunities others can’t see.
Happy Tr4Ding !

ETHBTC - Flipped from Bearish to BullishETH can be seen to have extreme resistance in the past with this 200MA
However now price has broken above it and is using it now as support on this daily timeframe.
I expect ETH to rally hard with this resistance to support flip.

ETHBTC 1DLet’s take a look at the #ETH chart against #BTC. #ETH is moving inside a falling wedge on the daily timeframe — a classic pattern that often leads to a bullish breakout. On the support side, we have the daily SMA200 along with the wedge support line. On the resistance side, we have the wedge’s upper boundary and the daily SMA50. We expect price to eventually break above this wedge sooner or later. If that happens, the potential targets are:
🎯 0.03519 BTC
🎯 0.03651 BTC
🎯 0.03783 BTC
🎯 0.03972 BTC
🎯 0.04212 BTC
❌ A daily candle closing below the SMA200 would be a bearish warning.
❌ A daily candle closing below the falling wedge would invalidate this analysis.
⚠️ Always remember to protect your capital with a proper stop-loss and disciplined risk management.

Ethereum — Swing Low Locked In - 60% ahead!
ETH has established its swing low, and now it’s all about watching for the next impulse.
Against BTC, the chart is clean. ETH is actively reclaiming the pivotal zone, and as long as it holds above 0.03, this setup screams continuation.
Nothing overly complex here — structure is intact, momentum is stabilizing, and the path of least resistance is up.

CRYPTO: ETH/BTC (1D)ETH/BTC Elliott Wave Outlook: Is More Downside Ahead for Altcoins?
The ETH/BTC pair continues to sit at a critical juncture, and the broader altcoin market is watching closely. Using an Elliott Wave framework, the current structure suggests that both bullish continuation and a deeper corrective leg remain possible — but the next move depends heavily on how price behaves at the present support zone.
Current Structure: Wave (4) or Something Deeper?
Based on the chart, ETH/BTC completed a strong impulsive rally into what appears to be Wave (3), followed by a prolonged corrective structure labeled W–Y, which forms the basis of Wave (4).
Price is currently consolidating inside a key support zone — an area that aligns with the 0.618 retracement of the prior major impulse. This is typically a high-probability region for a Wave (4) low to form. But so far, buyers have not shown strong dominance, and price remains under a descending resistance trendline.
Scenario 1: Support Holds → Wave (5) Rally
If ETH/BTC holds the shaded support block, we may see the next leg higher — Wave (5).
This would likely result in:
A breakout above the descending trendline
A move toward the Fibonacci extensions shown on the chart
Altcoins gaining relative strength against Bitcoin
Wave (5) targets typically project toward the 0.236–0.382 extension, aligning with the higher levels drawn on your chart. This would favor a strong ETH recovery relative to BTC into early 2026.
Scenario 2: Support Breaks → More Downside First
However, a break below this structure — especially a move beneath the previous swing low — would invalidate the bullish Wave (4) interpretation.
If that happens:
ETH/BTC enters a deeper corrective phase
Altcoins (especially ETH) may continue underperforming
Price could drop toward the deeper 0.618 Fibonacci zone
The "invalidations" level becomes a critical marker
This deeper decline would likely be the final washout before a much larger upside reversal — essentially completing the correction before a true macro impulsive wave begins.
So, Are We Expecting More Downside for Alts?
Yes — more downside is still possible, but not guaranteed.
The market is sitting at a decision point:
Hold support → Begin Wave (5) upward
Break support → One more significant drop before recovery
Until the current range resolves, ETH/BTC remains neutral-to-cautiously-bearish, with structural bullish potential still intact as long as the key invalidation level holds.

ETH/BTCHere is the range I'm looking at for the ETH/BTC pair. A bounce in this box means buying Ethereum will be more profitable than Bitcoin.

ETH/BTC Capital Rotation: Altseason Exhaustion ETH/BTC is losing strength below the 0.039–0.040 equilibrium, signaling capital rotation back into BTC.
Structure remains bearish while price holds under 0.041, with downside targets at 0.030–0.025.
This aligns with BTC’s drive toward 116K–126K where alts lag before the macro top.
Watch for reversal signs on alts only once this lower zone is filled.

ETH / BTC - 3 rising valleysNice 3 rising valleys here on ETH / BTC with the usdt pair putting in a daily 3 bar play. If Ethereum starts to run here on the pair, that would be a positive sign for risk, and another piece of the puzzle for an "alt season". Usually leading patterns like this have a little trickery to them before they reach escape velocity, usually in volatility, which could present another opening for entry in the coming days.

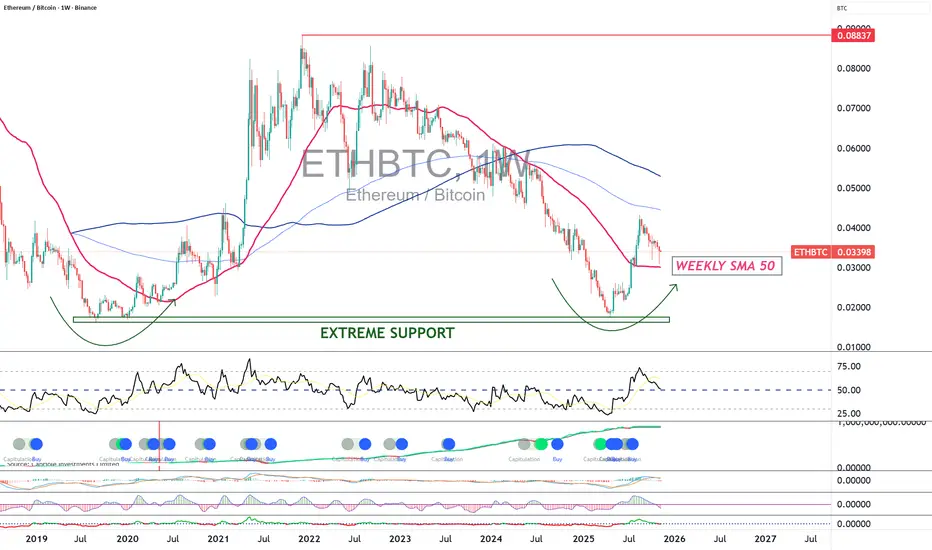
Ethereum could once again outperform BTCFrom a technical perspective, the ETH/BTC ratio appears ready to resume its upward movement after several weeks of consolidation. Both timeframes — daily and weekly — point to a bullish scenario for Ethereum against Bitcoin.
On the daily chart, the ratio is trading in an uptrend established since spring. The three green arrows mark successive rebounds on a solid ascending trendline. The next touchpoint, in November 2025, could show a precise rebound on this dynamic support, accompanied by a stabilization of momentum indicators (RSI and MACD). This setup suggests that the recent correction may be merely a pause before a new bullish impulse. As long as the ratio stays above 0.030 BTC, the structure remains constructive.
On the weekly chart, the long-term perspective reinforces this scenario. The ratio has formed a broad “cup” pattern, supported by an area identified as “Extreme Support” around 0.020 BTC. After several years of decline, Ethereum has regained relative positive momentum versus Bitcoin. A break above the 50-week moving average, followed by an orderly consolidation phase, could precede a new bullish extension toward the 0.045–0.05 BTC zone, or even higher in the medium term. Historically, every rebound from this support zone has been accompanied by a marked outperformance of ETH versus BTC.
ETF flows support the momentum
On-chain analysis and capital flows also reinforce this scenario. The chart of Ethereum spot ETF inflows and outflows shows a return of significant positive flows since mid-2025. After a period of net outflows during the summer, the trend has stabilized, reflecting renewed institutional interest. Historically, such inflows often precede sustained price increases for ETH.
In a context where Ethereum spot ETFs gain adoption and institutional demand grows, fundamentals support a recovery of the ETH/BTC ratio. If the current zone confirms its role as a floor, Ethereum could enter a new phase of outperformance versus Bitcoin in the coming weeks, supported both by technical structure and market flows.
DISCLAIMER:
This content is intended for individuals who are familiar with financial markets and instruments and is for information purposes only. The presented idea (including market commentary, market data and observations) is not a work product of any research department of Swissquote or its affiliates. This material is intended to highlight market action and does not constitute investment, legal or tax advice. If you are a retail investor or lack experience in trading complex financial products, it is advisable to seek professional advice from licensed advisor before making any financial decisions.
This content is not intended to manipulate the market or encourage any specific financial behavior.
Swissquote makes no representation or warranty as to the quality, completeness, accuracy, comprehensiveness or non-infringement of such content. The views expressed are those of the consultant and are provided for educational purposes only. Any information provided relating to a product or market should not be construed as recommending an investment strategy or transaction. Past performance is not a guarantee of future results.
Swissquote and its employees and representatives shall in no event be held liable for any damages or losses arising directly or indirectly from decisions made on the basis of this content.
The use of any third-party brands or trademarks is for information only and does not imply endorsement by Swissquote, or that the trademark owner has authorised Swissquote to promote its products or services.
Swissquote is the marketing brand for the activities of Swissquote Bank Ltd (Switzerland) regulated by FINMA, Swissquote Capital Markets Limited regulated by CySEC (Cyprus), Swissquote Bank Europe SA (Luxembourg) regulated by the CSSF, Swissquote Ltd (UK) regulated by the FCA, Swissquote Financial Services (Malta) Ltd regulated by the Malta Financial Services Authority, Swissquote MEA Ltd. (UAE) regulated by the Dubai Financial Services Authority, Swissquote Pte Ltd (Singapore) regulated by the Monetary Authority of Singapore, Swissquote Asia Limited (Hong Kong) licensed by the Hong Kong Securities and Futures Commission (SFC) and Swissquote South Africa (Pty) Ltd supervised by the FSCA.
Products and services of Swissquote are only intended for those permitted to receive them under local law.
All investments carry a degree of risk. The risk of loss in trading or holding financial instruments can be substantial. The value of financial instruments, including but not limited to stocks, bonds, cryptocurrencies, and other assets, can fluctuate both upwards and downwards. There is a significant risk of financial loss when buying, selling, holding, staking, or investing in these instruments. SQBE makes no recommendations regarding any specific investment, transaction, or the use of any particular investment strategy.
CFDs are complex instruments and come with a high risk of losing money rapidly due to leverage. The vast majority of retail client accounts suffer capital losses when trading in CFDs. You should consider whether you understand how CFDs work and whether you can afford to take the high risk of losing your money.
Digital Assets are unregulated in most countries and consumer protection rules may not apply. As highly volatile speculative investments, Digital Assets are not suitable for investors without a high-risk tolerance. Make sure you understand each Digital Asset before you trade.
Cryptocurrencies are not considered legal tender in some jurisdictions and are subject to regulatory uncertainties.
The use of Internet-based systems can involve high risks, including, but not limited to, fraud, cyber-attacks, network and communication failures, as well as identity theft and phishing attacks related to crypto-assets.

Potential ETH rallyWith a clear break and retest of weekly trend line.
A possible potential wave C or wave 3 rally
We might be heading for a strong bull move across all alt coins
