Short trade
📘 Trade Journal Entry
Pair: ETHBTC
Direction: Sell-Side Trade
Date: Thu 30 Oct 25
Time: 12:00 pm
Session: NY Session PM
Timeframe: 1 Hour
🔹 Trade Details
Metric Value
Entry 0.03498
Profit Level (TP) 0.031992 (+ 8.75 %)
Stop Level (SL) 0.03523 (– 0.71 %)
Risk–Reward (RR) 12.24 R
🔸 Technical Context
Wyckoff Structure:
ETHBTC remains in Phase E, completing distribution and entering the markdown sequence.
The pair broke consolidation support following repeated up-thrusts (UTAD) at premium pricing.
Market Structure Shift:
CHOCH confirmed bearish control after rejection from resistance (0.0359–0.0362).
BOS validated breakdown continuation toward the 4 hr FVG (0.0337 – 0.0333).
Phase E now marked by consistent lower highs and liquidity draws below structural lows.
Liquidity Targets / Zones:
Primary Target: 0.0319 (4 hr FVG + order block confluence).
Extended Objective: 0.0300 — deep demand and liquidity resting zone.
Resistance Zone: 0.0359 – 0.0362 (previous supply area).
Volume Profile:
Increasing sell-side volume through breakdown candle; institutional participation confirmed by accelerated momentum at liquidity breach.
🔹 Narrative & Bias
Following weeks of compressed distribution, ETHBTC finally confirmed bearish continuation through Phase E progression. The setup aligns with BTC dominance re-expansion and risk rotation away from ETH as capital flows toward Bitcoin safe-haven liquidity.
Sentiment Context:
Macro: Altcoin weakness amid USD resilience and broader market risk aversion.
On-Chain: ETH exchange inflows rising → evidence of distribution.
Technical: Repeated failures to reclaim resistance zone confirmed bearish supply control.
Projection:
Price expected to extend toward 0.0320 and potentially 0.0300 as the final liquidity objectives beneath September lows are met. Any re-accumulation likely to form only after a full mitigation of the FVG zone (0.0331 – 0.0319).
Market insights

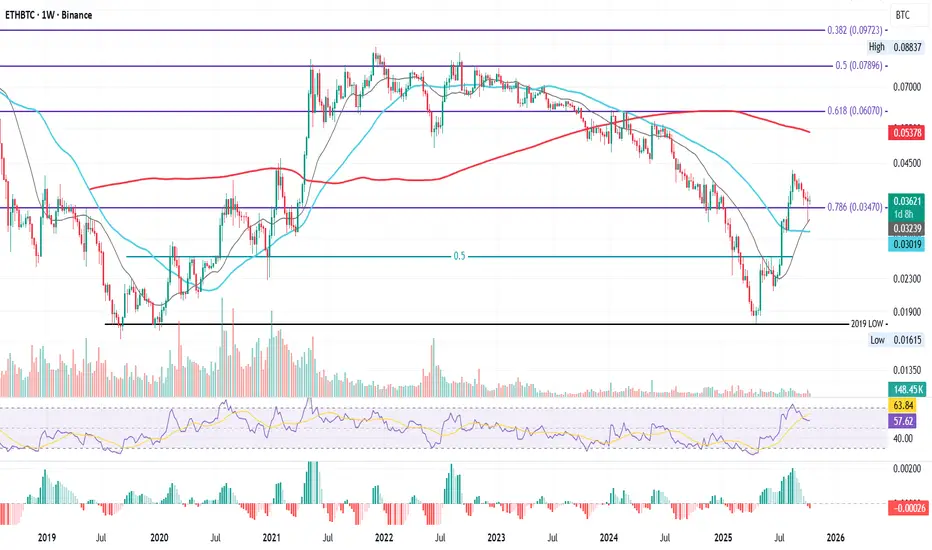
ETHBTC Weekly Series – Tracking the Shift, Week by WeekETHBTC Weekly – Confluence at the 0.786 Fib
This is ETHBTC on the weekly, now retesting one of the most important Fibonacci levels on the chart: the 0.786 Fib at 0.03470.
This time, price isn’t testing it alone. Just below, we have the 21-week MA and 50-week MA, both providing strong confluence. Last week’s flash crash on October 10th already tagged the 21-week MA, showing how reactive this area is for buyers.
This zone could serve as a structural base for a potential bounce toward higher resistance: such as the 200-week MA, or Fibonacci levels around 0.06–0.07. But for any of that to happen, price must hold here first.
That’s why, starting this week, I’ll be tracking this pair closely and updating this idea regularly, to better understand whether ETH can regain strength against BTC, and what that means for the altcoin market as a whole.
Because as history has shown:
when ETHBTC climbs, altcoins breathe again.
Right now, most alts look bruised after the flash crash, but some, especially those with real-world use cases, still hold long-term promise.
The key is timing.
And timing starts with ETHBTC holding this level.
Bias:
Neutral–bullish, strong confluence support, but confirmation needed through weekly close above 0.0347.
Always take profits and manage risk.
Interaction is welcome.
Ethereum is deciding where it wants to live.This is not a trade idea, this is a long term concept, most of my portfolio is swing when bull market comes (monthly/yearly) not trade (daily/weekly).
This is a solid question that will have to be played out in the upcoming years, Ethereum keeps changing its monetary policy and right now has less supply increase than BTC (due to burning mechanisms), will that stay forever? What will happen in the future to the policy? What it will mean for price?
Right now we can clearly see this is a bull case for future months.

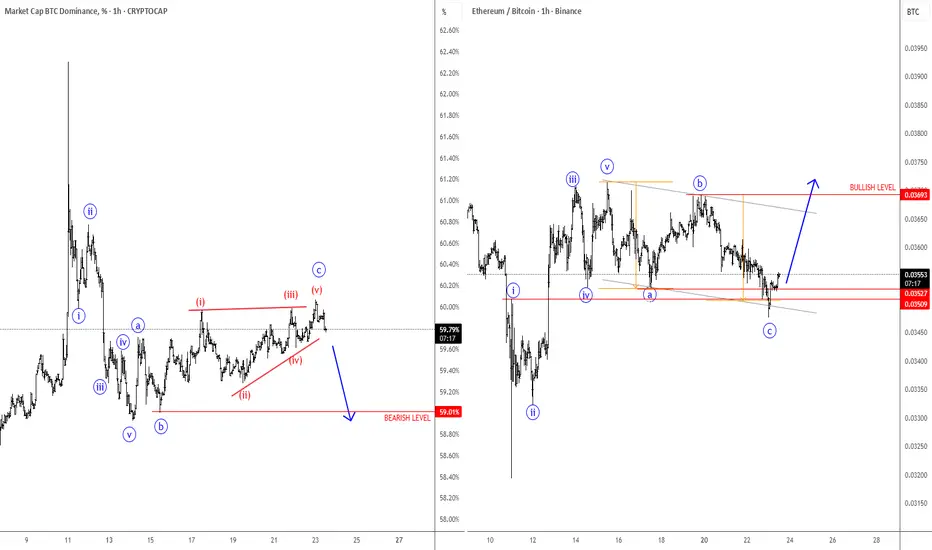
BTC Dominance Is Pointing Lower, While ETHBTC HigherBTC.Dominance chart made an impulsive five-wave decline, which confirms a bearish reversal. Currently, it still appears to be completing wave “c” of an abc correction, which could be forming a potential wedge pattern before further weakness.
As a result, after a five-wave rally on ETHBTC, which confirms a bullish reversal, it might also be finishing wave “c” of an abc flat correction, potentially finding support around the 0.034 area before another rally.
Overall, it seems that Ethereum and ALTcoins will continue to outperform Bitcoin, but a true ALTseason may only emerge if Bitcoin and the whole Crypto market experience a stronger recovery.
ETHBTC Rally into Q4📊 Ethereum vs Bitcoin (ETH/BTC) – Weekly Chart Update
ETH/BTC has officially broken out of its long-term downtrend (yellow trendline) that’s been in play since 2022. After the breakout, price is now retesting the previous resistance area — a classic move before potential continuation.
🔹 Key Levels to Watch:
Resistance Zone: 0.059–0.063 BTC (Fibonacci 1.272–1.414 extension zone, highlighted in yellow)
Major Target: 0.067 BTC (Fib 1.618)
Support: 0.033–0.035 BTC
Long-term support: 0.024 BTC
A successful hold above the breakout zone could confirm a trend reversal in favor of Ethereum dominance. A rejection, however, might lead to another leg down before accumulation.
🚀 Will ETH finally regain strength vs BTC, or is this just a relief rally?
#ETHBTC #Ethereum #Bitcoin #CryptoTrading #TechnicalAnalysis #AltcoinSeason #CryptoChart

ETHBTC. Is it almost altseason for Ethereum?Good afternoon, dear traders.
Here is the situation with the ethbtc pair. According to my observations, the altseason for a particular coin occurs when that coin rises in relation not to the dollar, but specifically to Bitcoin.
Here we see the following:
after a strong impulse, the price corrected to the 61.8 Fibonacci level.
An ascending flag is forming, or, as I like to call it, an impulse-correction-impulse formation.
To find the entry point for this pattern, you need to find a double bottom or an inverted head and shoulders in a corrective trend (in this case, a downward trend). Confirmation is the price consolidation above the 0.3850 level.
The target is the 1.618 level and above, which are also historical resistance levels on ethbtc.
What do you think? I'm interested to hear your opinion.

ETH is greater than BTCBitcoins value as of right now is greater than Eth but Eth is the one in the uptrend against Bitcoin. My money is on ETH over Bitcoin but who says you can't have both.
ETH/BTC ALT season ideaFirst time publishing.
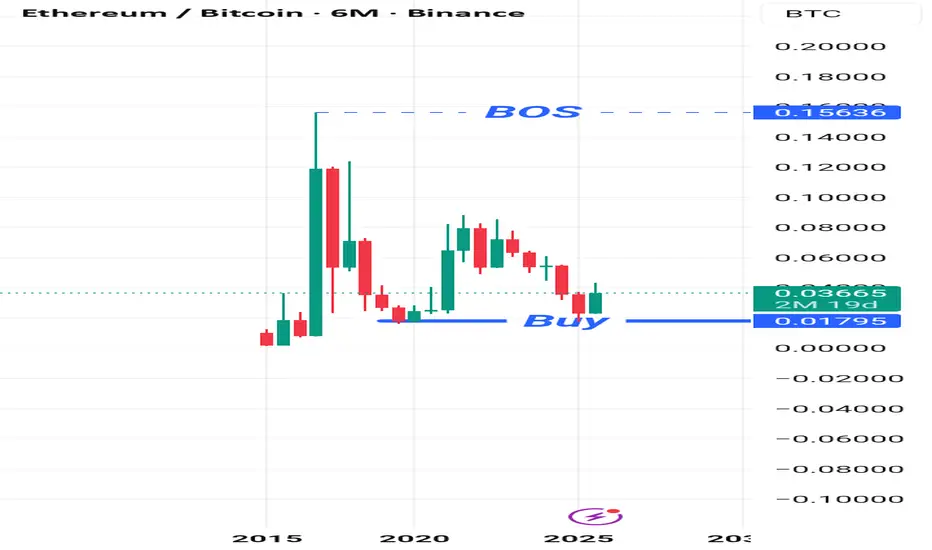
So, plain as it is. End of April 2025 ETH/BTC pair manages to bottom out to a level near to December 2019.
Significant level because this set the foundation for our dear and beloved altseason that blowed 6-8 months later.
BTC dominance peaked around 70 some %, ETH/BTC bottomed out and entered oversold territory.
We see quite some similarities here. Although, heres the thing, it cannot be the same. Crypto cap was significantly lower then, there are at least x1000 new pairs, so we will like not see BTC coming to nearly this % of dominance, and the story may unfold diffefently because of the ETFs that poured significant ammount of assets into BTC that will most likely not rotate into ETH and alts.
Bottom line, and what I await.
ETH/BTC lair makes strong push and closes 1 high. Monthly chart have left sweet FVG area to be filled, maybe during new years santa claus effect? Who knows, but the timing correlates.
My idea --- wait ETH/BTC higher low to form and look for possible RSI divergence that may confirm this theory unfolding until end of December.
I posted to simply get any feedbacj possibly regarding this corelation.
Thank you!
Either way, I am in no way in a position to provide financial advise, so DYOR before investing or trading your money.

eth\btcThe Ethereum / Bitcoin pair is showing a pattern quite similar to that seen in 2019.
The price received a strong reaction from the demand zone and is currently in a falling trend retest process.
If it manages to stay above this zone, the first target will be the mid-level supply zone, followed by the major supply zone (0.08 BTC).

ETH/BTC (1W)ETH/BTC (1W)
ETH/BTC is turning previous resistance into new support on the weekly timeframe.

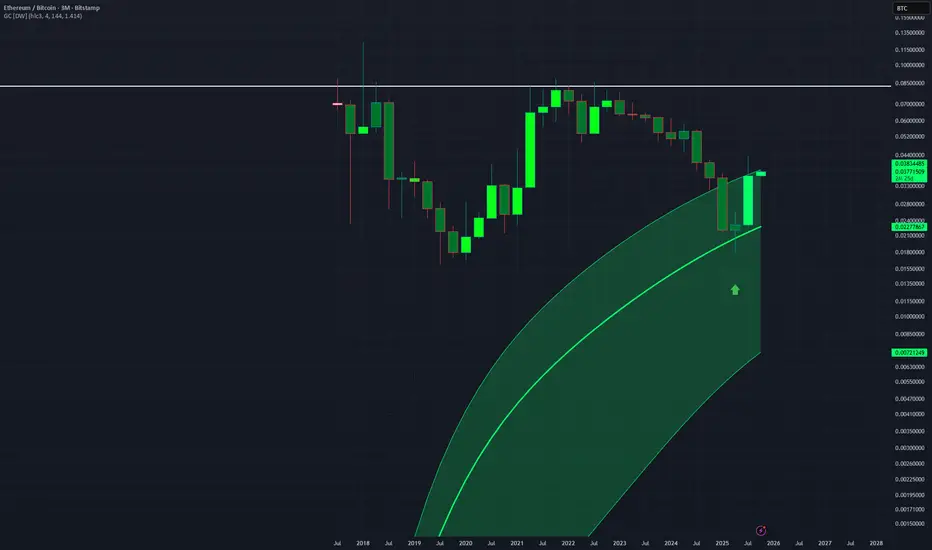
ETHBTC - Strong 3Month ReversalETHBTC has found its footing on the middle of this Gaussian Channel indicator.
From here likely it will continue to a top at the white horizontal line.
hopefully like 0.08
Very bullish on ETHUSD and altcoins
Long trade
📌 Trade Journal Entry – ETHBTC
🔻 First Trade (Sell-side)
Date/Time: Thursday, 25th Sept 2025 – 4:00 PM
Session: LND to NY PM
Entry: 0.037180
Profit Level (TP): 0.03003 (+19.23%)
Stop Level (SL): 0.037644 (-1.24%)
RR: 15.54
Outcome:
Trade closed on Friday, 26th Sept 2025 at 9:30 AM
Final TP: 0.03615 (+2.77%)
Final RR: 2.24
🔹 Second Trade (Buyside)
Date/Time: Friday, 26th Sept 2025 – 9:30 AM
Session: LND to NY AM
Entry: 0.03628
Profit Level (TP): 0.03741 (+3.11%)
Stop Level (SL): 0.03599 (-0.80%)
RR: 3.9
📊 Technical Structure
Consolidation Phase: Observed before the breakdown, with a range of 0.03539–0.03516.
Phase E Regression: Market transitioned from Phase D bottoming into a Phase E decline, characterised by lower highs. MSBs: Multiple market structure breaks confirm downside momentum before a potential reversal.
Demand Zone (4hr TF): 0.03611 – 0.03660 acted as the buyside support where a bullish response was initiated. FVGs: Noted along retracement path; price filled gaps before continuation.
🏦 Narrative
Sell-side Play: The first short capitalised on ETHBTC weakness, but the closure collapsed to a more modest 2.24 as profit, which led to the assumption of Buyside Recovery:
A clean demand zone (4hr TF) tap allowed for a reversal entry and upside aligned with order flow and EMA/WMA support.
Overall: This trade sequence shows an effective switch from distribution to the accumulation phase and Wyckoff alignment.

Short trade
Pair: ETH/BTC
Direction: Sell-side trade
Date: Tuesday, 23rd September 2025
Session: LDN to Tokyo Session PM
Entry: 0.037818
Profit Level (TP): 0.030306 (-19.26%)
Stop Level (SL): 0.038284 (-1.24%)
Risk-Reward (RR): 15.57
Wyckoff Narrative
Distribution Phase: Price exhibited signs of distribution after a prolonged uptrend, consolidating beneath resistance and forming supply at premium levels.
Upthrust After Distribution (UTAD): A liquidity grab above prior highs was observed, trapping late buyers before the market reversed downward.
Change of Character (ChoCH): The break below the consolidation range confirmed a bearish bias, shifting the market structure into markdown.
Phase D–E Progression: Price is transitioning from Phase D into Phase E, characterised by lower highs, lower lows, and confirmed supply dominance.
Target: Drawdown into deeper demand zones, consistent with Wyckoff markdown objectives and liquidity resting beneath prior lows.

ETHBTC LongThe BAT harmonic pattern suggests a promising upward trajectory for ETHBTC. This pattern begins at the $0.39 level, aligning with the critical 0.886 Fibonacci retracement level. From here, the price is anticipated to climb, with potential target points identified at TP1 and TP2.

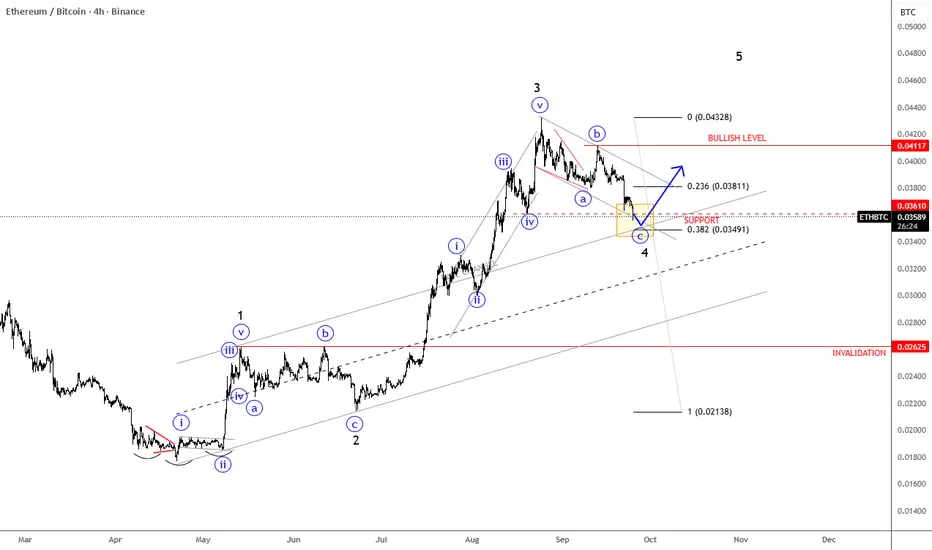
ETHBTC Has A TextBook Bullish PatternETHBTC Has A TextBook Bullish Pattern, as we see an ongoing five-wave bullish impulse by Elliott Wave model
ETHBTC pair is slowed down after a massive extension higher into wave 3, and it's right now testing important 0.035 - 0.034 support zone within an abc correction for wave 4. It's also trading at an important 38,2% Fibonacci retracement and base channel upper line, which can act as a strong support. So soon watch out for a bullish continuation within wave 5, especially if we see a rebound and recovery back above channel resistance line near 0.038 level. Bullish confirmation is above 0.041 level, while the invalidation level is at 0.026.
ETHBTC Technical WeeklyThe most prominent feature is a clear Inverse Head and Shoulders (H&S) pattern. This is a classic bullish reversal pattern that forms after a downtrend, signaling a potential shift towards an upward trend.
The thick red descending trendline from the top of the chart indicates the long-term downtrend. The price is currently trading below this resistance line. A break above both the Inverse H&S neckline (0.04191) and this descending trendline would provide very strong bullish confirmation.
The ETHBTC weekly chart presents a highly bullish setup with the formation of a confirmed Inverse Head and Shoulders pattern.
Bullish Scenario: A decisive weekly candle close above the neckline at 0.04191 would confirm the pattern and likely lead to a significant rally. The initial target for this move would be around 0.06020. This would imply that Ethereum is likely to outperform Bitcoin in the coming period.
Bearish Scenario: Failure to break the neckline and a potential rejection could see the price drop back to test the support levels of the Right Shoulder, possibly around 0.03440. A move below this level could invalidate the pattern and signal continued consolidation or a resumption of the downtrend, though this appears less likely given the pattern's development.

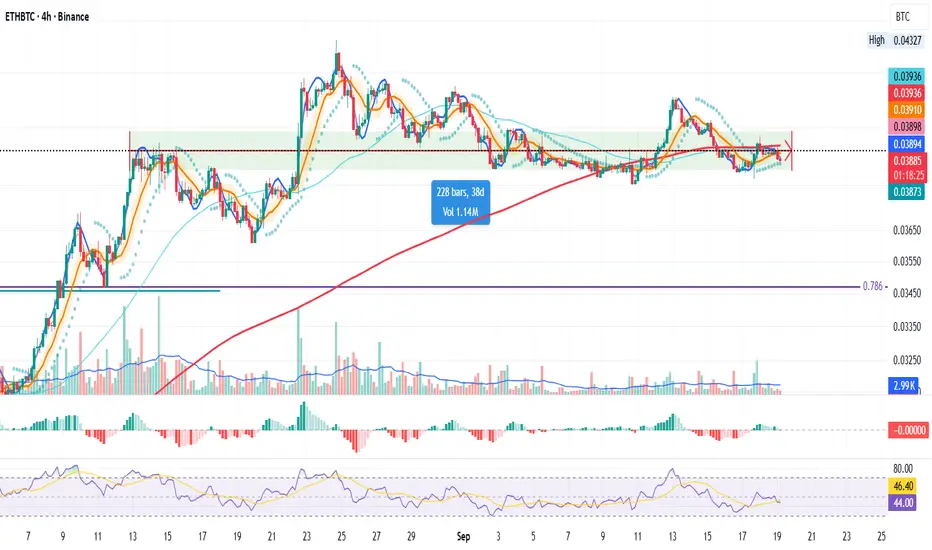
ETH SERIES | Part 2 – ETH/BTC (4H)
Same 40-day window as ETH/USDT, but here price looks worse:
Still under the 200MA
About to lose the green support zone
This confirms my no-long stance on ETH/USDT.
Short is tempting, but staying cool & pressure-free.
Next episode → ETH/SOL for more context.
Always take profits and manage risk.
Interaction is welcome.
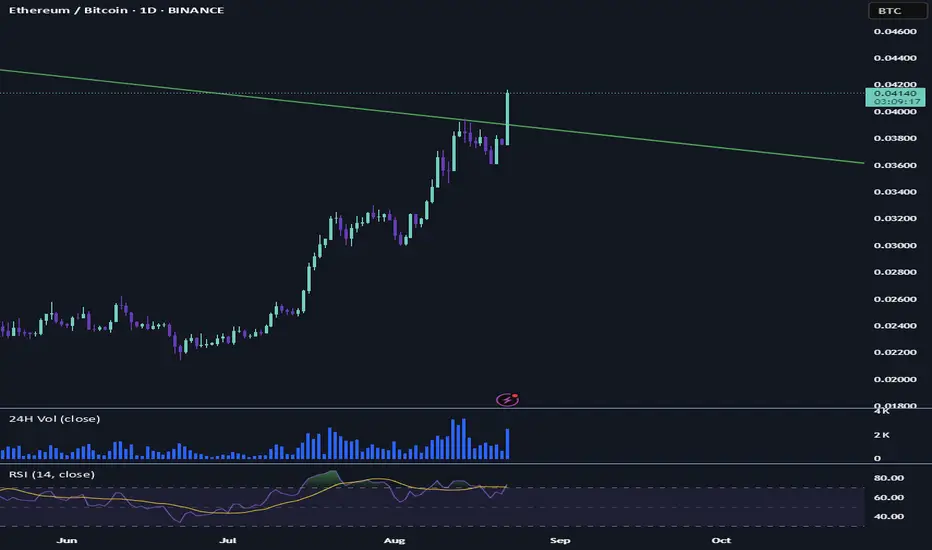
ETHBTC break of resistance from 2022! With todays push upwards BINANCE:ETHBTC finally broke the downward resistance since - get this - September 2022. This is huge IF it materializes. What do I mean?
In the daily and every other timeframe we can expect a continuation of some sort if the day closes above the resistance - which is in eth terms around 4800, but better - in ethbtc terms it means 0.0395 (it currently is at 0.041)
let's hope - even tho the september correction looms over our heads (or a potential one) a rally could go for the following week - and maybe even into the first week of september if everthing goes right.
ETH/BTC pullback seems to be over ETH/BTC pullback seems to be over 🚀
The downtrend line has been broken and a new move is starting.
Key levels ahead will confirm if this momentum is sustainable.

ETHBTC - Upward Movement Using this curved channel to show a target
This works well with the horizontal line at prior peaks
ETHBTC could move up to 0.08 - 0.10 as we head into a very strong alt season
The RSI also shows itself within a downward channel but support will be found at the middle line of the channel, allowing further movement up. Top of the channel being hit on the RSI is likely.
Very bullish on ETH.

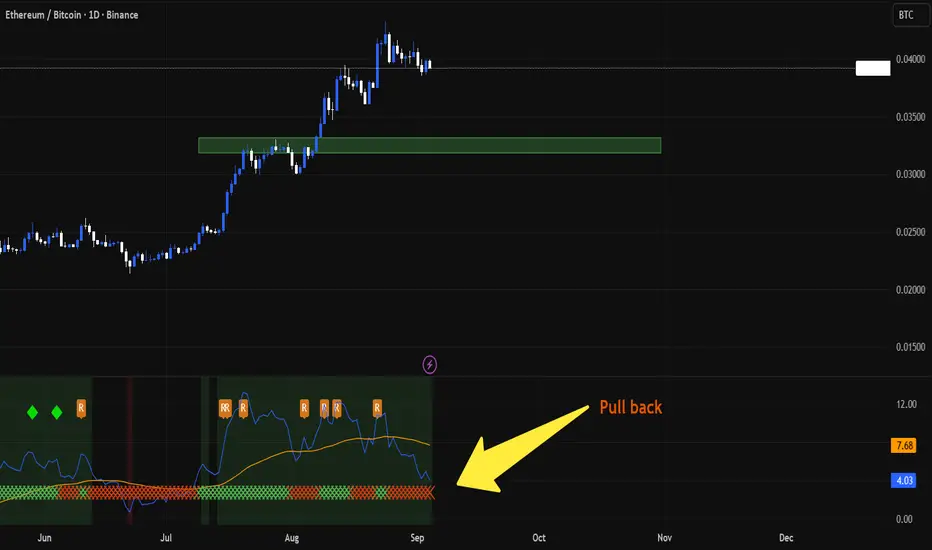
ETH/BTC Daily UpdateAccording to the New RSI indicator, Ethereum is pulling back with strong momentum against Bitcoin. 🚀📉
⚠️ This means Ethereum could see deeper downside in the coming pullback.
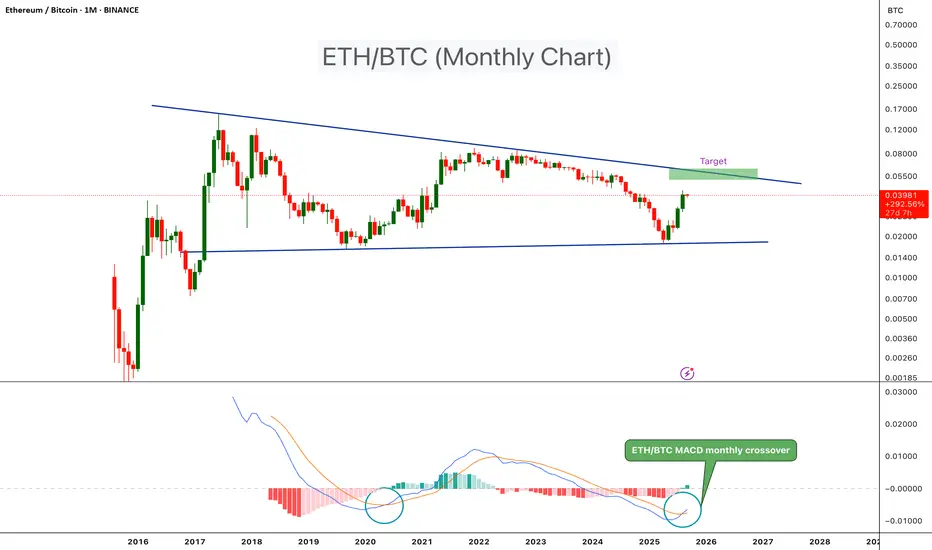
Ethereum Showing Strength Against BitcoinETH/BTC pair is trading within a long-term triangle pattern. A few months ago, price bottomed out at the triangle support and has since bounced, with the pair now trading around the 0.039 level.
On the monthly timeframe, a bullish MACD crossover has just appeared. This is a strong signal that ETH could start outperforming BTC in the near term. The last time a similar crossover occurred was in June 2020, which was followed by a powerful rally in ETH.
Looking ahead, the next major resistance for ETH/BTC is near the 0.060 level. If bullish momentum continues, price could test this zone in the coming months. This resistance area may also act as the potential peak for ETH in this bull run cycle.
ETH/BTC Pullback WatchLook at the ETH/BTC charts. Every rally in history had pullbacks. Doesn’t mean it has to happen again, but ignoring it is how you get smoked. If it dumps, let it dump. The market doesn’t care about your feelings.
