ETH to Lead BTC Over Next 6 Months, Says Galaxy CEOIn a bold forecast that has reignited the debate over crypto market leadership, Galaxy Digital CEO Mike Novogratz stated that Ethereum (ETH) is poised to outperform Bitcoin (BTC) over the next six months, citing improving fundamentals, institutional tailwinds, and critical network upgrades.
Novogratz, a long-time crypto advocate with deep ties to both traditional finance and blockchain innovation, made the statement during an interview at the Digital Asset Summit in New York, sparking renewed discussion about the shifting dynamics between the two largest digital assets by market capitalization.
Ethereum’s Evolving Investment Case
“Ethereum is becoming more than just a smart contract platform,” said Novogratz. “It’s evolving into a foundational layer for the future of finance.”
This confidence is underpinned by Ethereum’s transition to proof-of-stake, reduced energy consumption, and growing usage of Layer 2 scaling solutions like Arbitrum and Optimism. These developments, Galaxy argues, have made Ethereum more attractive to institutional investors who previously stayed away due to scalability concerns and environmental critiques.
Stronger Fundamentals, Expanding Utility
Ethereum’s network revenue—driven by transaction fees and on-chain activity—has consistently outpaced competitors. According to Galaxy’s internal research, Ethereum generated over $2.1 billion in protocol revenue in the first half of 2025, compared to just under $1.5 billion for Bitcoin.
Additionally, the rise of real-world asset (RWA) tokenization, DeFi resurgence, and the adoption of Ethereum-based stablecoins by traditional finance platforms have significantly enhanced ETH’s long-term value proposition.
“Ethereum is no longer a tech experiment. It’s infrastructure,” Novogratz stated.
Bitcoin Still Dominates, But ETH Momentum Grows
While Novogratz remains bullish on Bitcoin, he emphasizes that BTC is now more of a macro hedge than a dynamic growth asset. With institutional investors already heavily exposed to Bitcoin via spot ETFs, the marginal capital over the next cycle may shift toward Ethereum, particularly as ETH-based ETF products gain traction.
“Bitcoin remains the king of store-of-value assets in crypto. But Ethereum is where innovation and yield are happening,” Novogratz added.
Six-Month Outlook
Galaxy projects that ETH could outperform BTC by 20–30% in the second half of 2025, driven by upgrades like Proto-Danksharding, expanding Layer 2 activity, and Ethereum’s role in cross-chain interoperability.
Novogratz also hinted that Galaxy is allocating more capital into Ethereum-based venture projects and staking infrastructure, in anticipation of a “second-layer boom” later this year.
Conclusion
While Bitcoin remains the undisputed anchor of the crypto economy, Ethereum’s expanding utility, institutional relevance, and revenue-generating capabilities position it to lead performance in the near term.
Market insights

Ethereum Bitcoin pair bottom confirmed!As confirmed by CRYPTOCAP:ETH \ CRYPTOCAP:BTC momentum, we can say that a local bottom was seen at 2019 accumulation levels. With a major reversal from the current region, we can see major movements across Altcoins, with Ethereum being an undeniable leading force and leader for altcoins.

ETHBTC x ETH.DETHBTC x ETH.D
Ethereum bitcoin pair and ethereum dominance will gain upward momentum with the reaction it receives from the major support line in 2019
The better Ethereum is, the better Altcoins will be.

ETH Versus BTC - Daily Update - Bitcoin still winning
As mentioned yesterday, ETH has hit long term resistance and got rejected....and it is happening again
ETH seems unable to find the moemntum just yet.
The MACD Daily is still turning Bearish
The Daily RSI is also up high and likely to fall
The weekly RSI is also high though the Weekly MACD has still yet to rise above Neutral
All in All, for me, it is NOT the time....Though we can see that ALTS are running Hot though not a full ALT season as we have seen in the past.
It is fragile...please remain CAUTIOUS
Ethereum is breaking out !The ETH/BTC chart looks like #Ethereum has been suffering from impotence for years… 🍆
But judging by the shape, this breakout isn’t just a Bullish signal — it’s the early sign of a massive altcoin erection. 🚀
⚠️ Side effects may include: rapid growth and uncontrollable pumps.
Keep children and weak hands away from the charts !
Lets look at ETH V Bitcoin for a moment, before you jump in
Ever since Nov 2021, ETH has Lost Value compared to Bitcoin, as we can see on this ETH BTC chart.
Even while Bitcoin entered a Deep Bear market, ETH lost More....
And now, as we see ETH make a strong move, we have people screaming, "ETH to 10K"
And given how ETH is backed by almost everything American, as America wants ETH as its own Crypto.
Nut lets look here at simple idea.
ETH is up agains Stiff long Term resistance right now.
If we look at the daily chart.
We can already see how PA has been bumped down...an is trying again, even with a daily MACD turning Bearish
The weekly MACD has room to go higher and so I do expect PA to break over resistance and to nreak higher should sentiment remain strong.
As ever, this relies HEAVILY on BTC Dominance and Bitcoin PA to play along.
For me, I am not touching it, even if I can make money on it..
Principles


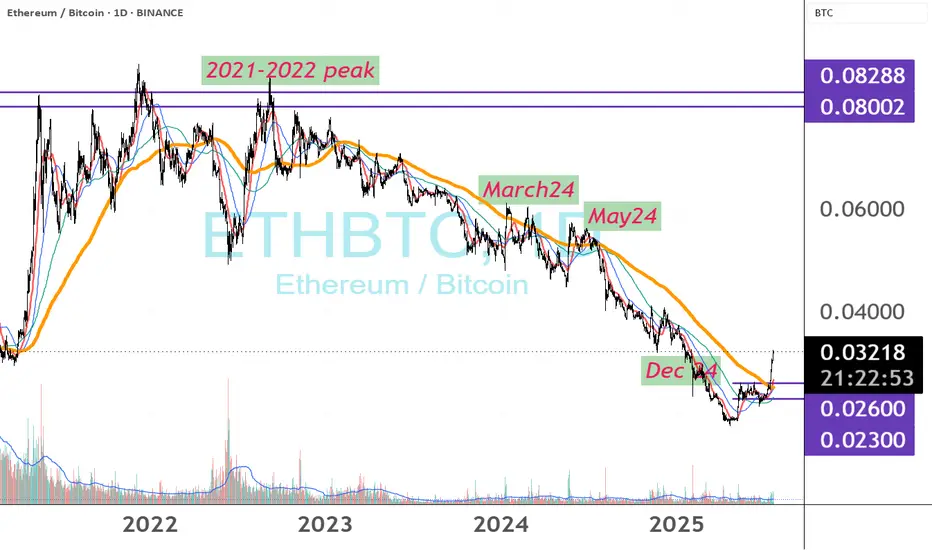
ETHBTC , what if?ETH/BTC has just pushed above 0.026 on the 200‑day MA, indicating ETH’s relative strength against BTC, despite ETH still trading under $4,000.
Unlike the $4,000 rallies in March, May and December 2024—when ETH/BTC never truly broke out—this move shows genuine outperformance.
If Bitcoin holds at about $120K, revisiting the 2021–22 ETH/BTC high would put ETH near $9.6K.
Historical peaks for reference:
2018: ETH/BTC ≈ 0.12 → ETH ≈ $14,400
2017: ETH/BTC ≈ 0.15 → ETH ≈ $18,000
Altcoin season begins.....Altcoin season begins..:
ETH/BTC has finally broken out above 0.026, signaling Ethereum’s recent outperform Bitcoin.
As long as ETHBTC stays above 0.026, we can expect growing bullish momentum across altcoins.
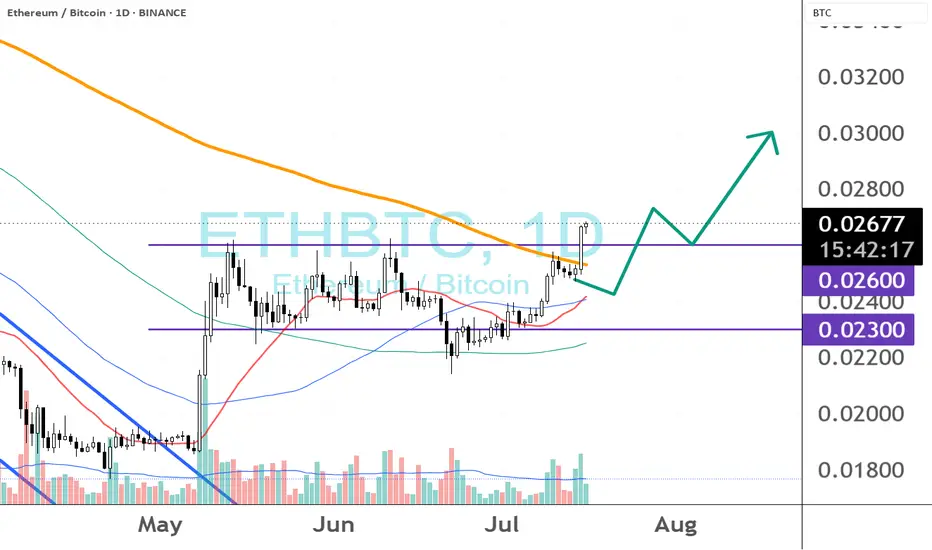
ETH against BTCETH/BTC has broken out of a bullish flag and cleared two key resistance levels. The first was at 0.02498, which held as resistance for a while. After a successful breakout and retest, price surged through the next key level at 0.02587.
We might see a retest of 0.02587—if it holds as support, the next major target to watch is around 0.03. This would mark a significant move and could set the stage for a broader rally.
The ultimate target for this bull cycle remains around 0.048, but let’s take it step by step and focus on the 0.03 level for now.
One thing to watch closely: the weekly RSI is showing signs of bearish divergence compared to price action. If this divergence plays out, we could see a correction. However, if RSI manages to break above 79.95, that bearish divergence would be invalidated—and we’d be in a stronger position to aim for higher levels.
Let’s see how things unfold. For now, 0.02587 is the key short-term level to hold.

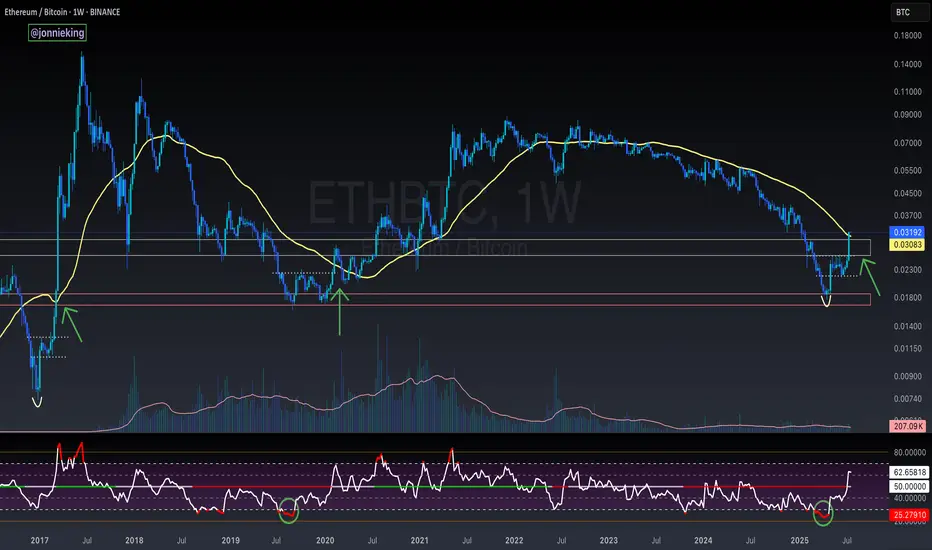
ETH MAKES HIGHER HIGH ABOVE 50 MAThis is the first time that Ethereum has closed a weekly candle above the 50 MA since 2023. Price also made a higher high in market structure for the first time since 2021, meaning that it has broken bearish market structure.
Ethereum is the focus for now.

$ETH Closes Above the 50WMA - Alt Season Signal ALT SEASON ALERT 🚨
CRYPTOCAP:ETH Closed the Week ABOVE the 50WMA
Historically this has signaled the start of ALT SEASON.
*NOTE* 2020 had the pandemic hiccup.
This bottoming pattern looks very similar to the 2017 explosion.
Also the RSI matches the 2019 bottom.
Dare I call it yet bros? 🤓
ETH/BTC 25-7-20I think there’s some clear headroom for more movement to 0.40 Ethereum per Bitcoin. Let’s see but right now is hot. Then the support after the 0.400 resistance is hit is back at 0.22, but who know what the price of Bitcoin would be at that point.
Pair this with my ETHUSD speculation.This is just to pair alongside my prior post regarding heavy speculation in the ETHUSD

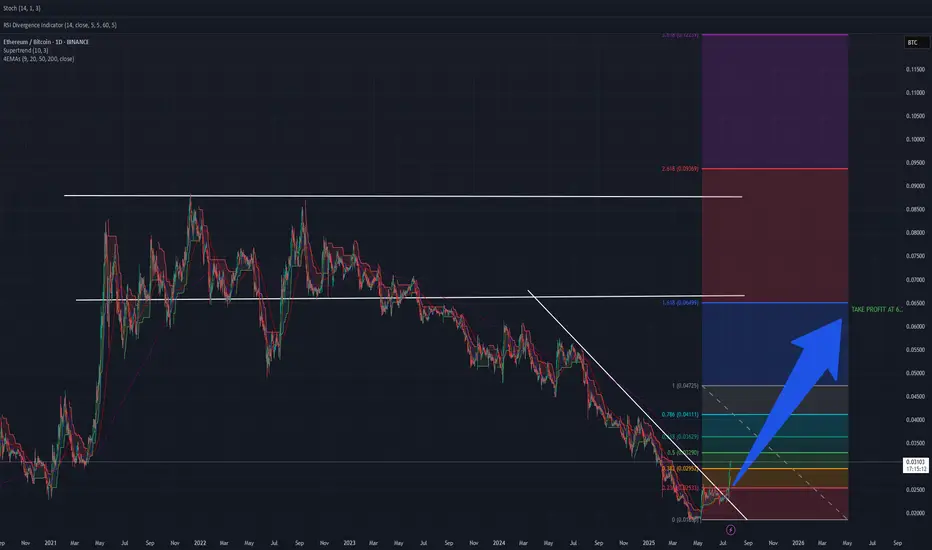
ETHBTC Breaking outETHBTC is breaking out of a multi month falling wedge. Using Fibonacci retracement looking for I have entered a trade around the breakout at 0.031 and have take profit levels using Fib levels at 0.038 , 0.044 and will close the trade around 0.063. stops below 0.028
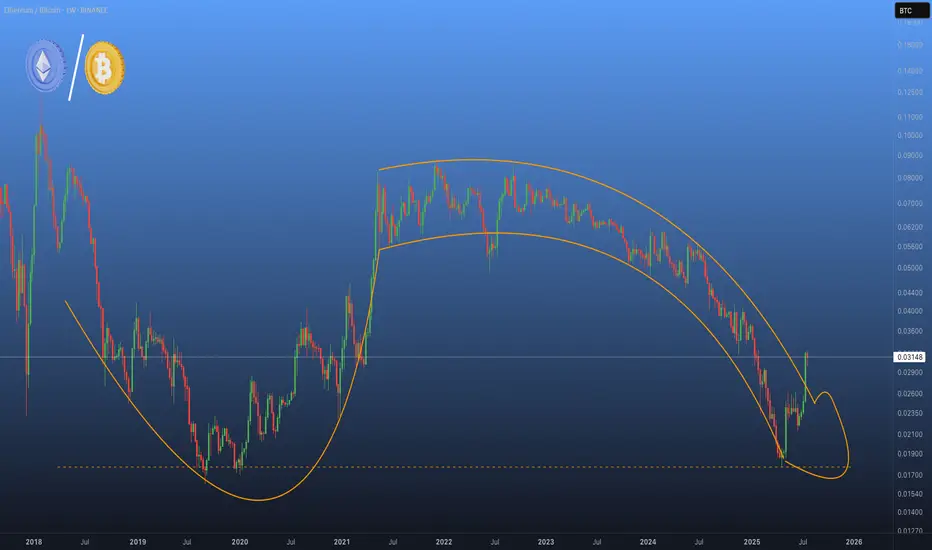
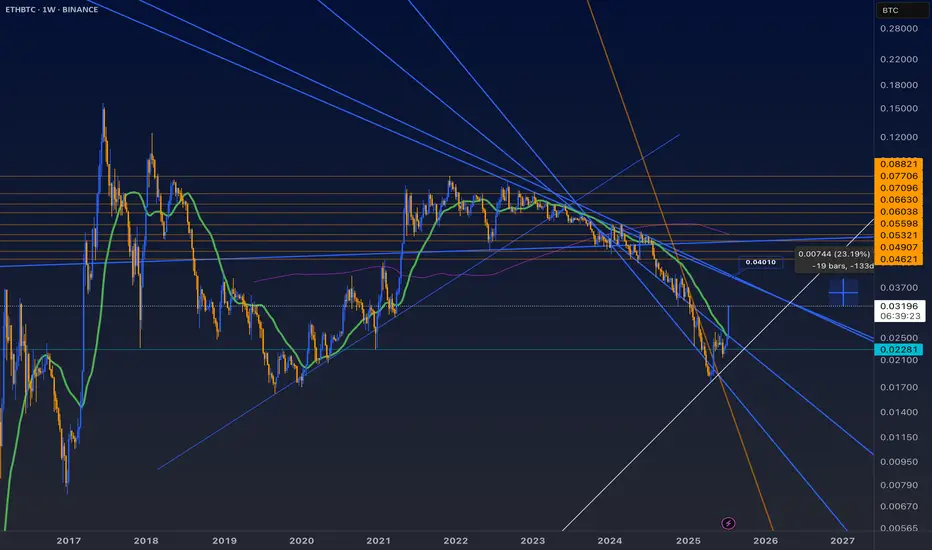
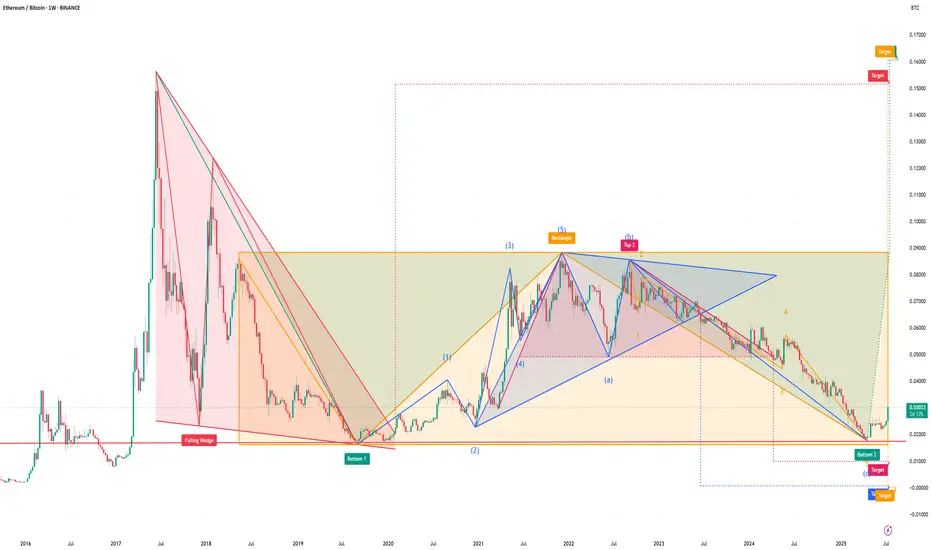
ETHBTC scenario for 2025-2027ETH/BTC is currently sitting at a historically strong support zone and is forming a bullish reversal pattern, which increases the likelihood of a new upward cycle against BTC.
The most probable scenario is a move towards the 0.05–0.07 BTC range, with potential to reach at least 0.09 BTC as a conservative scenario and 0.15–0.16 BTC as an optimistic scenario during 2025–2027.
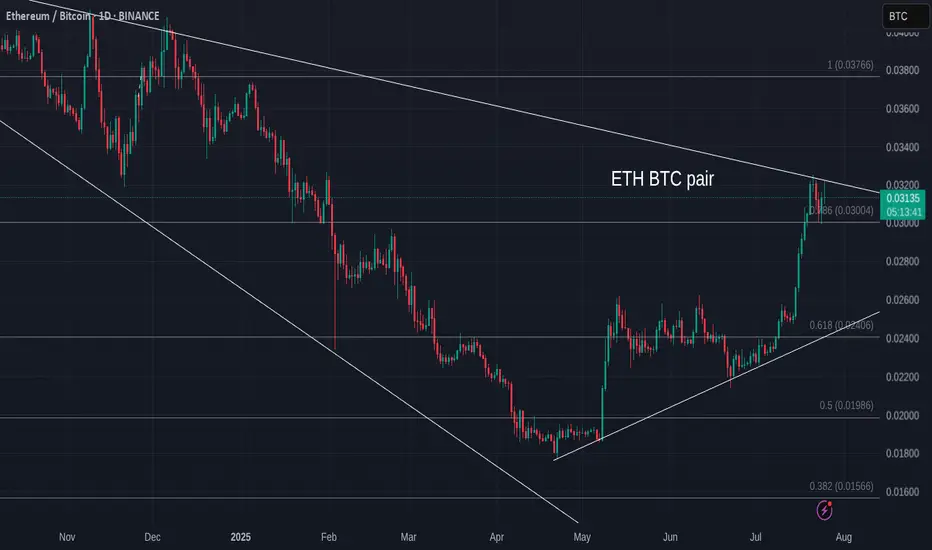
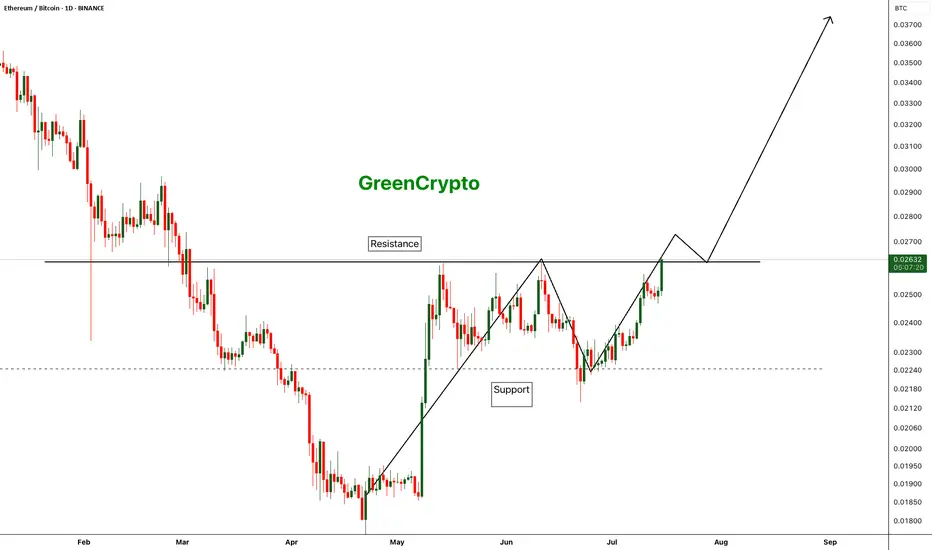
ETH/BTC - Finally Trend is reversing - After a long time we are finally seeing a change in the trend of ETH/BTC pair.
- Compared to BTC, ETH was underperforming for last couple of years and we are seeing some strength in ETH
- If this trend continue we can finally see some new ATH on ETH
Entry: 0.02633
StopLoss: 0.02125
TP1: 0.02825
TP2: 0.03168
TP3: 0.03592
Don't forget to keep stop loss. Stay tuned for more updates
Cheers
GreenCrypto
ETH/BTC Poised for a Breakout: A Technical and Fundamental ViewA confluence of technical signals on the weekly ETH/BTC chart, coupled with significant fundamental developments for both Ethereum and Bitcoin, suggests a potential upward move for the pairing in the coming weeks.
Technical Analysis (TA)
The weekly chart for ETH/BTC on Binance reveals a potential bottoming formation after a prolonged downtrend. The price has been consolidating in recent months, and the latest weekly candle shows a strong bullish engulfing pattern, indicating a possible shift in momentum.
Key levels to watch, as identified on the chart, are:
Immediate Resistance: 0.02546 BTC. A decisive close above this level on the weekly timeframe would be the first confirmation of a potential trend reversal.
Further Resistance: 0.02929 BTC and 0.03451 BTC. These represent subsequent hurdles for the bulls to overcome.
Take Profit Target: 0.038 BTC. This level is marked as the ultimate target for this potential upward move.
Timeframe: The analysis on the chart suggests a maximum timeframe of 5 weeks for this trade idea to play out.
Moving Averages: The price is currently trading below the MA Ribbon (SMA, 20, 50, 100, 200), which could act as dynamic resistance. A break above this ribbon would further strengthen the bullish case.
Fundamental Analysis (FA)
The current market environment in July 2025 provides several fundamental catalysts that could impact the ETH/BTC ratio.
For Ethereum (ETH):
Growing Institutional Interest: Ethereum ETFs have seen significant inflows, with over $890 million in July 2025 alone, driven by increasing confidence from institutional investors. Asset managers like BlackRock are accumulating substantial amounts of ETH, reducing the available supply on the market.
Network Upgrades: The upcoming "Pectra" upgrade, which includes Proto-Danksharding (EIP-4844), is anticipated in Q3 or early Q4 2025. This is expected to significantly reduce Layer-2 transaction costs and improve scalability, further enhancing the utility of the Ethereum network. The earlier Pectra upgrade in 2025 already introduced user-friendly features like smart accounts.
Ecosystem Growth: The Linea project, a prominent player in Ethereum's DeFi ecosystem, has a Token Generation Event (TGE) scheduled for July 2025, which is expected to drive market shifts. The overall DeFi ecosystem on Ethereum is showing signs of revitalization.
For Bitcoin (BTC):
Strong Institutional Demand: Similar to Ethereum, Bitcoin is experiencing a wave of institutional adoption, with significant inflows into spot Bitcoin ETFs. Public companies are now holding BTC in their treasuries, and major financial institutions view it as a strategic asset.
New All-Time Highs: Bitcoin has recently surged to new all-time highs, breaking key trendlines and signaling a new bullish era. This strong performance often has a spillover effect on the broader crypto market, including altcoins like Ethereum.
Favorable Macro Environment: Some analysts point to a looser monetary policy from global central banks and inflation concerns as factors boosting demand for hard assets like Bitcoin.
ETH vs. BTC Dynamics:
While Bitcoin's price has seen impressive gains, some analysts believe Ethereum has room to catch up. The ETH/BTC ratio is a key metric for gauging the relative strength of the two leading cryptocurrencies. An upward trend in the ETH/BTC chart, as suggested by the technical analysis, would indicate that Ethereum is outperforming Bitcoin. The performance of ETH relative to Bitcoin is often seen as a barometer for the broader altcoin market.
My point of view
The technical setup on the ETH/BTC weekly chart presents a compelling case for a potential bullish reversal in the short to medium term. This is supported by strong fundamental developments within the Ethereum ecosystem, including significant institutional inflows and major network upgrades. While Bitcoin's own bullish momentum is a factor to consider, the potential for Ethereum to outperform in the coming weeks, as indicated by the provided chart analysis, offers an interesting trading opportunity. Traders should closely monitor the identified resistance levels for confirmation of a breakout.

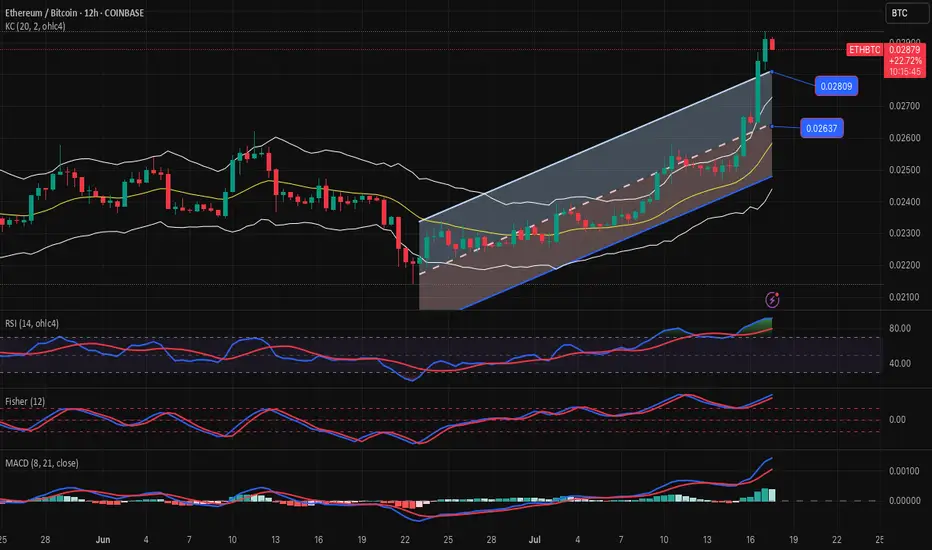
ETHBTC-SELL strategy 12 hourly chrt Reg. ChannelETH is more overvalued than BTC, hence selling this combo may make sense.
Strategy SELL @ 0.028800 area and take profit near 0.26500.
ETHBTC 3D#ETHBTC 3-day timeframe chart looks amazing!
All we need now is a breakout above the resistance zone and the 3-day SMA100.
The rise of ETH against BTC — combined with the decline in Bitcoin dominance — signals a potential rotation of capital into altcoins.
Are you ready for the altseason?
If the breakout occurs, the targets are:
🎯 0.03148 BTC
🎯 0.03524 BTC
🎯 0.04003 BTC
⚠️ Always use a tight stop-loss and apply proper risk management.

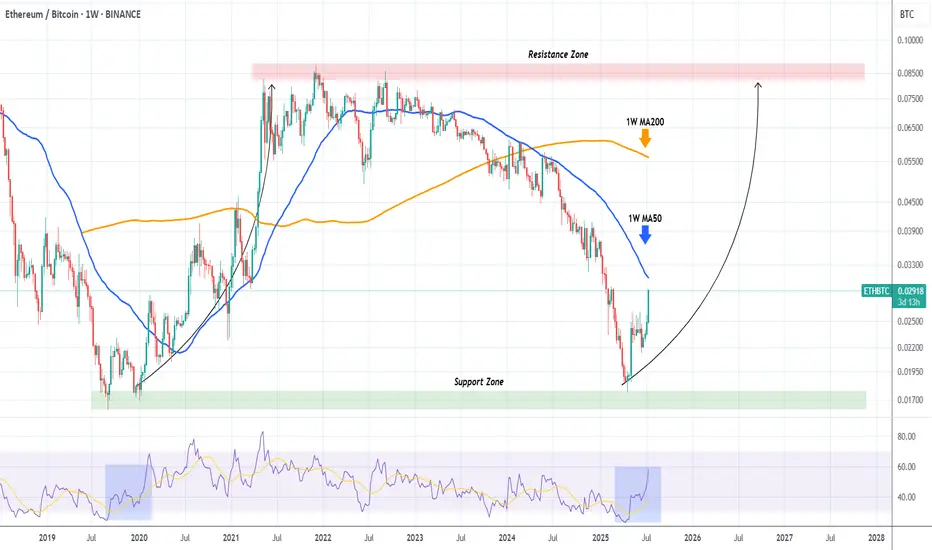
ETHBTC shows that Ethereum will outperform Bitcoin MASSIVELY!The ETHBTC pair has been rebounding hyper aggressively after the April 21 2025 Low on the 6-year Support Zone, and is now facing it's most important test, the 1W MA50 (blue trend-line).
This trend-line has been its Resistance since basically March 13 2023, so if broken, it will be a massive bullish break-out signal.
In fact during the 2020 - 2021 Bullish Leg, once the price broke above the 1W MA50, the market got the final confirmation of the upcoming long-term rally.
We expect Ethereum to outperform Bitcoin for the rest of the year at least.
-------------------------------------------------------------------------------
** Please LIKE 👍, FOLLOW ✅, SHARE 🙌 and COMMENT ✍ if you enjoy this idea! Also share your ideas and charts in the comments section below! This is best way to keep it relevant, support us, keep the content here free and allow the idea to reach as many people as possible. **
-------------------------------------------------------------------------------
💸💸💸💸💸💸
👇 👇 👇 👇 👇 👇
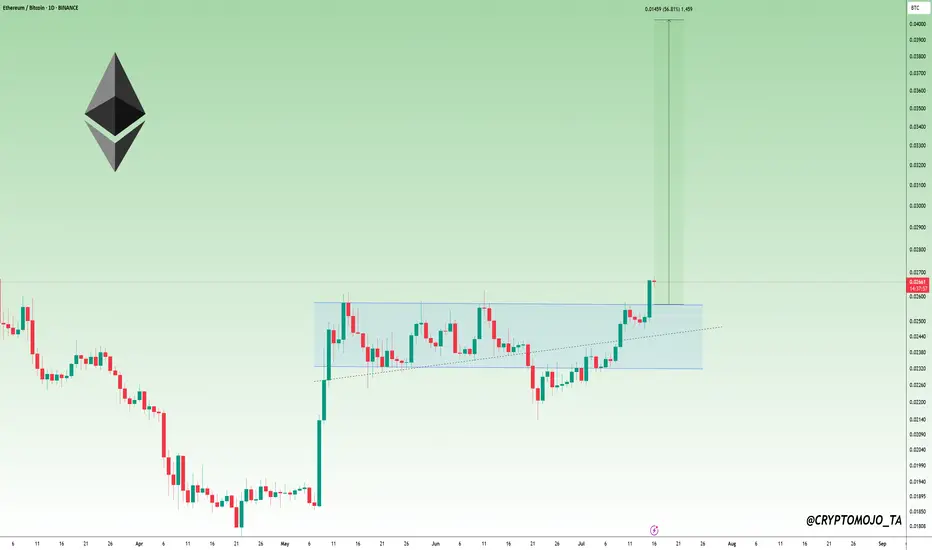
$ETH Breakout Alert!🚀 CRYPTOCAP:ETH Breakout Alert!
Ethereum has finally broken above $ 0.02583, a strong resistance level that had stopped it for months.
ETH is starting to look stronger than BTC.
Next targets:
🔹 0.02985 – near-term resistance
🔹 0.03281 – major targethad
🔹 0.0415 – full breakout target (around +56%)
If ETH retests 0.02583 and stays above, it confirms the breakout.
This could be the start of ETH outperforming BTC in the short term.
Keep an eye on it, this move could lead to a strong ETH rally!
DYOR, NFA
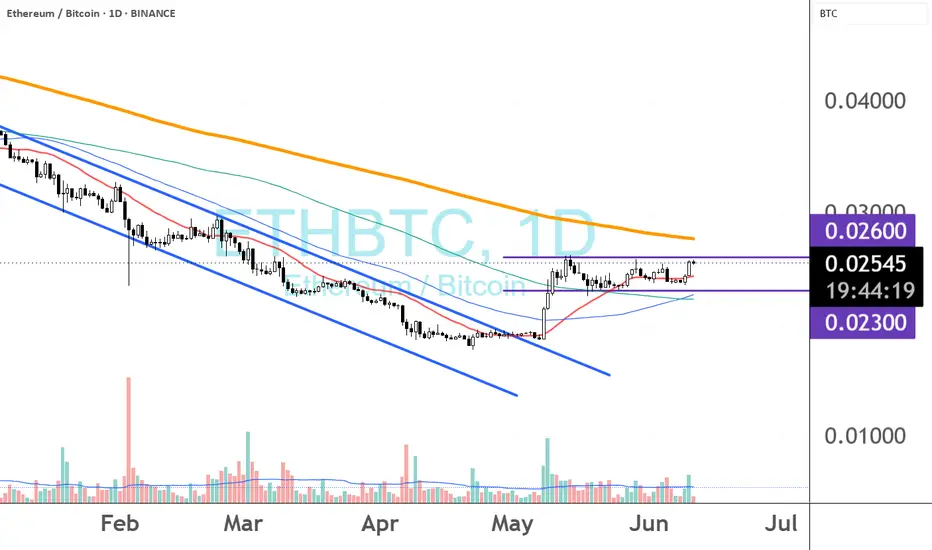
Alt season ?Ethereum has been underperforming Bitcoin since 2022.
However, in the short term, ETH is starting to show some relative strength.
If ETH/BTC can break above the 0.026 level, we could potentially see momentum shift towards altcoins.
Current Outlook:
* Short-term: Bullish
* Mid-to-long term: Neutral
* Long-term: Bearish