BTC vs Gold (BTC/XAU) – 1M Chart⚖️ BTC vs Gold (BTC/XAU) – 1M Chart
Observations:
• BTC/XAU is still below macro resistance (~36.0), which has acted as a multi-cycle ceiling since 2021.
• Every prior monthly rejection from this zone led to macro pullbacks in BTC.
• So far, this is the 4th monthly attempt to break through it —
Related pairs

Bitcoin Update August 2025 Rising Wedge Pattern -> Bearish Bias Pair: BTC/EUR – 1D – Binance
Bitcoin has been forming a rising wedge pattern over the past months, which statistically breaks downwards in most cases. The price already failed to hold the lower trendline, which confirms the bearish scenario for now.
Key takeaways from my analysis:
Pattern: Rising


BTC ToplessWill we just skip 50k in one move or it would take 3-6months xD?
Eitherway, btc is pretty sexy

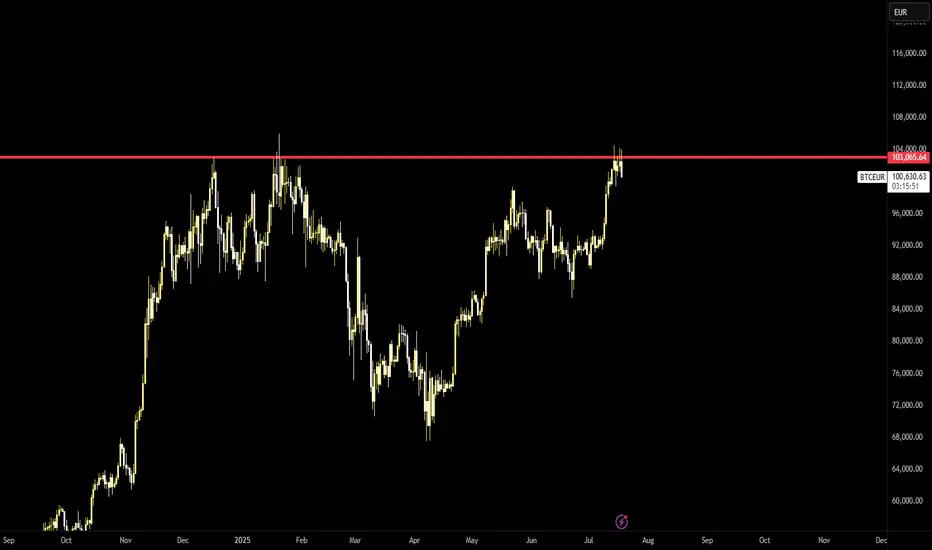
BTC/EURO did not break out - potentially a big warning sign- follow up on the latest BTC analysis
- this Bitcoin breakout, so far, is rather lackluster and leaves a lot to be desired
- upon breaking an important HTF level, Bitcoin tends to explode and leave sideliners behind but this has not been the case so far
- more importantly, BTC DID NOT break out vs
Bitcoin: rally to 100k Then drop to high-volume supportBitcoin is setting up for a two-phase move based on current technical structure:
Phase 1 - Rally to 100k (Yellow Line)
Expect initial bounce to test the psychological 100k resistance level
RSI currently at 56.15 provides room for upward movement
This represents a short-term retest of major resist

booomwe doing it, inverse head n shoulders breaking ath's it took a few years but it's finally happening
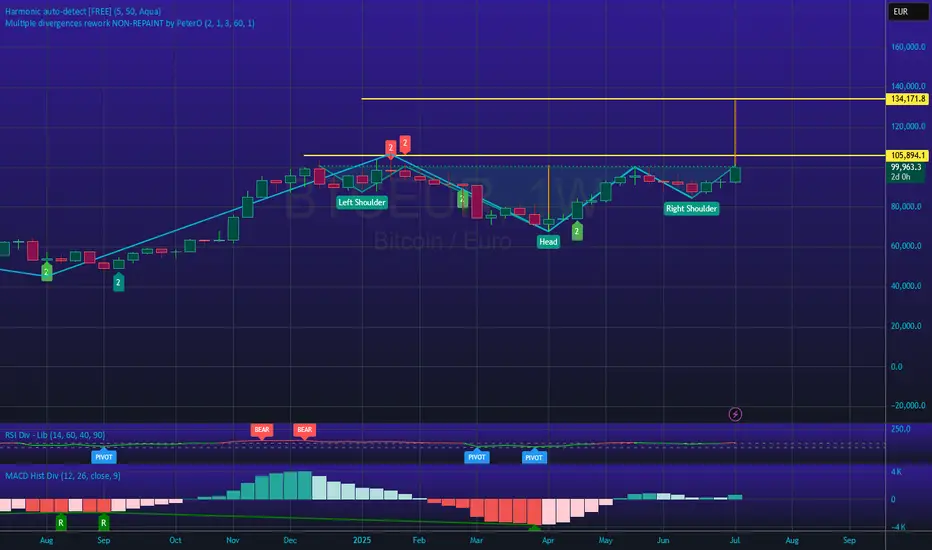
btceur ath not yet reachedbitcoin all time high is not in. If euro will stay strong ATH could be in two months at 112 000€ ~ 130 000 $, then down only bear market for a year

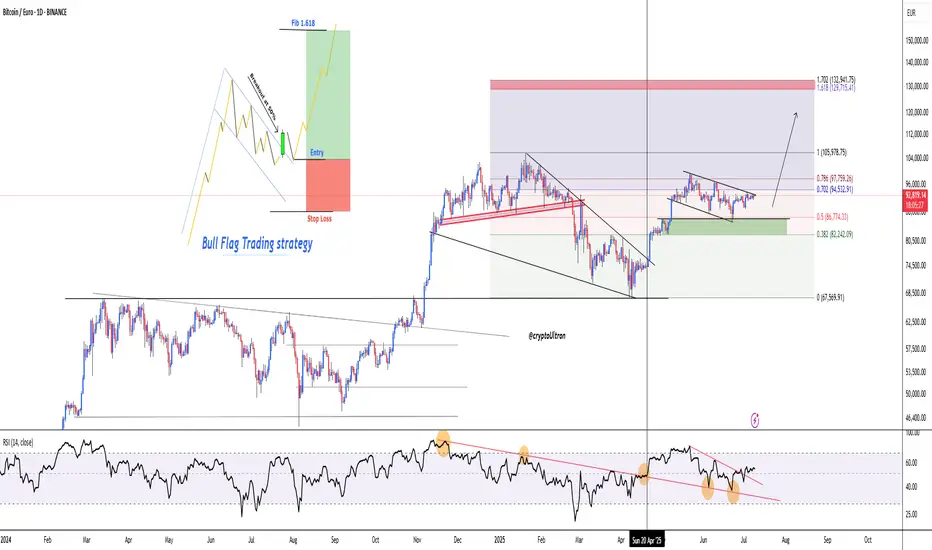
#BTCEUR #1D (Binance) Bull-flag breakout and retestBitcoin looks very good for bullish continuation after regaining 50MA support on daily, against the Euro.
⚡️⚡️ #BTC/EUR ⚡️⚡️
Exchanges: Binance
Signal Type: Regular (Long)
Amount: 12.0%
Entry Targets:
1) 93017.86
Take-Profit Targets:
1) 108422.28
Stop Targets:
1) 85296.36
Published By: @Zblaba

BTCEURO📈 #BTCEUR interesting chart
#BTC has been trading super clean — if you know where to look 👀
The entire first half of 2025 was stealth accumulation, and now we’re stepping into Q3 with a full bull flag structure intact.
This is the calm before expansion.
✅ Bull flag forming after breakout from €6
See all ideas
Summarizing what the indicators are suggesting.
Oscillators
Neutral
SellBuy
Strong sellStrong buy
Strong sellSellNeutralBuyStrong buy
Oscillators
Neutral
SellBuy
Strong sellStrong buy
Strong sellSellNeutralBuyStrong buy
Summary
Neutral
SellBuy
Strong sellStrong buy
Strong sellSellNeutralBuyStrong buy
Summary
Neutral
SellBuy
Strong sellStrong buy
Strong sellSellNeutralBuyStrong buy
Summary
Neutral
SellBuy
Strong sellStrong buy
Strong sellSellNeutralBuyStrong buy
Moving Averages
Neutral
SellBuy
Strong sellStrong buy
Strong sellSellNeutralBuyStrong buy
Moving Averages
Neutral
SellBuy
Strong sellStrong buy
Strong sellSellNeutralBuyStrong buy
Displays a symbol's price movements over previous years to identify recurring trends.