Ethereum and the Pectra Upgrade: ETH Growth PotentialEthereum is approaching a significant upgrade called Pectra, which, according to analysts at Trenovia Group, could become a major catalyst for ETH’s price appreciation—especially if network activity continues to rise.
What Does Pectra Bring?
Pectra continues Ethereum’s path toward greater technological maturity. The upgrade introduces enhancements to the Ethereum Virtual Machine (EVM), optimizes validator coordination, and strengthens smart contract security. As Trenovia Group highlights, such developments are essential to the platform's long-term competitiveness and stability.
Potential Impact on ETH Price
Based on Trenovia Group’s internal analysis, ETH could strengthen after the Pectra upgrade, assuming a rise in network engagement. Past events, such as The Merge, have historically driven price momentum. However, sustained growth depends on actual increases in user activity, transaction volumes, and new project deployments.
Network Activity as a Growth Indicator
Network usage is one of the most critical metrics tracked by Trenovia Group. A surge in active wallets, decentralized applications (dApps), and DeFi platforms often translates to higher demand for ETH. These indicators are at the core of our investment strategies and client advisory services.
Trenovia Group’s Position
As a company focused on digital asset analytics and blockchain innovation, Trenovia Group views Pectra as a strategically important upgrade. It further solidifies Ethereum’s role in decentralized finance and Web3. We will continue to deliver in-depth market insights and recommendations as the network evolves.
Conclusion
Ethereum is entering a new phase of development. Should the Pectra upgrade lead to a measurable increase in network activity, Trenovia Group anticipates a favorable environment for ETH growth, reaffirming its position as a leader in the crypto market.
BTCUSD.P trade ideas

Bitcoin Forecast: May 2025 OutlookMay 2025 has marked a strong upward trend for Bitcoin, with the leading cryptocurrency steadily trading in the $100,000–$105,000 range and hitting multi-month highs. This growth has been largely fueled by active accumulation from institutional investors, including exchange-traded funds (ETFs), reinforcing Bitcoin’s growing integration into the traditional financial system.
Institutional Demand as a Key Driver
A major factor behind Bitcoin’s recent surge is the increasing flow of capital from institutional investors. Large ETFs, such as those managed by BlackRock and Fidelity, have expanded their positions in BTC, sending a strong signal of confidence from established financial institutions. This has further boosted interest from retail investors and strengthened the overall bullish momentum.
Macroeconomic Context
Another significant influence is the market's anticipation of a potential interest rate cut by the U.S. Federal Reserve. A more dovish monetary policy stance would make riskier assets, including cryptocurrencies, more attractive, encouraging further investment in Bitcoin.
While the Fed is expected to make a rate decision in June, markets tend to price in such moves early, which is already being reflected in Bitcoin’s price trajectory.
Forecast: How Much Could Bitcoin Be Worth by End of May?
Given the current momentum and positive market sentiment, analysts suggest that Bitcoin could continue its ascent. Optimistic forecasts predict that BTC might reach $120,000–$130,000 by the end of the month, provided macroeconomic conditions remain favorable. Still, the inherent volatility of the crypto market means potential pullbacks should not be ruled out.
Conclusion
May 2025 could prove to be a pivotal month for Bitcoin. Increased institutional participation, supportive macroeconomic signals, and favorable technical indicators are all contributing to its ongoing rally. If the current trend continues, Bitcoin could set new all-time highs in the coming weeks.

Potential bullish bounce off a pullback supportBitcoin could fall towards a pullback support and potentially bounce off this level to climb higher.
Buy entry is at 99,502.40 which is a pullback support that aligns close to the 23.6% Fibonacci retracement.
Stop loss is at 92,800.00 which is a level that lies underneath a multi-swing-low support and the 38.2% Fibonacci retracement.
Take profit is at 106,765.40 which is a multi-swing-high resistance.

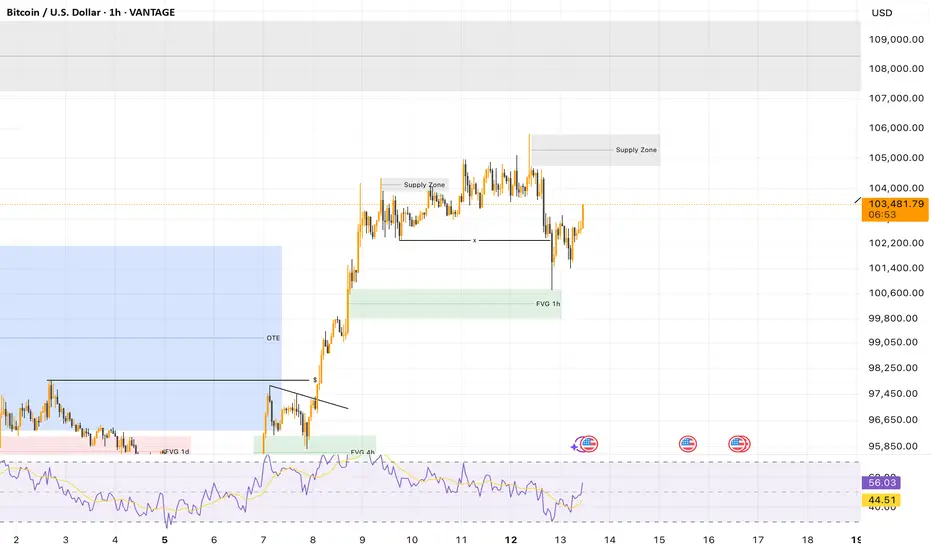
Bitcoin (BTC/USD) – 1H Analysis🏛 Market Structure
BTC continues to show strong bullish intent, holding near its recent highs after a brief dip.
🔎 Yesterday’s liquidity sweep below local support levels appears to have been a classic trap, designed to clean out weak hands before resuming the uptrend.
📈 Current Setup
🟩 1H FVG (Fair Value Gap) has acted as a strong support, with price bouncing cleanly off it.
🟫 Multiple supply zones above still need to be cleared, but BTC looks ready to challenge them again.
🔄 The reclaim of the previous range low and subsequent higher low suggest momentum is shifting back toward the bulls.
🎯 Short-Term Outlook
📈 Bullish Bias:
If the current structure holds, BTC could push back toward the $105K–$106K area.
The RSI is also curling back up from the lower bound, showing renewed momentum.
⚠️ Key to Watch:
Price must stay above the FVG (~$101K–$102K) to keep the bullish scenario valid.
A break back below this zone would expose BTC to another liquidity grab toward $99K.
✅ Conclusion
BTC is showing healthy consolidation with signs of accumulation just below resistance. The recovery after yesterday's sweep confirms that the market is still looking to push higher — especially if buyers can maintain control above $103K.
btc . tue . may . w3looking bullish. missed the SHORT on monday, was merely looking for a nice LONG entry to trade the 1 leg extension and new ATH's.
LONG
entry . 101967
tp1 . 104576
tp2 . 108462
( tp3 . 110800 - let the trade run )

BTC longterm overviewIt seems that we have around 4 months to the end of this bull-run and Bitcoin top.
-------------------------------------
Share and follow me for further analyses.

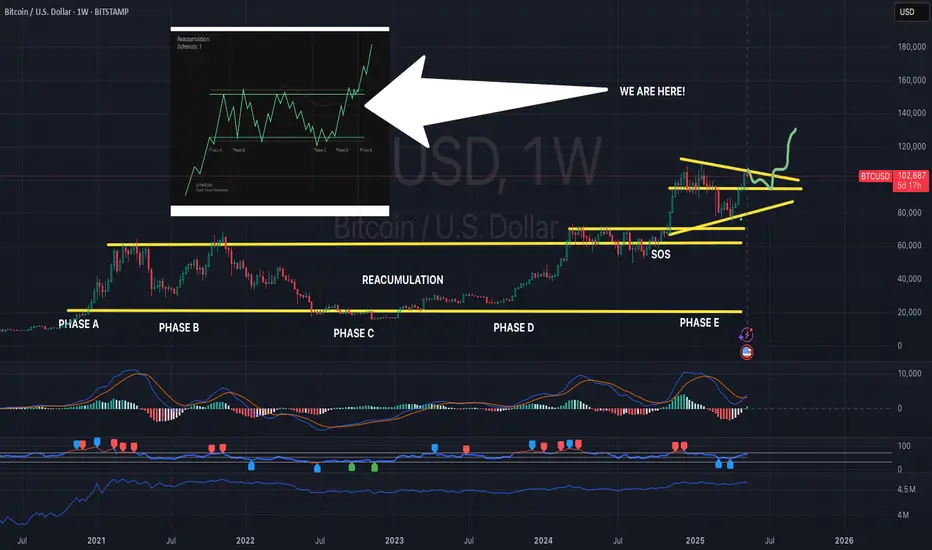
Nothing changed, it was always up!🚀 Bitcoin – Up Only Vibes Incoming!
Looks like BTC is just chillin’ up here, reaccumulating on the high timeframes over the past 3 years. Every dip gets bought, and we’re still holding strong above the old ATH. This is how big moves usually load up.
What I’m seeing:
Still making higher lows 🟢
No major sell-off = bulls in control 💪
Weekly MACD and RSI starting to turn up 🔥
Feels like the calm before the next breakout
Might not be fast, but it’s looking Up Only from here 📈
June/ July / August.. Buckle up!
#BTC #Bitcoin #Crypto #UpOnly #HODL #Reaccumulation
Bitcoin H4 | Potential bullish bounce off a pullback supportBitcoin (BTC/USD) could fall towards a pullback support and potentially bounce off this level to climb higher.
Buy entry is at 99,502.40 which is a pullback support that aligns close to the 23.6% Fibonacci retracement.
Stop loss is at 92,800.00 which is a level that lies underneath a multi-swing-low support and the 38.2% Fibonacci retracement.
Take profit is at 106,765.40 which is a multi-swing-high resistance.
High Risk Investment Warning
Trading Forex/CFDs on margin carries a high level of risk and may not be suitable for all investors. Leverage can work against you.
Stratos Markets Limited (tradu.com):
CFDs are complex instruments and come with a high risk of losing money rapidly due to leverage. 63% of retail investor accounts lose money when trading CFDs with this provider. You should consider whether you understand how CFDs work and whether you can afford to take the high risk of losing your money.
Stratos Europe Ltd (tradu.com):
CFDs are complex instruments and come with a high risk of losing money rapidly due to leverage. 63% of retail investor accounts lose money when trading CFDs with this provider. You should consider whether you understand how CFDs work and whether you can afford to take the high risk of losing your money.
Stratos Global LLC (tradu.com):
Losses can exceed deposits.
Please be advised that the information presented on TradingView is provided to Tradu (‘Company’, ‘we’) by a third-party provider (‘TFA Global Pte Ltd’). Please be reminded that you are solely responsible for the trading decisions on your account. There is a very high degree of risk involved in trading. Any information and/or content is intended entirely for research, educational and informational purposes only and does not constitute investment or consultation advice or investment strategy. The information is not tailored to the investment needs of any specific person and therefore does not involve a consideration of any of the investment objectives, financial situation or needs of any viewer that may receive it. Kindly also note that past performance is not a reliable indicator of future results. Actual results may differ materially from those anticipated in forward-looking or past performance statements. We assume no liability as to the accuracy or completeness of any of the information and/or content provided herein and the Company cannot be held responsible for any omission, mistake nor for any loss or damage including without limitation to any loss of profit which may arise from reliance on any information supplied by TFA Global Pte Ltd.
The speaker(s) is neither an employee, agent nor representative of Tradu and is therefore acting independently. The opinions given are their own, constitute general market commentary, and do not constitute the opinion or advice of Tradu or any form of personal or investment advice. Tradu neither endorses nor guarantees offerings of third-party speakers, nor is Tradu responsible for the content, veracity or opinions of third-party speakers, presenters or participants.

Dominance Drop!As we can see, 105 on BTC was a hard psychological level that still remains. The Huge run in the market only showed the manipulation of minds. I do feel we will pull back to mid 90s for a bit before the run!

Start of decline and entry into wave cWave B has ended and the main corrective path and wave formation has begun, and wave C has begun. I will tell you the end of the correction in the next post.

Will we see BTC 107k and XRP 2.9 soon?BTCUSD, XRPUSD Posted this in minds May 9th . Now that we recently touched 105,787 which I think is close enough to 106k and XRP hitting 2.6542 thirty minutes ago, I thought I'd changed the title to reflect the higher targets.
See my other ideas on POPCAT & XRP:
POPCATUSDT will it break through .60 - .62 resistance this time?
XRPUSD Giant Falling Wedge breakout?

Bitcoin Breaks $102K: Bullish Trend or Reversal Incoming?BTCUSD Weekly Technical Review & Strategy Update - Mongoose Capital Trading Desk
Overview:
Bitcoin has continued its strong upward movement, now approaching key resistance zones. The next steps depend on how the asset reacts to these levels.
Key Levels:
Resistance: The $105K–$110K zone remains critical, aligning with the 0.236 Fibonacci retracement and recent highs. A breakout above this level would indicate further bullish momentum.
Support: $90,019 (0.5 Fibonacci retracement) serves as an important support level. A pullback to this area could provide a solid buying opportunity.
Key Buy Zone: $82,728 (0.618 Fibonacci retracement) has acted as a strong support in the past. A retest of this level could offer an optimal entry point for long positions.
Technical Indicators:
RSI (Weekly): The RSI is below 70, indicating room for upside before reaching overbought conditions. The bullish momentum is intact.
MACD: The MACD histogram continues to show widening bullish momentum, supporting the ongoing uptrend.
Volume: Institutional buying pressure remains strong, reinforcing the bullish trend.
Strategic Considerations:
Buy Zone: The $90K– GETTEX:92K range (0.5 Fibonacci retracement) is a potential entry point if a pullback occurs. Watch for confirmation of support at this level.
Breakout Play: A breakout above $105K would likely lead to a move towards $110K–$115K. Position for continued upside.
Rejection at Resistance: If $105K acts as resistance, a pullback is likely. Monitor for signs of rejection at this level for possible short opportunities.
Long-Term Outlook: The trend remains bullish with higher highs and higher lows, suggesting continued upside potential.
Quantitative Overview:
FlowWave Indicator supports the bullish momentum, showing increasing buy-side conviction.
Conviction Score remains strong, reflecting solid buying pressure and bullish sentiment.
Action Plan:
Primary Buy: Look for entries around $90K– GETTEX:92K with a stop below $85K.
Breakout Play: If Bitcoin breaks $105K, target $110K–$115K.
Short Consideration: If price fails to clear $105K, prepare for short opportunities in case of a pullback.
Conclusion:
BTCUSD remains bullish, but resistance at $105K will dictate the next phase. Focus on breakout plays above resistance or buying the dip at key support levels for optimal positioning.

Too soon to make a bet
I wasn't paying much attention to the EW but for now...
Will the fibs be D - E? or 1 - 2
...ok I'm going with D - E

Trade Idea: BTCUSD Long ( BUY LIMIT )1. Trade Direction: Long
• Trend Alignment:
• Daily: Strong uptrend resumption with higher highs, higher lows, and price reclaiming above key moving average. RSI > 70 indicates strong momentum.
• 15-Min: Bullish breakout from consolidation, steep EMA slope, MACD rising, momentum increasing.
• 3-Min: Intraday momentum continuation pattern. Clean bullish price structure.
• MACD (All Timeframes): Strong bullish crossover, rising histogram — confirming trend strength.
• RSI (All Timeframes): RSI not yet overextended on lower timeframes, suggesting room for more upside.
• Price Action: Recent breakout with healthy retracement structure and no major bearish divergence.
• Fundamentals (Contextual):
• BTC crossing $100K is a psychological milestone likely to invite more inflows.
• Macro environment remains supportive for digital assets (inflation hedge, fiat debasement narrative).
• Strong market sentiment and volume suggest continuation potential.
⸻
2. Trade Setup
Entry:
• Entry Zone: $102,800
• Price is consolidating above previous resistance (~$102,000), now acting as support.
Stop Loss:
• SL: $101,200
• Below most recent intraday swing low and EMA on lower timeframes, giving it enough room.
Take Profit:
• TP: $106,800
• Near the next psychological level and extension target from recent measured moves.
FUSIONMARKETS:BTCUSD


BTC & other crypto could possible bleed a little furtherI don't want this to happen but I feel like it's going to.
Would be typical price action and then it's gonna go up so much.
So don't sell your spot holdings, don't leverage long anything.
If it reaches the lower support level you can make so much money haha

BTC Levels to look out for. BTC continues it bullish momentum supported by the total crypto market cap in bullish territory around $3.31T, well above the 1D 200MA.
Starting the week with a continued steady uptrend from last week's push to current levels, reclaiming $102k.
Continued momentum could easily lead to a break and close above ATHs.
If, for whatever reason, there is weakness, there are several levels/ areas of support which must be lost.
Considering that price has reclaimed the psychological level of $100k, it's possible that we won't see lower prices for the rest of the year or bull market.

May 9 Bitcoin Bybit chart analysisHello
It's a Bitcoinguide.
If you have a "follower"
You can receive comment notifications on real-time travel routes and major sections.
If my analysis is helpful,
Please would like one booster button at the bottom.
This is the Nasdaq 30-minute chart.
There is no separate indicator announcement today.
With the green support line maintenance condition, I created a strategy for a sideways market with a red finger long position strategy.
The main sections are indicated by price, so
Please refer to it.
This is a Bitcoin 30-minute chart.
At the bottom left, with a purple finger,
I just connected the 99,222.6 dollar long position strategy from the 8th analysis article.
*When the red finger moves,
One-way long position strategy
1. 102,536 dollar long position entry section / cut-off price when the green support line breaks
2. Top section 105,417.6 dollar long position 1st target -> Target price in order from Good to Miracle.
From Miracle, the report is updated,
and the possibility of the report being updated has greatly increased due to yesterday's movement.
The 1st purple finger section at the top
If it doesn't break through, it's a sideways market, but if it breaks through, it can be directly connected to an upward trend,
so it seems safer to operate it as a long position waiting rather than taking a short. (Horizontal range until convergence section 1, 2)
From the green support line deviation of section 2 at the bottom
Because of the full candle on the left, it can be pushed hard,
So you must follow the stop loss price.
This week, it is open from Bottom-> 3rd -> 97086.1,
So please use it well in real time.
Up to this point, I ask that you simply refer to and use my analysis
And I hope that you operate safely with principle trading and stop loss price.
Thank you for your hard work this week.
Thank you.

Bitcoin Nearing Long Term ResistanceAs Bitcoin is closing in on its all-time highs, some commentators have started upping their Bitcoin price targets for the year.
However, Bitcoin's also approaching a long term trendline that has acted as resistance in the past (currently around $113k).
Do you expect Bitcoin to breakdown or blast through this trendline?

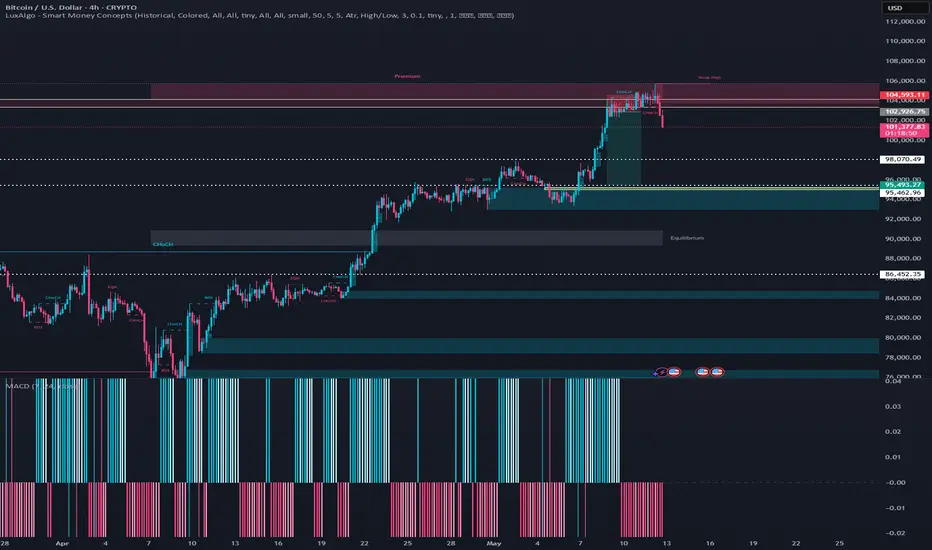
BTC at Critical Inflection Zone: Breakout or Pullback🔍 Technical Analysis Overview
1. Current Price Action
Current Price: ~$104,129
BTC is trading within a key resistance-turned-support zone (around 104,000–104,900).
Price has been consolidating near the upper boundary, indicating indecision or preparation for a breakout.
2. Support/Resistance Zones
Resistance (now support): 104,000–104,900
Target 1 (downside): ~96,969 (near previous resistance + EMA 50 level)
Target 2 (upside): ~109,525 (projected move if breakout occurs)
3. EMA Levels
EMA 50: 100,446 – Could act as dynamic support in a pullback.
EMA 200: 93,676 – Stronger trend support, much lower.
4. Price Structure & Pattern
A potential ascending triangle or range formation at resistance is visible.
The red arrow suggests a possible short trigger on rejection from the top of the zone.
If price breaks down from the support (around 104,000), a bearish move toward 100,000–97,000 may occur.
📈 Scenario Outlooks
🔵 Bullish Scenario
A confirmed breakout above 104,900 (Break Sell Zone) may lead to:
Continuation toward 109,525
Needs volume confirmation and candle close above resistance
🔴 Bearish Scenario
Rejection at current resistance and break below 104,000 support could trigger:
Drop to Target 1 (96,969), supported by the 50 EMA
Possible bounce around 100,284 minor support first
✅ Summary
Key Decision Zone: 104,000–104,900
Watch for breakout or breakdown confirmation
EMA 50 & previous resistance at 100,000 area could act as interim support
Trend remains bullish unless the price decisively breaks below the 50 EMA


BTC - NEW ATH COMING W MORE DETAILS Adding more detail to the current forecast. I originally had this a short opportunity at or near $104,500 or so. But I have modified that to safer played as a sell - $105,000 - $106,400 and then stand to the side, and buy back lower , near $96,400 - $95,900 for what then becomes an ATH. This could be risky for home gamers, so handle your own dreams accordingly. In the end, this resolves higher, not lower and below $83,000 as I had originally thought. Murrey Math, Elliot Wave, and Gonzalez wave systems being employed. Comments and Dms always welcome. Good luck!
