THE PSYCHOLOGY OF TRADING: WHY MOST TRADERS LOSE?You have probably heard that most people who attempt trading end up losing money. There’s a
good reason for this, and the reason is primarily that most people think about trading in the
wrong light.
Most people come into the markets with unrealistic expectations, such as thinking they are
going to quit their jobs after a month of trading or thinking they are going to turn $1,000 into
$100,000 in a few months. These unrealistic expectations work to foster an account-destroying
trading mindset because traders feel too much pressure or “need” to make money.
When you begin trading with this pressure, you inevitably end up trading emotionally—which is
the fastest way to lose your money.
To be specific, let’s break down the 4 Main Emotional Factors that destroy portfolios: FOMO,
Fear, Revenge, and Greed.
__________________________________________________________________________________
1. FOMO (Fear of Missing Out)
FOMO is an emotional state experienced by almost everyone. For traders, it is accelerated by
feelings of jealousy, envy, and impatience. The depth of these emotions is intensified by the
fast-acting environment of the Crypto and Forex markets.
How to Avoid FOMO:
● Develop a Routine: Trading is often a singular, lonesome pursuit. Eliminate distractions
and focus on identifying key market spots to tune out external chatter. Avoid social
media outlets and ungrateful attitudes.
● Be Present Minded, Future Thinking: Just because a trade is lost does not mean the
following transactions will follow suit. There are always more trading opportunities. Stay
present-minded yet have your scope set upon the future goals of your trading.
● Employ a Trading Plan: No plan is perfect, but a well-developed plan covers most
eventualities, helping you invest with lower risk exposure and more consistency.
Establish short-term, medium, and long-term trading goals.
● Take Joy from Trading: FOMO stems from insecurity and greed. Once a trader grasps
this truth, they can cast out this reckless state and trade with maximum potential.
__________________________________________________________________________________
2. GREED (The Account Destroyer)
There’s an old saying regarding markets: “Bulls make money, bears make money, and pigs
get slaughtered.”
This means if you are a "greedy pig" in the markets, you are almost certainly going to lose.
Greed acts as a trader’s kryptonite. When the desire for wealth clouds logic, traders make fatal
mistakes such as:
● Not taking profits because they think a trade will go on forever.
● Adding to a position simply because the market moved slightly in their favor (without
logical price action reasons).
● Using excessive leverage to maximize potential gains.
● Doubling down on losing trades (The Martingale Strategy).
Advice for Avoiding Greed:
Think of greed as the counterpart to discipline. Traders who are well-poised and consistent are
less likely to fall victim to greed. It is critical that every trader consistently follow trading plans;
otherwise, the likelihood of slipping into destructive habits is far greater.
__________________________________________________________________________________
3. FEAR
Fear often arises after a trader hits a series of losing trades or suffers a loss larger than what
they are emotionally capable of absorbing.
When fear takes over, you hesitate. You might see a perfect setup that aligns with your strategy, but you freeze because you are afraid of losing again. Or, you might cut a winning trade too early because you are terrified the market will turn against you. Fear paralyzes your ability to execute your edge.
__________________________________________________________________________________
4. REVENGE TRADING
Revenge trading is a natural emotional response when a trader suffers a significant loss. The
idea is to recover the money immediately. The thinking is: "If I put on another trade right now, I can win it back."
Usually, this "expected" winning trade turns into a losing trade—often bigger than the first one.
5 Effective Ways to Fight Revenge Trading:
1. Step Back Temporarily: Take a day or two off. If you must be in the markets, trade
incredibly small, but the best course is to walk away.
2. Make a Self-Assessment: Once you are emotion-free, analyze what led to the loss.
Was it a bad strategy, or bad execution?
3. Assess Market Conditions: Is the market too volatile? Are there no solid trends?
Sometimes the best trade is no trade.
4. Assess Your Strategy: Check your entry and exit criteria. Did you actually see a setup,
or did you force a trade out of anger?
5. Make Necessary Adjustments: Note the feedback, learn the lesson, and mentally
"throw" the bad trade away. Affirm to yourself: "That is how I will do it next time."
__________________________________________________________________________________
SUMMARY
Trading is simple, but it is not easy. The charts are the easy part; managing your own mind is
where the real work begins. Identify these four emotions— FOMO, Fear, Greed, and
Revenge —and suppress them the moment they arise.
Are you controlling your emotions, or are they controlling your portfolio? Let me know in
the comments below.
__________________________________________________________________________________
Disclaimer: This content is for educational purposes only. Trading involves significant risk.
Market insights

Possible Bullish Cypher PatternI'm mapping out the possible long term Bullish bounce of BTC using Bullish Cypher Pattern. The invalidation of this bullish setup is the All-Time High. Manage your risk well :)

BTC Remains BullishBTC Analysis Update
The previous buy analysis for BTC remains valid, with $100,000 still as the upside target.
On the H1 timeframe, bullish momentum is currently present, indicating active buying pressure.
If this momentum sustains, it is likely to transition and confirm on the H4 timeframe, strengthening the continuation bias toward higher levels.
Bias remains bullish as long as structure and momentum are maintained.

How to Identify a Ranging Market Before It Traps You.Price is moving. But not every move is an opportunity.
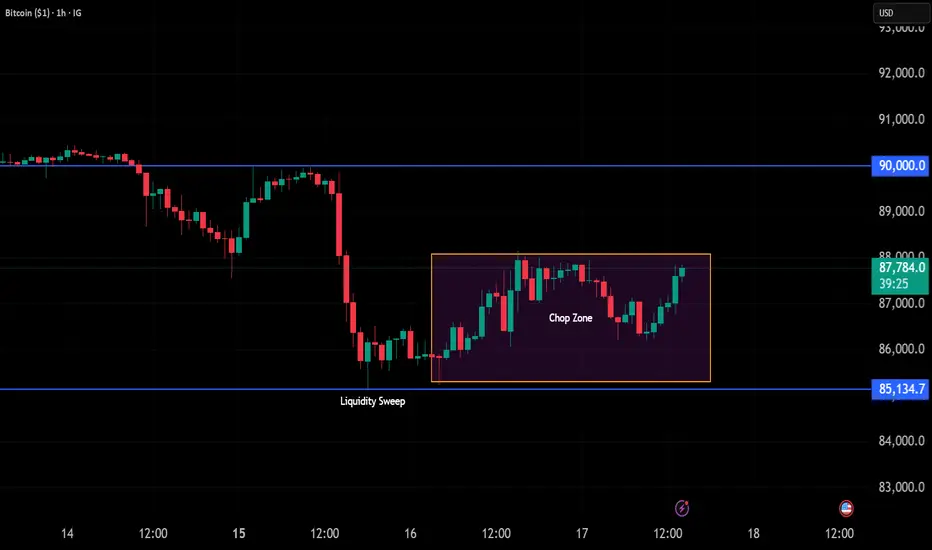
This 1H Bitcoin chart is a textbook example of why traders get chopped up — even when structure and levels look "clear."
━━━━━━━━━━━━━━━━━━━━━━━━━━━━━━━━━━━━━━━━━━━━━━━━━━━━
WHAT THIS CHART SHOWS
━━━━━━━━━━━━━━━━━━━━━━━━━━━━━━━━━━━━━━━━━━━━━━━━━━━━
Look at the price action from Dec 14–18:
- Dec 14–15: Sideways grind near 90K resistance
- Dec 15: Sharp drop from 90K → 85K (liquidity sweep)
- Dec 16–18: Price trapped in the Chop Zone (85K–88K)
Every push fades. Every breakout attempt stalls. Classic ranging behavior.
━━━━━━━━━━━━━━━━━━━━━━━━━━━━━━━━━━━━━━━━━━━━━━━━━━━━
HOW TO SPOT A RANGE
━━━━━━━━━━━━━━━━━━━━━━━━━━━━━━━━━━━━━━━━━━━━━━━━━━━━
Ask yourself:
1. Is price making higher highs AND higher lows? → If NO, likely ranging
2. Do breakouts hold? → If they fade quickly, it's a range
3. Is volatility expanding or contracting? → Contracting = range
4. Are there multiple failed attempts at the same level? → Range behavior
On this chart: ❌ No trend structure ❌ Breakouts fade ❌ Volatility flat
Verdict: RANGE — not a trending environment.
━━━━━━━━━━━━━━━━━━━━━━━━━━━━━━━━━━━━━━━━━━━━━━━━━━━━
WHY THIS MATTERS
━━━━━━━━━━━━━━━━━━━━━━━━━━━━━━━━━━━━━━━━━━━━━━━━━━━━
In ranging conditions:
- Breakouts are more likely to fail
- Continuations lack momentum
- Liquidity sweeps dominate
- Mean-reversion > trend-following
The problem isn't your entry. It's the regime mismatch.
━━━━━━━━━━━━━━━━━━━━━━━━━━━━━━━━━━━━━━━━━━━━━━━━━━━━
WHAT TO DO IN THIS ENVIRONMENT
━━━━━━━━━━━━━━━━━━━━━━━━━━━━━━━━━━━━━━━━━━━━━━━━━━━━
✓ Reduce position size
✓ Reduce trade frequency
✓ Avoid chasing breakouts
✓ Expect rotation, not extension
✓ Wait for regime shift before trending plays
Waiting is a valid trading decision.
━━━━━━━━━━━━━━━━━━━━━━━━━━━━━━━━━━━━━━━━━━━━━━━━━━━━
KEY TAKEAWAY
━━━━━━━━━━━━━━━━━━━━━━━━━━━━━━━━━━━━━━━━━━━━━━━━━━━━
Most losses happen when traders force trend logic into a market that isn't trending.
Context first. Execution second.
━━━━━━━━━━━━━━━━━━━━━━━━━━━━━━━━━━━━━━━━━━━━━━━━━━━━
This is NOT a trade call. This is NOT a buy/sell signal.
This is an educational breakdown of market behavior.
Excellent opportunity to go long on Bitcoin in the short term.Bullish Catalyst Logic: Three-Pronged Support Builds the Foundation for a Rebound
1.Strong Technical Demand for Oversold Recovery
Bitcoin’s daily price has pierced the lower Bollinger Band and remained outside the channel. Historical patterns show that the probability of returning to the channel after a breakout exceeds 80%, signaling clear short-term recovery demand.
A resonant key support system has taken shape:
$83,680 marks the convergence of the 100-week SMA and the long-term uptrend line, serving as a structural strong support level.
The $85,000-$85,500 range was the sideways-trading low after the recent sharp decline, withstanding multiple tests to form a solid capital absorption platform.
The RSI indicators on the 1-hour and 30-minute charts have turned upward from the oversold zone. On the 4-hour chart, the MACD shows shrinking volume with capital accumulation, and the DIF and DEA lines are converging—all signs that downward momentum is gradually fading, and a technical rebound could be triggered at any time in the short term.
2. Chip Structure & Rebound Momentum After Liquidations
The market has recently exhibited the characteristic of "long liquidations forcing a bottom". Over $295 million worth of long positions were liquidated globally in the past 24 hours. Excessive selling has concentrated chips in the $85,000-$86,700 range, fully releasing selling pressure.
On-chain data reveals that long-term holders (with positions held for over 1 year) have increased their holdings in the $84,000-$87,000 range by 27% month-on-month. Their buying has absorbed short-term selling pressure, laying the fundamental groundwork for a rebound. In addition, there is a price gap in CME Bitcoin futures, which has a high historical filling probability and acts as a key short-term price magnet.
3. Macro Easing Expectations Have Not Been Fully Priced In
Market expectations for further Fed rate cuts remain intact, and the broader environment of synchronized monetary easing across major global economies has not changed, providing implicit liquidity support for risk assets.
Bitcoin’s negative correlation with risk-free yields persists. If economic data falls short of expectations, expectations for further easing may reignite, driving capital back into the crypto market. Currently, the $86,700 price level has partially priced in negative factors, putting Bitcoin in a relatively safe valuation range.
Bitcoin trading strategy
buy:85500-86500
tp:88000-89000-92000

BTCUSD Head and Shoulders Pattern Still in ControlHead and shoulders pattern is still in control of the market currently and applying pressure to the downside.
A bearish continuation pattern has confirmed that more downward movement will resume.
Price will either fall from resistance or from supply. High probability target is 82k and lower probability is 74k

Bitcoin Price Correction: Heading Toward $70,000As of December 17, 2025, Bitcoin is trading around $87,000–$88,000, down from its all-time high of over $126,000 earlier this year. Recent market volatility, driven by macroeconomic factors like potential Bank of Japan rate hikes and profit-taking after the post-election rally, has analysts warning of further downside.
Many technical indicators point to a potential retest of the $70,000–$75,000 support zone. This level has historically acted as strong demand in previous corrections and aligns with key moving averages and Elliott Wave projections from experts. A drop to $70,000 would represent a roughly 20% decline from current prices, which is common in Bitcoin's cyclical patterns during consolidation phases.
While long-term bullish factors remain (institutional adoption, ETF inflows, and scarcity post-halving), short-term bearish pressure could push BTC lower before any rebound. Traders should watch $84,000 as immediate support—if it breaks, $70,000 becomes the next major target.
This is not financial advice; cryptocurrency markets are highly volatile.

Bitcoin Is Still 27% Undervalued — Eyes on the Levels 📌 Bitcoin Is Still 27% Undervalued — Eyes on the Levels 📈
Current price: $86,895
Fair price: $118,443 (Power Law Model)
Bottom price: $49,746 — historically never violated.
We remain in the upward sloping power law channel. As it stands, Bitcoin is 27% undervalued , holding above the dynamic EMA and within range of key decision levels.
Main support sits at $78,796 , but expect a quick wick below it — those are the buys I wait for.
Main resistance sits at $91,067 — if I see a breakout above, I buy that too.
Fair value will be lowered by 29% soon to reflect time spent under the mean — but the formula itself stays unchanged. Bitcoin is still the only asset that fits this curve.
🔒 I never go short on Bitcoin.
Why? Because if BTC drops 2%, some alts will drop 20%.
I hedge with those instead — not with BTC. Know your tools, protect your capital. DYOR
Trading Wisdom 📜
You don’t need to catch the bottom or the top.
Just understand the levels and be ready when price comes to them.
When you're prepared, you don't chase — you execute.
Disclaimer: I'm not a financial advisor — I'm just a trader sharing my chart and opinion. This is how I see the market. Always do your own research and manage your risk accordingly.
One Love,
The FXPROFESSOR 💙
🧠 Know the Fundamentals
Before you trade the levels, understand the asset. Bitcoin isn’t just price action — it’s a response to broken monetary systems, a hedge against inflation, and a protocol for digital scarcity. The more you grasp what problems it solves, the clearer your conviction becomes when volatility hits. And that is the compass to follow..just remember to have patience, persistance and a risk management in place.

Bitcoin (BTC/USD) – Daily Technical AnalysisTimeframe: 1 Day
Trend: Medium-term bullish, short-term corrective
Market Structure
Bitcoin is still trading within a long-term ascending trendline, which has been respected multiple times since 2023. However, price has recently broken below the trendline and is now pulling back toward a major demand/support zone highlighted in green.
This suggests the market is in a corrective phase within a larger uptrend, not a confirmed trend reversal yet.
Key Levels
Major Support Zone: $80,000 – $83,000
(Strong historical demand + prior consolidation)
Immediate Resistance: $90,000 – $92,000
Major Resistance: $100,000+
Trendline Support (lost): Now acting as dynamic resistance
RSI (14) Analysis
RSI is around 40–45, below the neutral 50 level.
This indicates weak momentum but not oversold.
Historically, RSI bouncing from this zone has led to relief rallies, especially near strong support areas.
Scenarios
Bullish Scenario
Price holds above $80K support zone
RSI stabilizes and moves back above 50
A bounce toward $92K → $100K becomes likely
Bearish Scenario
Daily close below $80K
RSI drops toward 30
Deeper correction possible toward $72K – $75K
Conclusion
Bitcoin remains structurally bullish on the higher timeframe, but the daily chart shows short-term weakness. The $80K–$83K zone is a critical decision area. A strong reaction here could offer a good risk-to-reward long opportunity, while a breakdown would signal a deeper correction.

How to Use VWAP in Confluence with StructureVWAP is one of the few indicators that consistently adds value when used correctly. It does not predict direction and it does not replace market structure, but it provides a powerful reference point for where fair value sits within the current session or trend.
When combined with structural analysis, VWAP helps you filter trades, improve timing, and avoid impulsive entries that fight the underlying flow.
The first step is understanding what VWAP represents. It shows the average price weighted by volume, reflecting where most transactions have occurred. When price trades above VWAP, it signals that buyers are in control of the session.
When price trades below it, sellers dominate. This context becomes meaningful only when it aligns with the higher timeframe structure.
Start by establishing your bias through market structure.
If the higher timeframe is in an uptrend and price trades within a discount zone, VWAP becomes a dynamic confirmation tool. A reclaim of VWAP after a liquidity sweep or after a break of structure is one of the cleanest signals that buyers are stepping back in.
The same applies in reverse for downtrends: a VWAP rejection after a pullback into premium strengthens the short bias.
VWAP also adds clarity during intraday consolidation. Ranges often form around VWAP because it reflects the session’s equilibrium. Breakouts that occur away from VWAP without pullbacks frequently lack durability.
However, a breakout followed by a retest of VWAP shows acceptance and builds confidence in continuation. This combination turns a common indicator into a reliable filter rather than a standalone signal.
Another effective use of VWAP is identifying exhaustion. When price aggressively pushes far above or below VWAP, it often signals that the move is extended. This does not mean you fade the trend, but it does mean you tighten expectations and wait for structure to align before entering. Once price reconnects with VWAP and shows intent, the next move becomes more sustainable.
VWAP becomes particularly powerful when paired with session logic. Trading above VWAP in a bullish higher timeframe environment during London or New York sessions often leads to cleaner impulses.
Trading against VWAP during low-volume hours produces far more false signals. Timing, structure, and VWAP together create a cohesive framework.
Used in confluence, not in isolation, VWAP supports disciplined decision-making.
It aligns entries with momentum, filters low-quality setups, and clarifies whether the market accepts or rejects a level. When you combine VWAP with structure, liquidity, and session context, your trades become more intentional, less emotional, and significantly more consistent.
Bitcoin vs Silver (BTC/XAG) – Intermarket Risk PerspectiveYes, this is exactly what rising relative risk between two assets looks like.
Intermarket analysis allows us to identify where capital is actually flowing, rather than focusing on isolated price movements in a single market. By comparing a high-risk asset to a defensive one, we gain a clearer view of the broader risk regime.
The missing link in the current market cycle is this:
when precious metals move to the top of the capital hierarchy, ultra-risk assets such as crypto inevitably come under sustained pressure.
The Bitcoin-to-Silver ratio visualizes this dynamic remarkably well.
The Elliott wave structure appears clean and mature, with the ratio now hovering around a historically significant equilibrium zone (approximately 700–800) — a level that has repeatedly acted as a pivot for capital rotation.
This chart is not just a ratio; it is a macro signal of risk appetite.
As long as silver and precious metals remain dominant, continued downside pressure on crypto assets is a logical and intermarket-consistent outcome.

BITCOIN Ichimoku red flip taking place. NOT GOOD.Bitcoin (BTCUSD) is in the process of turning its 1W Ichimoku Cloud from bullish (green) to bearish (red). It has been on a consecutive green state since October 23 2023.
This red flipping is a major development as relative to the previous BTC Bear Cycles, it has happened around the exact same stage that we are at right now. This technically confirms that we are already on the new Bear Cycle (something we've been talking about since September) and that the basic stages/ phases of it remain the same.
The high degree of symmetry is further shown by the fact that when this Ichimoku flip takes place, the price has historically been trading around 175 days (25 weeks) away from it (green circle), supported by the 1W MA100 (green trend-line). And that has always been the stage of a counter-trend rebound/ rally that targeted and was rejected on the 1D MA200 (red trend-line).
The second remarkable display of symmetry is that following this Ichimoku red flip, the Bear Cycles bottomed around 105 days (15 weeks) after it (blue circles).
So what do the above data suggest for the market right now? That there is a short-term rally pending towards the 1D MA200 and that we may see the Bear Cycle bottoming around the end of September 2026.
Would you agree with this thesis? Feel free to let us know in the comments section below!
---
** Please LIKE 👍, FOLLOW ✅, SHARE 🙌 and COMMENT ✍ if you enjoy this idea! Also share your ideas and charts in the comments section below! This is best way to keep it relevant, support us, keep the content here free and allow the idea to reach as many people as possible. **
---
💸💸💸💸💸💸
👇 👇 👇 👇 👇 👇

BTC 4H CHART ROUTE MAPDear Traders,
Please review the BTC 4H chart technical analysis below.
We previously shared our price action analysis, and it remains valid. However, BTC has been moving sideways on the 4H timeframe for nearly three weeks. Recently, price broke the lower trendline, suggesting a potential retest higher—first toward the FVG around 88k, and possibly a further retest at the BPR zone near 91k.
Scenario 1:
If price is rejected from the FVG or BPR levels and the trend line, this would confirm a pullback toward the order block (OB) and demand zone around 83k–84k, clearly marked with a downside arrow.
If this demand zone 83k is broken, price could continue lower toward the next key demand level around 81k and potentially sweep liquidity at 78k.
Scenario 2:
If price successfully breaks above the FVG and BPR levels and trend line, it would confirm a move back into the trendline and zone area, supporting further bullish continuation to collect liquidity around 99k & potentially at 107k zone.
As always, it’s best to buy from dip levels and sell from higher levels. Avoid chasing price at the top, and trade with proper risk management. Our level-based structure typically provides 40–50 pips of reaction, offering solid opportunities for clean entries and exits.
With December 2025 underway and the holiday season approaching, market conditions remain uncertain. There are several red-flag news events on the calendar, so it’s important to keep positions light and tight and avoid choppy market conditions.
Please like, comment, and boost the post.
The Quantum Trading Mastery

BTC/USD Bearish SetupThis BTC/USD 2-hour chart shows a clear shift from bullish to bearish structure. Price previously respected the ascending trendline, but a Head and Shoulders pattern formed near the highs, signaling trend exhaustion. The neckline breakdown was followed by strong bearish momentum, confirming sellers’ control. Price is now trading below key Ichimoku levels, indicating weakness and limited upside. A brief pullback is possible, but overall structure favors continuation to the downside. The marked supply zone above may act as resistance if price attempts a retrace. As long as BTC remains below the broken trendline and resistance area, downside pressure is expected to continue.
First target is set near 84,100, where minor support exists. A clean break below this level could open the path toward the second target at 82,000.
If you found this XAUUSD analysis helpful, don’t forget to LIKE 👍 and COMMENT 💬!

BTC Wyckoff theory“BTC appears to be in a distribution phase according to Wyckoff theory, indicating a potential markdown ahead as supply overwhelms demand.”

BTCUSD | Next Stop 75K - Still Bullish?Hello traders,
People are finally starting to believe in the bear market afterall, yea?
Here is our next stop lads, get ready.
Good Luck!

BTC 4H analysisOverall Market Context
BTC is trading around $86,500 after a sharp correction from the all-time high area (~$108,000–$116,000 range visible on the left). The 4H chart shows a clear downtrend since mid-November, with lower highs and lower lows. Current price is -511 (-0.59%) on the bar, continuing the bearish momentum.
Indicator Key Insights
Higher Timeframe Bias
Bearish (red background from daily EMA 20/50 crossover)
This strongly favors shorts or waiting for clear reversal signals. Longs are counter-trend until bias flips.
Anchored VWAP & SD Bands
Current AVWAP: 93,767.68
Price is -7.75% below VWAP — significant bearish deviation.
SD Bands (from current swing):
±1σ: ~86,398 – 101,137
±2σ: ~79,028 – 108,506
±3σ: ~71,659 – 115,876
Price is sitting near the lower ±1σ band (~86,398), suggesting potential oversold/mean-reversion bounce territory, but in a strong downtrend, lower bands often get tested further.
Volume Profile (Fixed Range from Recent Downswing)
POC (Point of Control): 90,310.50 — highest volume node acting as overhead resistance.
Value Area: Wide yellow/blue shading on the left — high-volume zone from ~$88,000–$100,000 (previous consolidation).
Current price is below the Value Area low, indicating distribution and weakness.
HVN clusters higher up show where institutions defended — now acting as resistance on any bounce.
Fibonacci Levels
Drawn from recent swing high (~116k area) to low.
Price rejecting near 0.382–0.5 retracement zone (common resistance in downtrends).
Golden Pocket (0.618–0.65) likely around $100k+ — strong overhead if any rally attempts.
Signals & Confluence
Recent signal: Orange downward triangle with score 3 (medium bearish confluence) near the top left — triggered the ongoing sell-off.
Last signal: 3 (bearish) — AVWAP cross down + proximity to POC/Fib resistance.
No recent buy signals visible — all momentum bearish.
Current Setup & Trade Ideas
Bearish Bias (Primary Scenario)
Continuation short or fade rallies:
Best entry: On bounce to POC (90,310) or AVWAP (93,767) with new sell signal (score ≥3).
Targets: Lower ±2σ (~79,000) or ±3σ stretch (~71,600).
Stop: Above recent swing high or upper ±1σ.
RR: Excellent 3:1+ potential in trend.
Why strong: Bearish HTF bias + price far below VWAP + volume profile showing distribution.
Bullish Reversal (Lower Probability – Counter-Trend)
Only on strong oversold bounce with green triangle score ≥4.
Potential long if price holds lower ±1σ and signals reversal near ~$86,000 support.
Target: Back to POC (90k) or VWAP retest.
High risk — against HTF bias.
Risks & Notes
Oversold conditions: Price at lower bands — watch for capitulation bounce or short squeeze.
Bitcoin volatility: News (ETF flows, macro, regulation) can override technicals quickly.
Best trades: Wait for score 4+ sell signals on rally to POC/VWAP — highest edge in current environment.
If HTF bias flips green, shift to long bias.
The indicator paints a clear bearish picture: price rejected from high-volume resistance, far below VWAP, with bearish HTF alignment. The recent score-3 sell signal initiated the drop and remains valid.
Primary play: Fade strength into POC/VWAP zone for continuation lower.
Trade with the trend until proven otherwise.
Stay disciplined!

BTCUSD Supply Zone Rejection | Bearish Continuation SetupBTCUSD rejected from supply zone and broke the ascending channel. Bearish momentum suggests a move toward lower demand areas.Risk Management (Very Important)

Elite | BTCUSD | 1D – Macro Accumulation & Trend Holding PhaseBITSTAMP:BTCUSD
The previous impulsive leg confirms strong institutional participation. The current decline is corrective, not impulsive, with price respecting the daily trendline and holding above major demand. Prolonged consolidation at this level suggests energy building for a larger expansion move, as volatility compression typically precedes directional continuation in macro trends.
Key Scenarios
✅ Bullish Case 🚀
If BTC holds above the daily holding area and reclaims the correction zone:
🎯 Target 1: 95,000
🎯 Target 2: 105,000
🎯 Target 3: 118,000 – 120,000 (ATH liquidity zone)
❌ Bearish Case 📉
If price decisively breaks and closes below daily trend support:
🎯 Downside Target 1: 78,000
🎯 Downside Target 2: 72,000 (major HTF demand)
Current Levels to Watch
Resistance 🔴: 95,000 – 100,000
Support 🟢: 82,000 – 78,000
⚠️ Disclaimer: This analysis is for educational purposes only. Not financial advice.

OVERVIEW BTC H1 CHART I 12/17
1. Volume Profile & Market Structure
The chart utilizes the Volume Profile to identify key liquidity zones:
POC (Point of Control) at 87,173: This is the price level with the highest traded volume. Since the current price (86,574) is trading below the POC, the bears (sellers) have a slight upper hand in the immediate short term.
VAH (Value Area High) at 88,294: This acts as a major overhead resistance. If the price reclaims the POC, this will be the next target.
VAL (Value Area Low) at 86,138: This is the crucial support zone right below the current price.
2. Trendline Analysis
Ascending Support Line: There is a clear upward trendline acting as a floor for recent pullbacks. The price is currently approaching this line (around the 86,000 - 86,200 area).
Descending Resistance: A short-term downward trendline from recent peaks is squeezing the price, forming a narrowing triangle pattern.
3. Potential Price Scenarios
BTC is currently in a sideways consolidation phase within a tight range (86,000 - 87,500).
Bullish Scenario: If the price holds above the VAL (86,138) and bounces off the support trendline, it needs a candle close above the POC (87,173) to confirm a recovery toward 88,300 and potentially retest the 90,000 psychological level.
Bearish Scenario: If an hourly candle closes below 86,100 (breaking both the VAL and the diagonal support), we could see a rapid drop to deeper support levels at 85,000 or 84,200 to seek new liquidity.
4. Summary Verdict
The price is at a critical pivot point. While there is significant buying interest visible in the 86,000 volume cluster, the selling pressure near 88,000 remains heavy.
Key Takeaway: Monitor the 86,100 level closely. It is the most important "defensive line" for the bulls right now. If this level fails, expect further downside.

Downside risks persist for BTCUSD amid waning risk appetiteBitcoin prices (BTCUSD) slipped toward an eight-month low as weakening risk sentiment and macroeconomic uncertainty weighed on crypto markets, while selling pressure intensified after forced liquidations in leveraged long positions, accelerating the downside momentum. ETF outflows of more than 500 mln USD over the past two days signal fading demand and limited dip-buying interest.
Technically, BTCUSD extended its decline following a breakout of the ascending trendline, reinforcing the broader downtrend. A sustained break below 83,800 may pave the way for a further decline toward the swing low at 80,500. Conversely, a recovery back above 88,000 could prompt a retest of the 90,000 resistance.
By Li Xing Gan, Financial Markets Strategist Consultant to Exness

BTC True AlgoTrading BTC with True Algo. Price reacts at key liquidity levels. These are identified by Weekly, Daily boxes. Once these are swept and reclaimed confirmation is given to look for the next area of interest.

BTC 1D TRADE SETUPBitcoin breakdown it rising wedge pattern after a downward momentum if it break 86500 level then 75000 level is the target
