Weekly BTCUSD Analysis: Bullish Momentum Builds Toward $96,000.Analysis:
Bitcoin (BTCUSD) closed last week with strong bullish momentum, confirming buyers’ control as price continues to respect higher-timeframe demand zones. The broader market environment remains supportive, with a declining US Dollar and rising geopolitical tensions increasing demand for alternative and safe-haven assets such as Bitcoin.
🔑 Key Weekly Levels
Primary Support: 87,595
Strong Support (Major Demand Zone): 83,780
Immediate Resistance: 90,660
Next Resistance: 94,662
Bullish Target: 96,000
📈 Technical Analysis
From a technical perspective, BTCUSD maintains a bullish market structure, printing higher lows on the weekly timeframe. Price continues to trade above key moving averages, indicating sustained upside momentum.
Support validation: The zone around 87,595 has acted as a reliable demand area, where buyers repeatedly step in.
Trend strength: Momentum indicators suggest bullish continuation, with pullbacks being shallow and corrective in nature.
Breakout potential: A confirmed weekly close above 90,660 would strengthen bullish conviction and expose price toward 94,662, followed by the psychological 96,000 level.
The 83,780 region remains a strong long-term support and represents a high-probability accumulation zone should deeper retracements occur.
🌍 Fundamental Context
The ongoing weakness in the US Dollar combined with elevated geopolitical risks continues to support Bitcoin’s narrative as a hedge and alternative store of value, reinforcing the bullish technical outlook.
🔮 Outlook
As long as BTCUSD holds above 87,595, the bullish bias remains intact. A breakout above resistance could trigger the next impulsive leg higher toward 96,000 in the coming weeks
Regards: Chart Analyst Pro.
#BTCUSD #Bitcoin #WeeklyAnalysis #CryptoMarket #BTCBullish #TechnicalAnalysis
Market insights

BTC Update on short term scenariosHi Traders,
Yesterday I posted these scenarios.
BTC tested the first green box of support and bounced back to the resistance area I drew.
Now interested in rotation on the low time frame for short plays . If we gain that level, I will be looking for longs. Remember: we don't predict the market, we follow it's structure.
Just my opinion, no advise ;)
Have a nice day!
M.

BTCUSD Weekly Thoughts: Macro Factors in FocusBTCUSD Weekly Market Outlook
BTCUSD ended last week with a bearish close, reflecting short-term hesitation in price action. However, the 89,611 zone continues to act as an important point of control, suggesting ongoing market participation around this level.
From a broader perspective, recent geopolitical developments related to Ukraine have increased demand for alternative and safe-haven assets. At the same time, a weakening U.S. dollar has provided underlying support to BTCUSD, helping to stabilize price despite last week’s bearish close.
Looking ahead, several U.S. economic reports are scheduled for release this week. These data points may further influence USD strength and overall market sentiment. If dollar weakness persists, it could continue to shape a more constructive environment for BTCUSD.

BTCUSD testing descending trend line, will we see a breakout?Bitcoin prices saw muted movements as investors remained cautious over whether the recent pullback reflects a temporary pause or a deeper correction to come.
Liquidity conditions have thinned, while subdued ETF flows reflect waning demand. Meanwhile, digital asset treasury companies faced sharp losses amid bitcoin volatility, with some trading below their mNAV of less than 1, indicating that investors valued them less than the crypto on their balance sheet.
With onchain signals mixed and ETF flows choppy post-FOMC, bitcoin prices may continue to consolidate in the near-term.
From a technical perspective, BTCUSD retreated below the descending trend line and is testing the 88,000 support, where a break below this level may prompt a further decline toward the following support at 82,000. Conversely, closing above the trend line and 94,000 resistance may prompt a further rise toward the psychological resistance at 100,000.
By Li Xing Gan, Financial Markets Strategist Consultant to Exness

BTC Technical Analysis Dec 15, 2025BTC/USD – 4H Technical Analysis (Short)
1. Trend: Bearish. Clear sequence of lower highs & lower lows.
2. Structure: Breakdown below prior support (~105–107k); that zone now acts as resistance.
3. Moving Averages: Price trading below EMA 50 & 100, both sloping down → bearish momentum intact.
4. Pattern: Rounded/descending consolidation near 90–94k, suggesting continuation lower.
5. Key Support: 83.8k (major horizontal). Below that → 80–82k risk.
6. Key Resistance: 91–94k, then 100–105k.
7. Bias: Bearish below 94k. Bullish only if strong reclaim above 100k+ with volume.

BTC Correction Higher Before Lower?BTC possibly just completed a leading diagonal for Wave A, part of an ABC that could take price up near $100k before Y leg of a larger W-X-Y to $70k or below.
Also looks like the recent correction from $80k to $94k could be wave 4...(alt shown in yellow)
I think if price breaks above the recent high of $94,652 then $100k+ is confirmed for Wave X
There is also a CME gap at $109k
If price dips below $80k then we're in wave 5 of A most likely.

BTCUSD ARE WE GOING BULLISH CASE STUDY1 FOR THE WEEKCURRENT CONDITONS IN BTC
we see that after the selloff to 87642 btc hit the support level S2 at that price and rallied on the open of the market .
this rally on the 1h timeframe shows us a strong classic bullish ingulfing pattern that meets all the strict rule requirements
the current position is inside the zone between 89310 and 89558
the current position for upswing looks promising since we starting the week with a strong bullish sing showing that the bulls won this level
but we not close to seeing more upswing unless we break out of the grip of the box range btc broke out of when it went down .
the current conditions if all works out could like to a jump above 90k
WHAT IS THE INDICATORS SAYING
on the 1h the ris is touching the bottom of the 50mark good and bad side for upswing a clean break above 50 would be better
the macd has a cross over for a bullish upswing due to te bullish ingulfing
the adx is slowing down killing some of the selling power but it still has strength to recover
with this the current resistance levels and adx is a clear indication to be careful keep entries small and stops active at key potions
FINAL WORDING
UNLESS WE BREAK ABOVE 88558 WE ARE TRAPPED ...AND COULD SEE POSSIBLITY MORE DOWN SIWNG
trade save and i hope this info helps

BTC 4H Chart Route MapDear Traders,
BTC has shown strong gains this week and has confirmed a short-term bullish trend across multiple confluences.
Wait for the price to pull back to the entry zone around IFVG & BPR area close to $89K–$91K before looking for TP1, TP2, and TP3, with your stop-loss set at $83,500.
Always trade with proper risk and money management.
The Quantum Trading Mastery

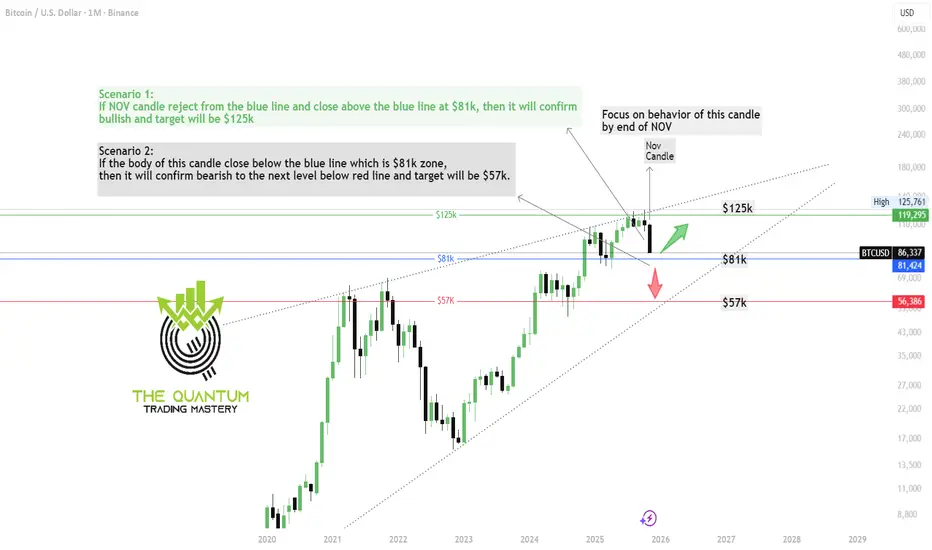
BTC Monthly Chart Technical AnaylsisDear Traders,
As expected from our previous weekly chart analysis, BTC has reached the $80K zone and has now successfully tapped $86K.
At this stage, the monthly candle is extremely important. I’ve shared the November candle—watch the closing carefully, because a major opportunity could be forming.
Trade smart, stay cautious, and if you find this update valuable, please show your support by boosting the post and dropping a comment.
The Quantum Trading Mastery
BTC? recapHi,
We had a break yest.
Now , retest. InsideB area.
Still bearish.
Looking for further. Bearish setup.
Yes or Nil. Depends on personal Setup availability.
All the best
Not a guru

Bitcoin Rejected at Supply1. MARKET CONTEXT
Bitcoin on the 1H timeframe has just tapped into a clear resistance / supply zone, where previous bearish impulses originated.
The reaction is identical:
- Immediate slowdown
- Loss of bullish momentum
- Selling pressure absorbing every attempt to push higher
This confirms the market is still range-bound, with liquidity building between supply above and demand below.
2 . TECHNICAL ANALYSIS
The chart structure highlights:
• Supply Zone Rejection
Price entered the resistance zone and instantly stalled — showing strong sell orders waiting in that area.
• Lower-Timeframe Shift
The current candlestick sequence shows a micro shift from bullish impulse → correction → bearish intent.
• Liquidity & Imbalance Below
There is an unfilled region between current price and the demand zone, creating a clean path for the market to drop.
• Demand Zone Waiting at 89,300 – 87,770
This is where previous strong buy orders originated, making it the most logical target for the next bearish leg.
Overall, the structure favors a continuation downwards after a small corrective pullback.
3. TRADE IDEA
Bias: Short from the Supply Zone
The entry is positioned inside the resistance zone, aligning with institutional sell reaction.
Expected Price Behavior:
Minor bullish correction
Bearish continuation
Price targets the Demand Zone at 89,300 – 87,770
Trade Structure Shown on Chart:
Stop Loss: Above the supply zone
Entry: At resistance rejection
Take Profit: Demand zone below
This setup follows clean smart-money flow from supply → demand, with no structural break supporting a bullish reversal yet.

BTCUSD in Risk-Off Mode | Diversify & Scalp SmartBTCUSD Risk-Off Consolidation – Eyes on 70K Risk, Scalping to 100K
Bitcoin’s stuck in a risk-off rut, consolidating near 90,000–95,000 as global markets turn cautious. It’s not dumping yet, but a sell-off to 70,000 looms if sentiment worsens. Here’s my approach to navigate this:
Setup:
Current State: BTCUSD’s holding low, reflecting risk-off flows (flat 20-day EMA, RSI ~40). Volume profile shows weak support until 70,000.
Risk Warning: A break below 90,000 could trigger a slide to 70,000, a key demand zone with historical buying.
Strategy:
Scalping Start: Enter small-position scalps (0.01–0.02 lots) on intraday bounces (e.g., 4H bullish pin bars above 90,000), then manage into longer-term positions if momentum builds.
Diversification: Mitigate risk by trading other pairs (e.g., XAUUSD, EURUSD) with calculated entries. Use available margin and prop firm leverage (e.g., FTMO’s 1:100) wisely, keeping total risk at 10% max.
Position Management: Scale in cautiously, trailing stops to lock in profits. My long-term target is 100,000, but hope isn’t a strategy—small positions keep me flexible.
Market Context:
Risk-off sentiment (e.g., equity sell-offs, USD strength post-Fed) is capping Bitcoin’s upside. Recent highs near 103,000 (November 2025) faded fast, and low volume suggests hesitation. A 70,000 test is possible if macro fears grow, but 100,000 remains viable if safe-haven flows return. Volatility’s moderate (3–5% daily), ideal for scalping with tight risk.
Risk Warning: Don’t put all eggs in one basket. BTC’s downside risk demands diversification and strict risk management (10% max, per FTMO rules). Trade calculated, not emotional!
What’s your BTCUSD play?
Share your setups or risk-off strategies below!
#BTCUSD #Bitcoin #RiskOff #Scalping #RiskManagement

BTC Awaits a Liquidity Sweep Before Any Real RallyBitcoin on the H4 timeframe continues to hover inside a tight equilibrium band around 91,500–93,500, with price repeatedly tapping both edges of the range without showing directional commitment. The current movement suggests liquidity hunting rather than trend development, as every push toward 92,000 quickly gets absorbed.
Macro conditions still lean supportive thanks to the low-rate outlook, yet capital flows are favoring metals over crypto, leaving BTC with a muted recovery after the prior drop. Buyers remain cautious while sellers lose momentum, causing price to float above two demand/FVG layers at 89,500–90,500 and 86,500–88,000.
The scenario with the highest probability is a final liquidity flush. BTC may continue consolidating around 92,000–93,000 before sliding to 90,000 and dipping into the deeper FVG at 88,000–86,500. A clean reaction there would open room for the next impulsive leg upward.

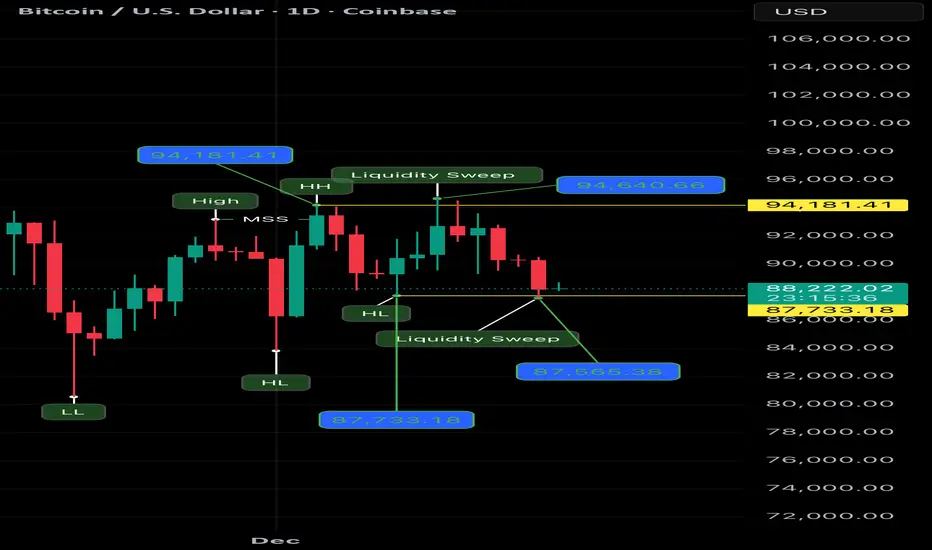
Daily Timeframe | Structure & Liquidity BehaviorCOINBASE:BTCUSD
This daily Bitcoin chart shows a clear sequence of price behavior driven by liquidity interaction, not randomness.
Let’s go step by step.
⸻
1️⃣ Market Structure Shift (MSS)
Price breaks above a previous daily high, creating a temporary bullish shift in structure.
This move changes short-term bias and pulls attention to higher prices, but structure alone does not confirm continuation.
⸻
2️⃣ Higher High Formation
After the shift, price extends higher and prints a Higher High around 94,181 – 94,640.
This area becomes a natural reaction zone, where:
• Stops accumulate
• Breakout activity increases
• Participation expands
Price now has clear overhead liquidity.
⸻
3️⃣ Liquidity Sweep Above Highs
Price pushes above the highs with long upper wicks, taking liquidity, but fails to hold above the level.
Key observations:
• No sustained closes above highs
• Immediate rejection
• Weak follow-through
This indicates exhaustion, not strength.
⸻
4️⃣ Loss of Upward Momentum
Following the sweep, price struggles to progress higher and begins to rotate lower.
This signals that the move up completed its objective and that the market is no longer accepting higher prices.
⸻
5️⃣ Downside Rotation Toward Higher Lows
As price moves down, attention shifts to the daily Higher Lows (HLs) that supported the prior structure.
These lows represent protected liquidity beneath the market.
⸻
6️⃣ First Sell-Side Liquidity Sweep (≈ 87,733)
Price drops sharply and sweeps a daily Higher Low, triggering stops and accelerating movement.
This move is clean and direct, showing clear intent.
⸻
7️⃣ Second Sell-Side Liquidity Sweep (≈ 87,565)
A deeper wick follows, confirming:
• Downside liquidity was actively targeted
• The move was deliberate and measured
Multiple sweeps reinforce the idea of liquidity completion, not panic.
⸻
8️⃣ Current Price State
At the current level (~88,340):
• Liquidity has been taken on both sides
• Price is transitioning into a balance / evaluation phase
From here, the next move will depend on:
• Acceptance above the swept lows
• Or continuation below with new structure development
⸻
Final Takeaway
This chart demonstrates a pure cause-and-effect sequence:
✔️ Structure shift
✔️ Highs taken
✔️ Rejection
✔️ Lows taken
✔️ Reset
No assumptions.
No narratives.
Just price responding to liquidity.
Not a financial advice.
Ai Generated.
Lower Prices for $BTC is Bullish!If CRYPTOCAP:BTC takes a dip this week, it could set up a bullish divergence that could really get the year end to Q1 rally started!

Elise | BTCUSD - Distribution to Bearish ContinuationBITSTAMP:BTCUSD
After the distribution phase, price delivered a strong bearish displacement, confirming sellers’ control. Although a temporary bullish reaction pushed price back toward the profit-taking zone, buyers failed to achieve acceptance above key resistance. The subsequent rejection and bearish Break of Structure (BOS) confirm that the recent upside move was corrective rather than trend-reversing.
Key Scenarios
❌ Bearish Case (Primary) → As long as price remains below 90,950–91,000, downside continuation is favored. A sustained move lower may target 89,200, followed by the 88,800–88,000 liquidity pool, where resting buy-side liquidity is located.
✅ Bullish Case (Invalidation) → A strong reclaim and hold above 91,200, followed by acceptance above 93,500, would invalidate the bearish bias and open the door for a deeper recovery toward the prior distribution high.
Current Levels to Watch
Resistance 🔴: 90,950–91,200, 93,526, 94,400–94,800
Support 🟢: 89,200, 88,800–88,000 (liquidity pool)
⚠️ Disclaimer: This analysis is for educational and informational purposes only. It is not financial advice. Please conduct your own research before trading.

Btc Buy Setup Elliott Wave Analysis not an adviceThis count is based on my assumptions so anything can happen not a trading or financial advice just for educational purposes only kindly do your own ta thanks trade with care good luck.

BITCOIN Short Swing tradeReasoning:
Strong Industry/Sector
50MA Pullback
If Labelled a Swing trade(2-6 Week Holds)
Entry: Full position on breakout
Profit Taking: Sell 1/3 at Goal 1
Final Exit: Remainder at Goal 2
If labelled a long term trade (3-12 Month Holds)
Entry: Full position on breakout
Profit Taking: Sell 1/4 to 1/5 at Goal 1
Exit Signal: Close below 20-day EMA (your trend guide) or 50EMA
Why: Strong moves are hard to time at the top, but the 20EMA acts as a reliable trend filter
Note:
Remember: Every long-term investment alert can also be played as a swing trade.
I normally use half the risk that I show here, this is because I am okay re-entering if it fails and it gives a better R/R ratio

Bitcoin breakdown risk intensifiesSitting in a rising wedge following an extended downtrend, traders should be on alert for a resumption of the broader bearish trend in bitcoin, putting a retest of the November lows, or even the year-to-date lows, on the cards.
The price is now resting against the November uptrend, with a breach of this level opening the door for another potential wave of selling. If we see a break of $87,800—the low set on 7 December, which sits beneath the uptrend—shorts could be considered with a stop above to protect against reversal.
The 1 December low just beneath $84,000 screens as an initial target, with a break beneath that level putting the 21 November nadir of $80,540 on the menu for bears. Should that target be achieved, traders could assess whether to cut, hold, or reverse the position depending on price action at the time.
With RSI (14) breaking its uptrend and moving further away from the neutral 50 level, it indicates downside pressure is building yet again, favouring bearish setups. While not yet confirmed by MACD, it too is curling over towards the signal line, moving closer to a crossover that would strengthen the bearish signal.
Good luck!
DS

ElDoradoFx – BTCUSD ANALYSIS (15/12/2025)
1️⃣ Market Overview
BTCUSD closed the week under sustained bearish pressure after rejecting major higher-timeframe supply and losing key structural supports. The market is transitioning from a macro uptrend into a deep corrective phase, with price now trading near weekly demand around $88,300–$87,800.
Momentum remains bearish, but volatility compression near support suggests a decision week ahead.
⸻
2️⃣ Technical Breakdown
🔹 Daily (D1)
• Macro trend: Corrective within larger uptrend
• Strong rejection from HTF supply $94,500–$92,600
• Daily BOS confirmed below $90,600
• Price now testing:
• Daily demand
• Rising macro trendline
• EMA structure rolling over; momentum weakening
• Key D1 verdict: Hold above $87,800 = correction | Lose it = trend degradation
🔹 H1
• Clear bearish market structure:
• LH → BOS → continuation
• EMAs fully bearish (20 < 50 < 200)
• Former demand at $89,900–$89,450 flipped into resistance
• Price respecting descending trendline
• Liquidity imbalance above remains untouched
🔹 15M–5M
• Strong impulsive sell-offs followed by weak corrective pullbacks
• Minor bullish divergence forming (relief potential)
• No bullish structure confirmed yet
• Any upside = corrective unless BOS reclaimed
⸻
3️⃣ Fibonacci Analysis (Golden Zones)
🔻 Primary Sell Swing
Swing High: $94,468
Swing Low: $88,343
• 38.2% → $90,720
• 50.0% → $91,405
• 61.8% → $92,080
🟥 Golden Zone (Sell): $90,700 – $92,100
HTF supply + trendline confluence = high-probability rejection zone.
⸻
🔺 Countertrend Buy Swing
Swing Low: $88,343
Swing High: $90,650
• 38.2% → $89,750
• 50.0% → $89,500
• 61.8% → $89,250
🟩 Intraday Buy Zone: $89,750 – $89,250
(Short-term bounce only)
⸻
4️⃣ High-Probability Trade Scenarios
📉 SELL – Primary Weekly Bias
• Entry Zone: $90,700 – $92,100
• Targets:
• $89,900
• $88,500
• $87,800
• $86,400
• Invalidation: Daily close above $92,600
• Logic: HTF supply + fib confluence + bearish structure
⸻
📉 SELL – Breakdown Continuation
• Trigger: Daily close below $88,300
• Retest: $88,500–$88,900 failure
• Targets: $87,800 → $86,400 → $84,000
• Invalidation: Reclaim above $89,900
⸻
📈 BUY – Countertrend (Lower Probability)
• Entry Zone: $88,300 – $87,800
• Targets: $89,500 → $90,400
• Invalidation: Below $87,200
• Note: Countertrend only — reduce size
⸻
📈 BUY – Trend Recovery (High Confirmation Required)
• Trigger: Daily close above $92,100
• Retest: $91,400–$92,100 hold
• Targets: $93,600 → $94,500 → $96,000
• Invalidation: Loss of $90,600
⸻
5️⃣ Fundamental Watch
• No major crypto-specific catalysts this weekend
• FOMC week ahead → volatility expansion expected
• Risk sentiment and DXY remain key drivers
• Weekend likely liquidity-driven (fakeouts possible)
⸻
6️⃣ Key Technical Levels
• Resistance: 89,900 / 90,400 / 90,700 / 92,100
• Support: 88,300 / 87,800 / 86,400
• Sell Golden Zone: 90,700 – 92,100
• Bullish Reclaim Level: 92,100
• Bearish Continuation Level: 88,300
⸻
7️⃣ Analyst Summary
BTCUSD is in a structured bearish correction after rejecting major HTF resistance. The market is currently compressing near daily demand, setting up for either:
• A corrective bounce into premium (sell opportunity), or
• A continuation breakdown into deeper weekly demand.
Patience is required — reaction zones matter more than direction this week.
⸻
8️⃣ Final Bias Summary
• Primary Bias: Bearish (sell rallies)
• Secondary Bias: Short-term bounce possible at $88,300
• Trend Flip Only If: Daily close above $92,100
Weekly control level: $90,000
— ElDoradoFx PREMIUM 3.0 Team 🚀

Bitcoin: Weakness Is Where Opportunity Lurks.Bitcoin is coming off a double top lower high within what appears to be a bearish triangle formation. While this pattern is going to elicit bearish reactions from the herd (experts), it is important to ANTICIPATE potential turning points that can catch everyone off guard. While Bitcoin can break lower and potentially test the low 70Ks, it can ALSO hold the 80K area, form a double bottom/failed low and reverse. Such a formation would confirm a HIGHER LOW on the larger time frames like weekly. How you navigate this situation will totally depend on the time horizon component of your strategy.
The illustration on this chart emphasizes the double bottom scenario. The arrow points to minor support areas to watch price behavior for reversals. The time frame you use to observe will depend on what type of trader you are: day, swing or position. The reason I anticipate price will find support is because the broader fundamentals are still generally bullish, particularly when it comes to future actions by the Fed. It is important to realize, they just cut again and while no futures cuts were announced for the near term, it takes TIME for these recent cuts to be felt, like at least half a year. Sine Bitcoin is anti inflationary, it is likely to benefit.
Another important point is : OPPORTUNITY often lurks in UGLY markets, NOT when Bitcoin is pushing 126K. Why were NONE of the experts calling for Bitcoin to have a healthy correction when it was pushing the highs? They were too busy telling everyone "its going to 200K from here". The herd mentality is REAL and a significant component of human nature. While I also had no idea that this correction was going to unfold, I at LEAST warned people that the RISK was extremely high at those levels. This point further illustrates that NOW is the time be to interested, NOT fearful. It's like going to the supermarket and your favorite food is on sale. What do you do? Stock up on it because normally it costs more, so you perceive value. The concept is the same in the financial markets, its just not as simple because substantial amounts of capital and leverage are also part of the equation.
The optimal mindset for Bitcoin in the coming weeks is: Maintain an OPEN mind because ANYTHING can happen. Be PREPARED for the possibility of price reversing at the major support levels because the broader price structure supports such a scenario. It's ALL about IF the market confirms or NOT. With this in mind, IF it breaks instead, you should at least know how to adjust by stepping aside if you are on smaller time frames, and being enthusiastic to accumulate relative to your risk tolerance as a position trader or investor.
Also note: 88K is the Wave 1, Wave 4 overlap that I have talked about many times. So far price has not spent a significant amount of time below this level. IF it breaks with conviction and stays below for days or weeks, that can be interpreted as we are in the broader Wave 2 which can increase the chances of more of an extreme corrective move within a structure that is still considered bullish.
Thank you for considering my analysis and perspective.

BTC PATH to 2028 - early 2030 I created this so that you don't have to spend more money on influencers who can't keep their word or who are rich from selling classes without giving you benefits, and even abdicating their responsibilities.
why does the bitcoin target remain close to even almost 1 million usd is an almost certain thing? I don't need to discuss bitcoin fundamentals here, you can look it up yourself, even AI can explain it to you. here you understand that we as humans always have the same pattern as our predecessors even from our childhood we will try new things, then go wrong, then learn and so on, where here I mean to explain the pattern where this is likely to happen again.
we continue to the analysis:
why 1 million dollars is almost certain? because bitcoin is currently juxtaposed with gold, as a safe haven, which I have explained in the Gold outlook that I also gave you until 2028, and if that happens, then the scenario that I calculated where gold liquidity will at least 1/2 run to bitcoin and make bitcoin have a marketcap that is almost the same as gold, at least this is what might happen first before the bitcoin narrative can beat gold as a safe haven.
We never know the success of bitcoin or whether quantum computing will thwart the current scenario (2025) the opportunity for bitcoin to become a substitute for gold is indeed great even the value can be 1: 1 in my personal opinion.
1/2 of the gold market cap will be around 20T (if my prediction analysis is correct), where in the future the estimate for the 20T bitcoin market cap is close to the price of 1 million USD.
(please check )
from QT, QE, or others that I cannot explain all the catalysts that make me confident in the analysis that I present to you. hopefully my analysis can be useful for everyone.

BTC Short - Follow the trendBTC looks good for short continuation targeting previous liquidity lows around 74,300.
Stop placement would be around 95,500 - let thy trend be thy friend.
