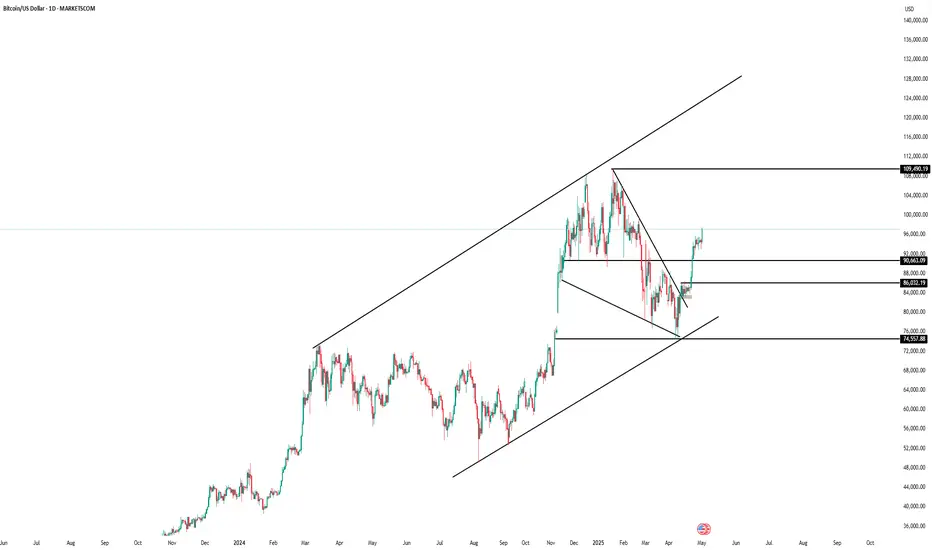
Potential Pullback and ContinuationBitcoin has entered a pullback phase within the current uptrend, and the continuation of the trend is expected following this correction
BTCUSD.P trade ideas

BTC Nearing Short Term TopElliot wave analysis of Bitcoin's current move up. The count isn't pretty but it shows a potential 5 wave move up. This is likely the start of a larger up trend.

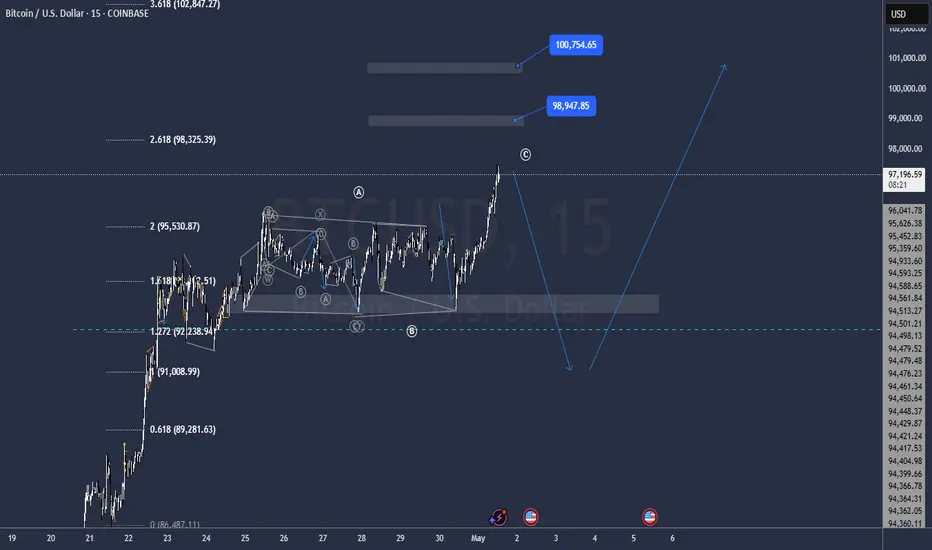
Hellena | BITCOIN (4H): LONG to resistance area of 98,000.Dear colleagues, in this forecast I will not make too forward-looking plans. I believe that the upward movement is not over yet, because the wave “C” is not yet completed and consists of five waves.
I think that we should expect to reach the resistance area of 98,000. A small correction to the support area of 90,000 is possible.
Manage your capital correctly and competently! Only enter trades based on reliable patterns!

correctionIt is expected that after some fluctuation and correction, a trend change will form in the specified support range and we will see the start of the upward trend.

PriceTime Concept in Fractal AnalysisI continue to receive numerous questions about recommended reading, which has left me no other option than pay my debt to the society by elaborating a little more on the unconventional analysis I frequently perform using Fibonacci Channels. Alongside with theoretical insights I'll provide my key inspirations.
The Misbehavior of Markets - Mechanics of Chaos
Benoit Mandelbrot, one of the most extraordinary minds of the 20th century, launched a full rebellion against traditional finance in his book, “The Misbehavior of Markets”. In it, he introduced his groundbreaking “10 Heresies”, a direct challenge to the core assumptions and principles underpinning mainstream financial theories. Mandelbrot’s insights expose how conventional models fail to account for the complexity, unpredictability, and turbulence that define real-world markets.
10 Heresies:
Markets Are Wild, Not Tame
Traditional View: Markets follow predictable, Gaussian-based models with mild fluctuations.
Mandelbrot’s View: Markets exhibit “wild randomness” with extreme, sudden changes that far exceed the predictions of Gaussian distributions.
Heresy: Risk management and pricing models underestimate the likelihood of extreme events.
Financial Variance Is Infinite
Traditional View: Variance (a measure of risk) is finite and calculable using standard tools.
Mandelbrot’s View: In fractal finance, price movements can have infinite variance due to heavy tails in the distribution of returns.
Heresy: Risk cannot be fully measured or predicted using current methods.
Markets Have Memory
Traditional View: Markets are “memoryless,” meaning past price movements do not influence future ones (random walk hypothesis).
Mandelbrot’s View: Markets exhibit long-term memory and dependence, where past trends and events affect current behavior.
Heresy: Independence of price changes is a myth.
Markets Are Multifractal
Traditional View: Price movements are linear and follow simple Brownian motion.
Mandelbrot’s View: Markets are multifractal, with different scaling behaviors across timeframes, and cannot be reduced to linear equations.
Heresy: Linear models cannot capture market complexity.
Time in Markets Is Variable
Traditional View: Time in markets flows at a constant rate, making it possible to analyze data at fixed intervals.
Mandelbrot’s View: Market time is irregular and subjective, accelerating during high activity (volatility clusters) and slowing during calm periods.
Heresy: Time is not constant in financial analysis.
Prices Do Not Follow Random Walks
Traditional View: Prices move randomly and independently, forming a normal distribution.
Mandelbrot’s View: Prices are influenced by patterns, memory, and clustering, resulting in heavy-tailed distributions.
Heresy: Random walk theory oversimplifies market dynamics.
Markets Are Non-Efficient
Traditional View: The Efficient Market Hypothesis (EMH) suggests that all available information is reflected in prices, leaving no room for inefficiencies.
Mandelbrot’s View: Markets are often irrational and exhibit inefficiencies driven by emotions, memory, and fractal structures.
Heresy: Perfect market efficiency is an illusion.
Risk Is Not Symmetrical
Traditional View: Risk is modeled symmetrically, assuming equal likelihood of positive and negative deviations.
Mandelbrot’s View: Downside risks are more extreme and frequent, leading to asymmetry in market behavior.
Heresy: Risk models that assume symmetry are dangerously flawed.
Models Need to Embrace Chaos
Traditional View: Financial models aim for order and predictability, relying on simplified assumptions.
Mandelbrot’s View: Markets are chaotic and unpredictable but exhibit fractal structures that can provide insights.
Heresy: Chaos should be embraced, not ignored, in modeling markets.
Forecasting Is Fundamentally Limited
Traditional View: With enough data and sophisticated models, market behavior can be forecasted with high accuracy.
Mandelbrot’s View: Forecasting is inherently uncertain due to the wild randomness and complex nature of markets.
Heresy: Precise prediction of market movements is a fool’s errand.
Mandelbrot's ideas answered why markets behave the way they do, rather than relying on surface-level analysis. It was definitely more convincing than any traditional TA material that had not much information on cause-effect mechanisms that reveal the deeper structural relationship within price movements.
Fortunately, long before becoming acquainted with Mandelbrot’s take on markets, I had already developed my own perspective, thanks to the experiments I conducted right here on TradingView years back. My work perfectly aligned with his vision that acknowledges complexity, extreme events, irregularities and the interconnectedness of historic data.
Concept of Relativity
I got another inspiration from reading a story about the most pivotal breakthroughs in Albert Einstein’s intellectual journey, leading directly to his formulation of the theory of relativity that later on forever changed the world. His thought experiment revealed the strange and counterintuitive nature of time when viewed from different frames of reference.
As Einstein imagined himself racing alongside a beam of light, he realized that from his perspective on the bus, as it was moving away from clocktower, the clock would appear frozen because the light carrying the image of the clock’s moving hands would no longer reach him. This insight, combined with his deep understanding of the constancy of the speed of light, led him to question the absolute nature of time and space.
The culmination of this “storm” in his mind was the realization that time is not universal; it is relative to the observer’s motion. This revolutionary idea, published in his 1905 paper on special relativity, fundamentally changed our understanding of the universe, introducing concepts like time dilation and the interdependence of time and space—a unified spacetime .
Einstein’s ability to visualize such extraordinary scenarios highlights the power of thought experiments in scientific discovery. It was not only the mathematics but also his imagination that allowed him to redefine our understanding of reality.
PriceTime Model via Fibonacci Channels
After being able to visualize and somehow digest the complexity behind mathematical model of relativity, I returned to Mandelbrot's book to read more about his stance on time itself.
"Price is a function of trading time, which in turn is a function of clock time" - B. Mandelbrot
I mean who am I to disagree with a professor... Moreover, it really begins to look like Price and Time are connected similarly to the concept of SpaceTime.
Given that the psychology of the masses is inherently sensitive to the golden ratio, I was inspired to create a unified graphical framework that interconnects price dynamics, enabling navigation through the complexities of ever-evolving financial markets. By directly measuring trend angles within significant cycles, I realized that the chart’s complexity could essentially simulate itself. I incorporate psychological levels (via Fibonacci ratios) into my analysis, acknowledging how emotions shape market behavior. By embedding these emotional drivers into fractal structures, I align with Mandelbrot’s understanding of the market as a blend of human psychology and mathematical order.
This led to the discovery that Fibonacci ratios influence not only the price axis but also the time axis, unveiling a deeper fractal harmony in market behavior. The way mass (or energy) curves the spacetime fabric to explain the behavior of objects in physics is strikingly similar to how historic price movements (a manifestation of energy) shape the pricetime fabric, revealing the fractal cyclicality inherent in financial markets.
My work builds on Mandelbrot’s groundbreaking theories by turning his insights into practical tools. By combining his principles of self-similarity, chaos, and complexity with innovations like Fibonacci-based fractal mapping and trend directionality, I offer a fresh perspective on market behavior. This approach personally helps me to navigate the complexity of financial markets, staying true to Mandelbrot’s legacy while pushing the boundaries of fractal analysis.
My motivation for staying on TradingView and analyzing charts transcended being money-driven. I could no longer see markets the same way. I broke free from the rat race and devoted my life to studying charts as a reflection of reality, aiming to uncover the intrinsic rhythm that truly drives price fluctuations.
That realization inspired me to prioritize structure-based prediction over blind forecasts driven by subjective narratives, which are often flawed at their core. Sadly, great minds like Benoit Mandelbrot are no longer with us, but it is our responsibility as TradingView users to carry forward their work, treating it as our own mission to honor their legacy.
The bottom line is that we should not confine ourselves to the literature of Technical or Fundamental Analysis alone. Instead, we must draw insights from any field, using diverse methods and approaches, to develop a robust probabilistic framework for anticipating future price movements.

BTCUSDT LONG SCALPING BTCUSDT LONG SCALPING
BUY ABOVE 97100
Target 1: 97350
Target 2: 97600
SL: 96830

$BTC Huge Daily Close Above the .618 Fib !Very BIG Daily Close for ₿itcoin above the .618 Fib 🥵
CRYPTOCAP:BTC needs to close the next week in or above the green box demand area in order to keep the rally alive and flip resistance into support.
As I originally mentioned in my idea, PA either needs to correct accordingly or this is the long-awaited PARABOLA in the making.
I still stand with my original belief on how this will play out, and have numbered my ideas accordingly.
1. Correct to 200DMA
2. Correct to 50DMA
3. Inverse Head and Shoulders reversal pattern
4. PARABOLA 🚀
I hope it's time to MOON more than anyone!
but I still have a good chunk of cash on the sideline in case the market needs more time 🤓


Highlighted in green between approximately $96,500 and $97,050.a 1-hour chart of Bitcoin (BTC/USD) on the BITSTAMP exchange. Here’s a breakdown of the chart:
Current Price: Around $96,479.
Sell Zone: Highlighted in green between approximately $96,500 and $97,050. This is likely a resistance zone where the trader expects selling pressure.
Red Zone Below: Represents the expected price drop area, indicating a bearish outlook.
Price Action: The chart shows a sharp move up into the Sell Zone, followed by a small pullback, and then a projected drop.
Target Zone: Around $93,242, with an extended potential drop to $91,572, indicated by the arrow.
Support Zone: The yellow rectangle near $93,200 is a key support area where price might stabilize or bounce.
This chart suggests a short (sell) trade setup, anticipating a reversal from the current high back toward support levels.

BITCOIN Will Keep Growing! Buy!
Hello,Traders!
BITCOIN is trading in an
Uptrend an the coin made
A bullish breakout of the
Key horizontal level of 94k$
Which is now a support and
Is now going up again so we
Are bullish biased and we will
Be expecting a further
Bullish continuation
Buy!
Comment and subscribe to help us grow!
Check out other forecasts below too!
Disclosure: I am part of Trade Nation's Influencer program and receive a monthly fee for using their TradingView charts in my analysis.

SELL BTCUSD for bullish trend reversal STOP LOSS : 97,861SELL BTCUSD for bullish trend reversal
STOP LOSS : 97,861

btc fibonacci levels Trade Strategy
Long to May 4 High:
Entry: If BTC breaks above $94,310 (Square of Nine 90°) with a green candle, enter long.
Target: $96,472 (Square of Nine 720°), aligns with your $95,976.36.
Stop-Loss: Below $92,781 (Square of Nine -360°), risking ~$1,500.
Time: Exit by May 4 (50-day cycle).
Short for May 14 Dip:
Entry: If BTC reaches $96,472 and shows rejection, enter short.
Target: $91,567 (Square of Nine -720°).
Stop-Loss: Above $96,472, risking ~$1,000.
Time: Expect the dip by May 14 (60-day cycle).

+0.42% Gain: BTC/USD April 28th Trading Plan Success📈 BTC Trade Recap (Apr 28): Bullish breakout plan hit!
✅ Long entry @ $95,050 -> Take Profit 1 = $95,450 = +0.42% profit.
🐻 Short setup didn't trigger
💰 +0.42% profit.
You can find the trading plan in the 'Related publications' section in the lower right corner.

Time to Buy BITCOIN?I hope you guys enjoyed the video; feel free to comment down below any questions you might have.

BTCUSD: The catching up to Gold has started.Bitcoin is having an excellent day turning almost overbought on its 1D technical outlook (RSI = 69.867, MACD = 3107.700, ADX = 41.327) and that is normally a signal for more upside to come. Adding Gold to the mix, we see that in recent past when Gold topped, Bitcoin was at the start of its uptrend and eventually caught up to Gold. Today's rise is probably similar to early November 2024, so we expect another 1.5 - 2 month upside before the next short term pullback.
## If you like our free content follow our profile to get more daily ideas. ##
## Comments and likes are greatly appreciated. ##

I might be Wrong in my previous ForecastBTC may be still in correction stage and one more fall is very possible, secure your buy poitioms
new buy zone is @ 92.000
Bullish on BTCUSDAscending channel combined with continuation pattern with market structure [impulse correction impulse.
SMA LINE STRATEGY WORKS WELLIn my first idea I was based on the 1H 100SMA line and I saw the price works very good with this line. If price come closer to the line with low volume there is a big chance for the price to bounce from it depends if we are above or below the line, but if the price come closer to the line with big volume there is also a chance for the price to crash that line and change trend. Very important in this strategy is also a HTF analysis because it can say us a little bit more than 1H chart. For now I expect for the price to come higher and take some liquidity from up but if this little run will be burnout we can see a big probability to come back to this SMA line and I will look and wait for this moment and if I will see the chance for that move I will publish it here so wait for the next BTC update.

Can BTCUSD continue to be purchased? The answer is definitely.Can BTCUSD continue to be purchased? The answer is definitely.
The current trend is a rebound trend after a volatile decline. The space for a short-term increase of 1,500 points is very simple. The target position is 94,700-95,200. Friends who like to do short-term swing trading can follow.

BTC usd no sign of a topI'm not a big fan of trend lines. This chart uses Bollinger bands, ICHMOKU cloud, Candles and it is a bit crowded with things I am not paying much attention to. For now its above the Bollinger bands, above the cloud and has nice big green candles. No sign of a top yet

BITCOIN is filling all gaps as it should.Bitcoin (BTCUSD) is having its strongest 1D green candle since April 22 (for now) and basically today's analysis is a continuation/ modification of our April 14 buy call (see chart below):
Our Target was $99500 but we now update it to $106000 as we see a different pattern through filling the Lower Highs gaps. As you can see, since BTC's April 07 bottom, the rebound has filled one Lower High of the downtrend after the other.
At the same time, it has posted identical rallies before consolidating, the 1st one +15.37% and the 2nd +15.11%. We are currently on the 3d and if it makes again +15.11%, then it gets us to $106.9k. That is marginally above the Lower High of January 30, practically the first Lower High after the January 20 All Time High (ATH).
Moreover, the 2.0 Fibonacci extension level is at $106k and this is why we've moved our short-term Target there. This fills all dynamic conditions of this uptrend.
Do you think that's a fair estimate? Feel free to let us know in the comments section below!
-------------------------------------------------------------------------------
** Please LIKE 👍, FOLLOW ✅, SHARE 🙌 and COMMENT ✍ if you enjoy this idea! Also share your ideas and charts in the comments section below! This is best way to keep it relevant, support us, keep the content here free and allow the idea to reach as many people as possible. **
-------------------------------------------------------------------------------
💸💸💸💸💸💸
👇 👇 👇 👇 👇 👇

BitcoinGreen line represents mid-point and the respective upside and downside levels for the study purpose.

BITCOIN | 30M | IMPORTANT SUPPORT ZONE Hello, my friends,
Yesterday, I shared a Bitcoin analysis and stated that my target level is 97,300.
At the moment, we are within the blue support zone I highlighted in my analysis yesterday. Although this is not a very strong support zone, I am expecting an upward movement from here. However, the most critical support level lies between 92,000 and 91,000.
As I mentioned yesterday, as long as the price does not drop below the 92,000 - 91,000 levels, my target remains at 97,300.
Please don't forget to like.
Thank you to everyone who supports with likes.
