Bitcoin Rally Fades as Prices Nosedive. End of Bullish Cycle?Technical analysis will tell you that maybe it’s time for a pullback. But then again, this is crypto. It’s the wild west, where predictions are polite suggestions at best. Here’s what we know about where we are.
📉 Bitcoin Takes a Breather
Bitcoin BITSTAMP:BTCUSD started the week on a quieter n
Key facts today
Key stats
About Bitcoin
Bitcoin is the world’s most traded cryptocurrency, and represents the largest piece of the crypto market pie. It was the first digital coin and as such, remains the most famous and widely-adopted cryptocurrency in the world. It's the original gangster in whose footsteps all other coins follow. The birth of Bitcoin was the genesis of an entirely new asset class, and a huge step away from traditional, centrally controlled money. Today, many advocates believe Bitcoin will facilitate the next stage for the global financial system, although this — of course — remains to be seen.
Related pairs

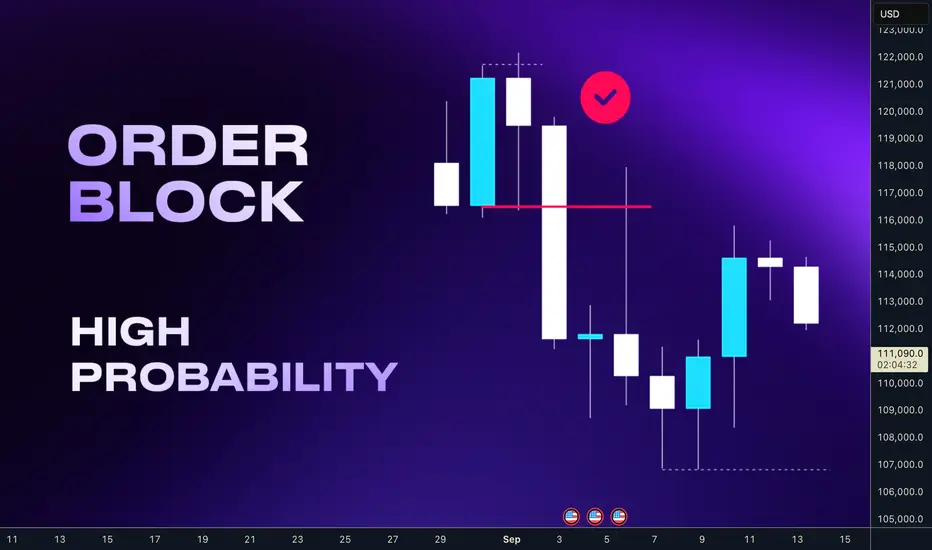
Order Block - Powerful Key level and Entry confirmationHey whats up guys,
Today we are going to break down Order Block. This powerful pattern can be used as the level and also as the lower timeframe entry confirmation. We will break down both.
An Order block is the last bullish or bearish candle before a strong market move that signals where institut
BTC Cycle Analysis: The Script Is WrittenYo, listen up. My first time posting here, so try to keep up.
I've been going down the rabbit hole with some old-school Bitcoin cycle analysis, and while everyone's still busy yelling "bullish" on Twitter, I'm just here to tell you what the charts are saying.
This stuff is like clockwork. We're ta

Bitcoin: Sell Signal Points To 106K AREA.Bitcoin has rejected the 113K as a resistance with a clear bearish pin bar close. The low of that pin bar has been broken which qualifies as a sell signal on the daily time frame. 113K was previously a key support, and now a resistance which further adds to the broader corrective argument that I hav

BTC/USD (Bitcoin vs USD).BTC/USD (Bitcoin vs USD)
Timeframe: 2-hour (2H)
Indicators: Ichimoku Cloud, Trendline, Support/Resistance zones
---
📊 Indicators Used
1. Ichimoku Cloud
Price recently broke above the descending trendline and is pushing into the cloud.
If it sustains above the cloud, that signals a potential t

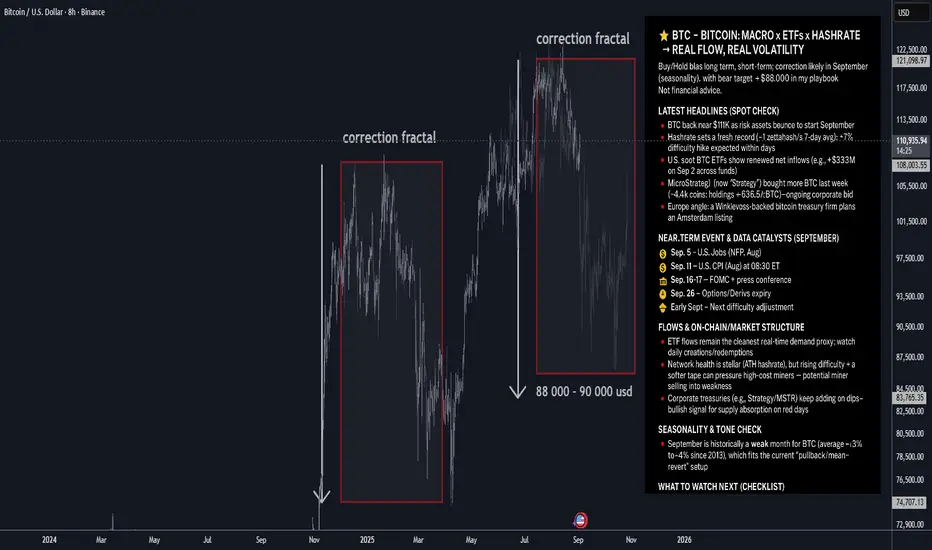
BTC — Bitcoin: Macro x ETFs x Hashrate → Real Flow, Real Volatil⭐️ BTC — Bitcoin: Macro x ETFs x Hashrate → Real Flow, Real Volatility
Buy/Hold bias long term; short-term: correction likely in September (seasonality), with bear target ≈ $88,000 in my playbook.
🔥 Latest headlines (spot check)
🔸BTC back near $111K as risk assets bounce to start September.
🔸H
Bitcoin (BTCUSD) –> Retest Before the Next Drop?Hello guys!
After a strong run inside the ascending channel, Bitcoin has finally broken its trendline support. This is often the first warning that momentum is shifting from bullish to bearish.
Right now, price action is pulling back and looks ready to retest the broken trendline around the 111,300

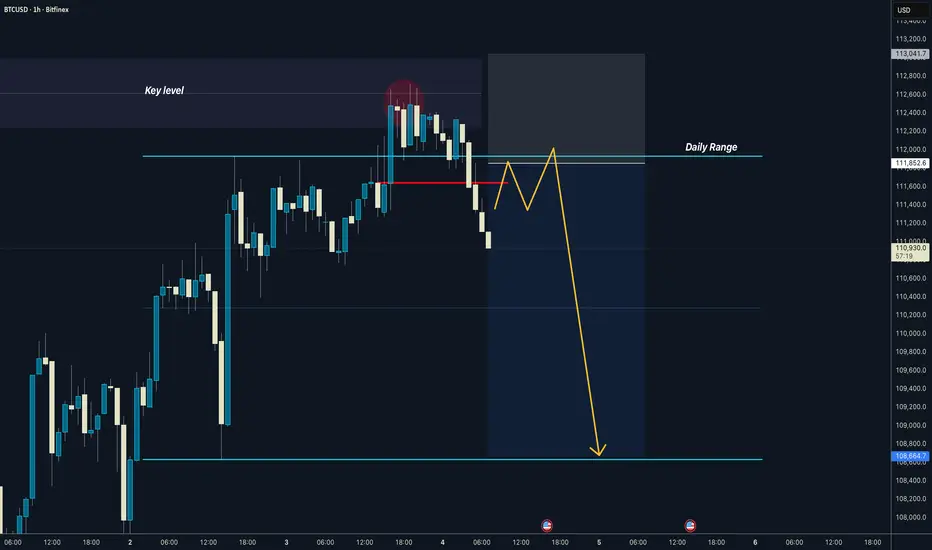
BITCOIN On the Key level - Range manipulated...
Price is on the IFVG key level
range manipulated.
CIOF created
I got short and will add on the range retest
The reason most traders aren't consistent is that they want to trade everyday and get impatient if there isn't a setup present.
Consider this: you're denying yourself the chance
BTCUSD: Price Drop to Support line of WedgeHello everyone, here is my breakdown of the current Bitcoin setup.
Market Analysis
From a broader perspective, the price action for Bitcoin has been bearish since the rejection from the Resistance Zone near the 122000 level. This initiated a downtrend that has since evolved from a channel into

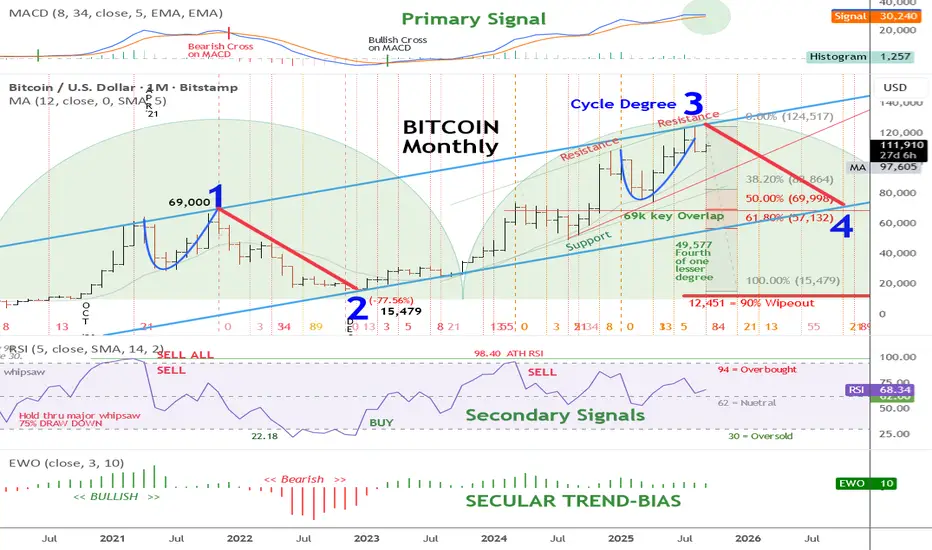
Has Bitcoin Reached It's Four-Year Cycle Top?Why Bitcoin Might Have Reached Its Four-Year Cycle Top
Historical Pattern: Bitcoin's four-year cycle often peaks around halving events, influencing supply and price dynamics.
MACD Signal: The primary signal indicator in the upper panel remains in a bullish position, with no bearish cross, indi
See all ideas
Displays a symbol's price movements over previous years to identify recurring trends.
Curated watchlists where BTCUSD is featured.

Gen 1 crypto: from little acorns grow
15 No. of Symbols

Proof of Work: Embracing the crunch
27 No. of Symbols
See all sparks
Discover funds exposed to Bitcoin and find another way to access the coin.
Frequently Asked Questions
Bitcoin (BTC) reached its highest price on Aug 14, 2025 — it amounted to 124,560.68 USD. Find more insights on the BTC price chart.
See the list of crypto gainers and choose what best fits your strategy.
See the list of crypto gainers and choose what best fits your strategy.
Bitcoin (BTC) reached the lowest price of 961.30 USD on Mar 26, 2017. View more Bitcoin dynamics on the price chart.
See the list of crypto losers to find unexpected opportunities.
See the list of crypto losers to find unexpected opportunities.
The safest choice when buying BTC is to go to a well-known crypto exchange. Some of the popular names are Binance, Coinbase, Kraken. But you'll have to find a reliable broker and create an account first. You can trade BTC right from TradingView charts — just choose a broker and connect to your account.
You can discuss Bitcoin (BTC) with other users in our public chats, Minds or in the comments to Ideas.