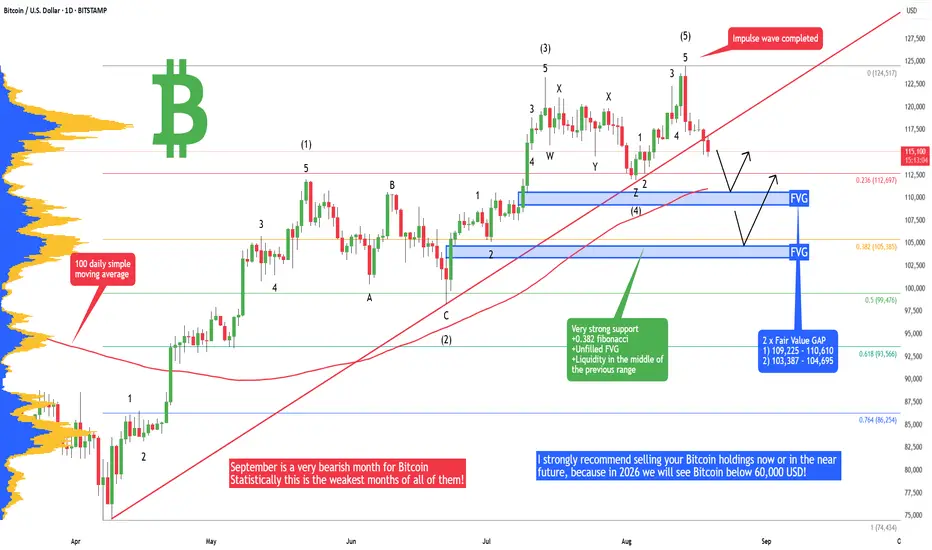
Bitcoin - Avoid BTC at all cost! What is coming will blow you.I strongly recommend selling your Bitcoin holdings now or in the near future, because in 2026 we will see Bitcoin below 60,000 USD! I will tell you why in this analysis.
But first let's look at the local price action on the daily chart and what is going to happen with Bitcoin in the short term. I expect Bitcoin to fall to 110,600 in the immediate short term; this is my first profit target for the intraday position. Why is 110,600 a strong support? We have the first FVG on the daily chart that has never been tested, and also we have a 100-day moving average. This is a pretty good support for intraday trades.
Later in September we will probably see Bitcoin at 104,800. Why is 104,800 a strong support? We have to look at the previous price action from May to July, because we have a range/bull flag, and there is also an unfilled FVG. The previous major swing low of 105,130 is something where people put a lot of stop losses below it. That's a magnet for whales; they probably want to buy here. Also, there is the 0.382 Fibonacci retracement level of the previous impulse wave.
Why is Bitcoin so bearish now? Well, we have completed an impulse wave 12345, and also the red trendline is breaking down! That's in general a bearish price action. Early in the article I was talking about 60k BTC - for this, you need to look at my previous analysis to understand the full picture.
Write a comment with your altcoin + hit the like button, and I will make an analysis for you in response. Trading is not hard if you have a good coach! This is not a trade setup, as there is no stop-loss or profit target. I share my trades privately. Thank you, and I wish you successful trades!
BTCUSD trade ideas
Bitcoin Daily Analysis – The Trend Is Our FriendGood morning, Guys,
I’ve prepared a fresh Bitcoin analysis for you.
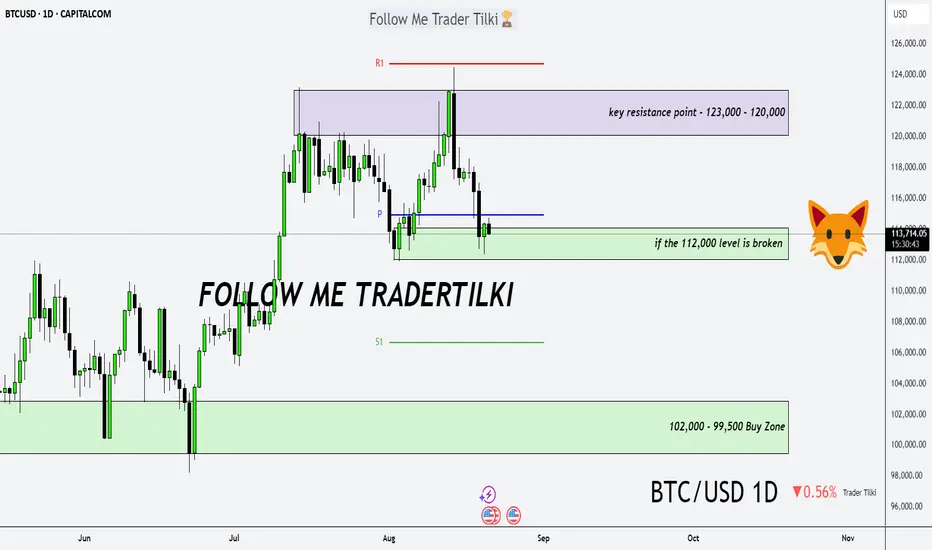
🔹 First off, I stand firmly behind my long-term targets of **127,000 – 137,000 – 146,000**. I previously shared these levels with you in a weekly analysis.
🔍 Now let’s shift to the 1-day chart:
What is Bitcoin telling us right now?
📉 If the **112,000 level breaks downward**, we could enter a correction phase toward **102,000** or even **99,500**. I expect strong buying interest to return from those zones.
📈 After that, we’re facing a key resistance structure between **123,000 – 120,000**.
But I believe this zone will also be broken—because we’re in an **uptrend**, and…
💬 **The trend is our friend. Never forget that.**
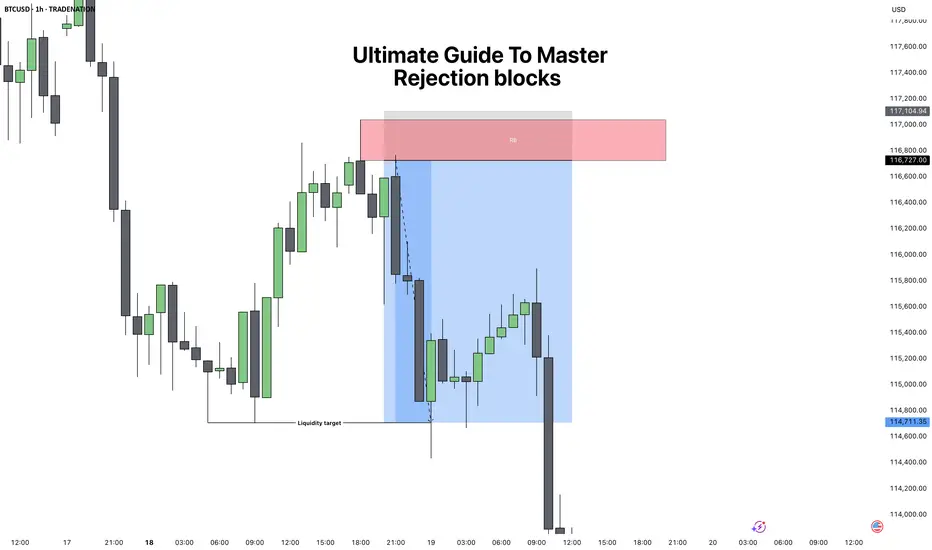
Ultimate Guide to Master: Rejection BlocksRejection Blocks (ICT Concept) – Complete Guide
1. What is a Rejection Block?
A rejection block is a special type of price level that forms when the market attempts to push through but gets denied and reverses. Unlike a traditional order block, which represents accumulation or distribution by institutions, a rejection block shows a failed attempt to continue in one direction. It is a footprint of rejection and often becomes a strong reaction zone in the future.
There are two types:
Bullish Rejection Block:
Forms from a bearish candle whose low is taken out, but price fails to continue lower and closes back above. The low of that candle becomes the key level.
Bearish Rejection Block:
Forms from a bullish candle whose high is breached, but price fails to continue higher and closes back inside. The high of that candle becomes the key level.
These levels can act as hidden support or resistance and often serve as high-probability entry points when combined with market structure.
2. How to Spot a Valid Rejection Block
To correctly identify rejection blocks, you need to look for:
1. Clear Attempt Beyond a Candle
Price must trade beyond the high or low of a prior candle, suggesting continuation.
2. Failure and Return
After breaching the level, price fails and closes back inside the candle’s body.
3. Liquidity Context
A rejection block is more powerful if the wick that caused it swept liquidity (equal highs/lows or a previous key level).
4. Higher Timeframe Confluence
The best rejection blocks line up with higher timeframe bias (for example, spotting a bearish rejection block inside a 4H premium zone during a downtrend).
3. How to Trade Rejection Blocks
Trading them involves waiting for price to come back to the rejection block level and using it as an entry or reaction zone.
Bullish Setup:
When price trades below a bearish candle, fails, and closes higher, mark the low of that candle. On a retracement, price often retests that level as support.
Bearish Setup:
When price trades above a bullish candle, fails, and closes lower, mark the high of that candle. On a retracement, price often retests that level as resistance.
Entry Technique:
You can enter "blindly" when you're understanding the confluences. But to begin with do this Instead, when price returns to the rejection block, drop to a lower timeframe and look for confirmation such as:
* Fair Value Gap (FVG) entries.
* Market Structure Shift (MSS).
* Liquidity sweeps into the level.
Stop Loss Placement:
Always place stops beyond the rejection candle itself (above the high for bearish RB, below the low for bullish RB).
4. Practical Examples and Market Context
Rejection blocks work best when they appear in the following situations:
Liquidity Sweeps:
After equal highs or equal lows are taken out, a rejection block often marks the failure point.
Inside Premium/Discount Zones:
In a bearish bias, look for bearish RBs in premium pricing. In a bullish bias, look for bullish RBs in discount pricing.
During Consolidation Breakouts:
If the market fakes a breakout and closes back inside, the rejection block often becomes the level to fade the fake move.
For example, if BTC takes out a prior daily high, prints a rejection block, and then closes back inside, the odds of reversal are high, especially if price was already in premium territory.
5. Combining Rejection Blocks with ICT Concepts
To increase accuracy, always combine RBs with ICT’s other tools:
Fair Value Gaps:
If a rejection block aligns with an FVG, it adds strength to the level.
Market Structure Shifts:
A rejection block is more powerful if followed by displacement and an MSS.
CISD Pattern:
A rejection block often forms right after the “Stop Hunt” part of the CISD sequence, serving as a clean entry.
Liquidity Pools:
Look for RBs near equal highs/lows, old highs/lows, or session liquidity (London/New York).
Conclusion
Rejection blocks are subtle but highly effective levels that show where the market tried to extend but failed, leaving behind a hidden form of support or resistance. By themselves they are useful, but when combined with ICT concepts like liquidity sweeps, MSS, and FVGs, they become powerful entry tools. The key is to always wait for price to return and confirm the level before entering, and to only trade them in alignment with higher timeframe bias.
Disclosure: I am part of Trade Nation's Influencer program and receive a monthly fee for using their TradingView charts in my analysis.
___________________________________
Thanks for your support!
If you found this idea helpful or learned something new, drop a like 👍 and leave a comment, I’d love to hear your thoughts! 🚀
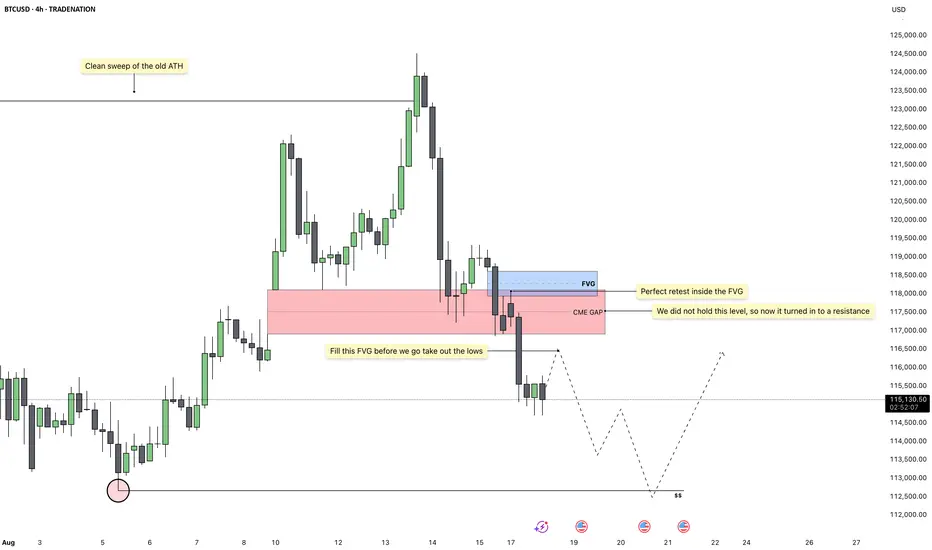
Bitcoin - Bears in Control, Lows AheadBitcoin has recently completed a clean sweep of the previous all time high, which has now given us strong bearish confirmation signals. After the sweep, the market rejected higher levels and failed to sustain bullish momentum, showing clear signs of distribution at the top. This shift in behavior suggests that buyers have lost control and sellers are now taking over.
Fair Value Gap Setup
Currently, price is sitting just below a fair value gap, which remains unfilled. These imbalances often attract price back before continuing in the prevailing direction, and in this case, that direction is down. A small retracement into the fair value gap above would be the ideal setup for a continuation lower.
Bearish Confirmation
The rejection after sweeping the highs and the subsequent breakdown beneath key support levels has created a bearish structure on the higher timeframe. The failed hold inside the fair value gap turned it into resistance, strengthening the case for lower prices. Each retest has been met with selling pressure, confirming that liquidity is now being delivered to the downside.
Liquidity Targets
Once the fair value gap above is filled, the next logical draw on liquidity sits below the current range. That means the lows are now exposed, and the cleanest target to expect price to reach is at 112k. The path of least resistance remains to the downside, as uncollected sell-side liquidity continues to build up beneath the market.
Trading Outlook
As long as Bitcoin continues to respect the newly formed resistance from the fair value gap, the bearish outlook remains intact. A retracement into the gap would likely offer the best entry for shorts, with the expectation that price will then seek out the lows. Only a convincing reclaim above the imbalance would threaten this bearish scenario.
Conclusion
The clean sweep of the old all time high has shifted market sentiment, and the subsequent bearish confirmations support the idea that the next major move is lower. I expect a slight retrace into the fair value gap before price makes its way down to the 112k liquidity pool.
Disclosure: I am part of Trade Nation's Influencer program and receive a monthly fee for using their TradingView charts in my analysis.
___________________________________
Thanks for your support!
If you found this idea helpful or learned something new, drop a like 👍 and leave a comment, I’d love to hear your thoughts! 🚀
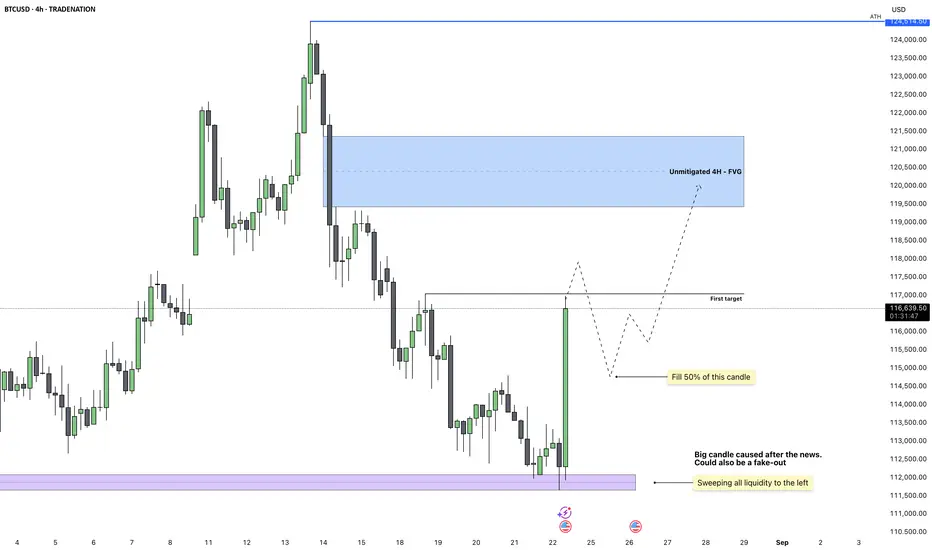
Bitcoin - A Deep Sweep Setting Up the Next ExpansionBitcoin just swept the monthly low of August as well as the previous day’s low. This was a clear liquidity grab that lined up with today’s bullish momentum in the market. The strong reaction from this zone shows that buyers were waiting for these liquidity levels to get cleared before stepping in.
Liquidity Sweep and Reaction
The sweep was significant because it cleared out resting sell-side liquidity to the left. This kind of move usually sets the stage for a reversal, and the large impulse candle confirms strong demand stepping in. While some might see this as just a reaction to external events, the technical picture supports continuation higher.
Immediate Target
The first target is sitting around 117,000. This level lines up with short-term inefficiencies and is a logical magnet for price in the coming sessions. I expect this liquidity pool to be swept before any meaningful retracement.
Retracement Expectation
After hitting the first target, I anticipate a move back down to fill around 50% of the large green impulse candle. Big candles like this often retrace partially before continuing their main direction. That retracement will provide a cleaner structure and a chance for re-entries on lower timeframes.
Higher-Timeframe Objective
Once the retracement plays out, the bigger objective sits higher at the unmitigated 4H fair value gap around 120,500. This area remains untouched and is likely to act as a price magnet as the market seeks balance.
Conclusion
The sweep of key lows combined with the strong impulsive move is a bullish development. I expect price to first tag 117,000, then retrace into the large candle before resuming higher towards the 4H FVG.
Disclosure: I am part of Trade Nation's Influencer program and receive a monthly fee for using their TradingView charts in my analysis.
___________________________________
Thanks for your support!
If you found this idea helpful or learned something new, drop a like 👍 and leave a comment, I’d love to hear your thoughts! 🚀
Bitcoin - Can the bulls defend this support?Introduction
After reaching its all-time high, Bitcoin has faced strong rejection, falling from $124.5k down to $113k with notable bearish volume behind the move. On this downward path, several four-hour bearish Fair Value Gaps (FVGs) were left open, signaling areas of inefficiency that the market may look to revisit. At present, Bitcoin is testing a critical support zone formed by overlapping daily and four-hour FVGs. This support level is of particular importance because holding it could provide the foundation for renewed bullish momentum and a potential recovery in price action.
Bullish scenario
For the bullish case to unfold, Bitcoin must successfully maintain support in the $111.2k to $112.7k range, which represents the current four-hour FVG. This zone serves as a pivotal point where buyers need to defend price in order to keep upward potential intact. If the market stabilizes here, the next logical target will be the four-hour bearish FVG just above. In order to confirm strength, Bitcoin would need to close a clear four-hour candle above this resistance, effectively flipping it into support. Should that occur, it opens the door for price to climb toward the $120k region, a level that would reintroduce confidence among bulls and suggest that the broader trend could still have room for continuation.
Bearish scenario
On the other hand, the bearish scenario becomes more likely if Bitcoin fails to defend the $111.2k to $112.7k four-hour FVG and instead flips this zone into resistance. While a breakdown below this area would be concerning, there is still the possibility of a short-term bounce. In such a case, price could retrace back upward toward the bearish four-hour FVG at $114.7k before facing another critical test. If Bitcoin rejects strongly from that zone and subsequently breaks below $111.2k, the market could experience further downside pressure, potentially setting up a deeper correction. This would reinforce the dominance of the ongoing downtrend that has followed the rejection at the all-time high.
Final thoughts
Bitcoin remains in a pronounced downtrend after its sweep of the previous all-time high, yet it currently sits at a strong support level that offers a chance for recovery. The market’s reaction to this support area will play a decisive role in determining whether a rebound toward $120k is achievable or whether a deeper decline is imminent. The four-hour FVG around $114.7k stands out as a key battleground between bulls and bears. If buyers can reclaim and hold this level, momentum could shift back in their favor, but if sellers defend it and force price lower, the bearish trend is likely to persist.
-------------------------
Disclosure: I am part of Trade Nation's Influencer program and receive a monthly fee for using their TradingView charts in my analysis.
Thanks for your support. If you enjoyed this analysis, make sure to follow me so you don't miss the next one. And if you found it helpful, feel free to drop a like 👍 and leave a comment 💬, I’d love to hear your thoughts!

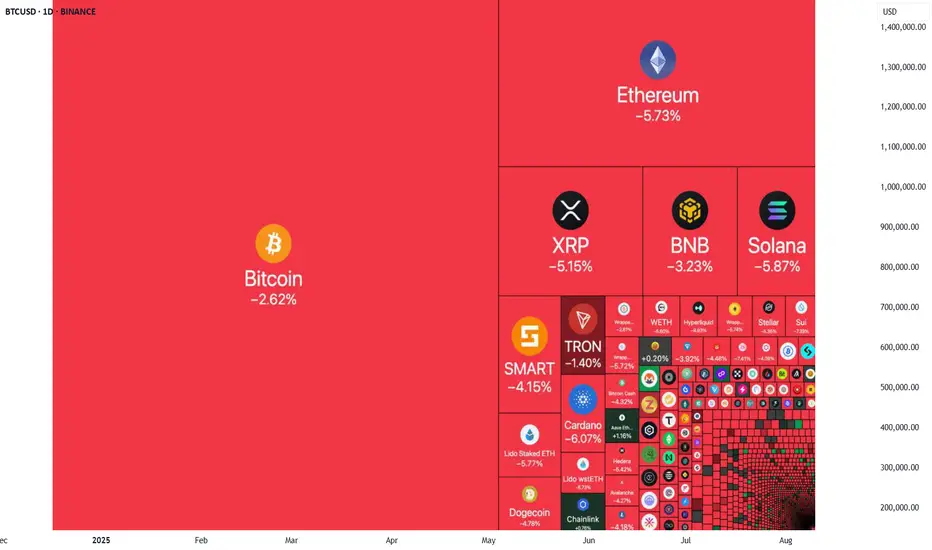
Why Is Crypto Tumbling? A Trader's Guide to the Recent Sell-OffWhy Is Crypto Tumbling? A Trader's Guide to the Recent Sell-Off 📉
🚨 If you're watching the markets today, you've seen the sea of red. Bitcoin, Ethereum, and major altcoins have experienced a significant pullback, leaving many to wonder about the cause.
While sharp drops can be unsettling, for the strategic trader, they are critical moments to analyze, not to panic. The current downturn isn't random; it's driven by a convergence of clear geopolitical, technical, and macroeconomic factors.
Here’s a breakdown of what’s happening behind the charts:
1. Geopolitical Uncertainty 🌐
High-stakes diplomatic meetings are underway involving the US, EU, and Ukrainian leaders to discuss the Russia-Ukraine peace deal. Markets inherently dislike uncertainty. As traders await a clear outcome, many are de-risking their portfolios, leading to selling pressure on assets like cryptocurrencies.
2. A Healthy Market Reset 📊
The crypto market just came off a powerful rally where many assets saw gains of 50-100%. This rapid rise led to a buildup of high-leverage positions. Today's dip is forcing a "leverage flush," liquidating over-extended traders. While painful for some, this is a standard market mechanism that washes out speculative excess and often creates a more stable foundation for future growth.
3. Shifting Macroeconomic Tides 📉
Just a week ago, a September interest rate cut was seen as a certainty. Now, recent economic data has slightly lowered those odds. Financial markets, including crypto, are incredibly sensitive to central bank policy. The market is now pricing in this small but significant shift in expectations, contributing to the downward pressure.
The Trader's Perspective: Opportunity in Volatility 💡
So, what does this all mean? It underscores a core principle of successful trading: volatility has a source.
For the prepared trader, this isn't a signal to abandon ship. It's a signal to consult your strategy. This is precisely the kind of environment where a clear, data-driven forecast becomes invaluable.
By understanding the root causes of the sell-off, you can better anticipate market structure, manage risk, and identify potential zones of support where "smart money" may begin to re-accumulate.
This is where the difference between a professional and a novice trader becomes clear. Experienced traders welcome every correction or pullback in the market, seeing it as an opportunity to re-enter and profit from the next upward wave. 📈
Therefore, instead of worry and stress, shift your focus to finding key reversal points and defining new entry zones (Watchboxes) for future trades at more attractive prices. View this price correction as a strategic opportunity, not a threat. 🚀
What are your thoughts on this pullback? Are you seeing it as a risk or an opportunity? Let's discuss in the comments. 👇
Trade Smart!
Navid Jafarian
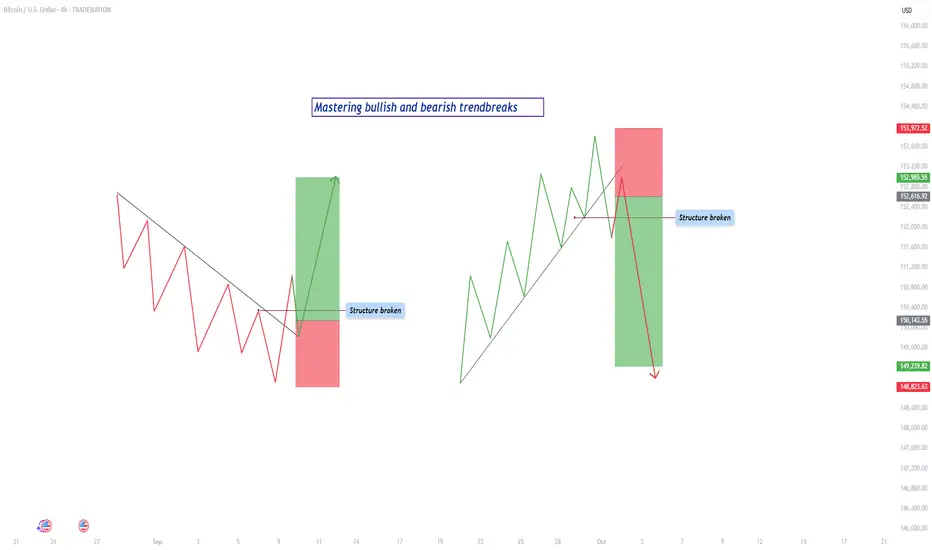
Mastering trendbreaks - How to trade it?In this guide will the trendbreaks be discussed. The following subjects will be explained:
- What is a trend?
- What is a bearish trendline break?
- What is a bullish trendline break?
- How to trade a trendbreak?
- Example
What is a trend?
A trend is the backbone of price action in any market. It represents the general direction in which price is moving over a sustained period of time. When price is consistently creating higher highs and higher lows, the market is considered to be in an uptrend. This behavior shows that buyers are in control and are willing to keep paying higher prices with each wave. On the other hand, when price continues to make lower highs and lower lows, the market is in a downtrend. This shows that sellers dominate the market and buyers are unable to push price above previous levels. Understanding trends is essential because it gives traders a framework for anticipating what is most likely to happen next, rather than guessing in random price action.
What is a bearish trendline break?
A bearish trendline break takes place when an established uptrend begins to lose momentum. In an uptrend, price usually respects a rising trendline, bouncing off it multiple times as buyers defend the bullish structure. Eventually, there comes a point when the market can no longer sustain this strength. Price breaks down through the rising trendline, signaling potential weakness. However, the true confirmation of a bearish shift only happens once the market also breaks below the most recent higher low. This is the key moment where structure changes. What was once a sequence of higher highs and higher lows now transforms into lower highs and lower lows, showing that sellers are gaining control. Without this structural shift, the break of the trendline alone might just be a temporary pullback or a false signal.
What is a bullish trendline break?
A bullish trendline break is the mirror image. In a downtrend, price respects a falling trendline as it consistently makes lower highs and lower lows. Each rally upward fails to break past previous highs, confirming sellers’ control. Eventually, price surges and breaks above the falling trendline. Just like with a bearish break, this initial move is not enough on its own. The true sign of reversal comes when price also breaks above the most recent lower high. This action destroys the existing bearish structure, which relied on lower highs to remain valid. Once that lower high is broken, the market shows that buyers have taken back control and a potential uptrend may begin.
How to trade a trendbreak?
For a valid trendbreak, three conditions must come together. First, the price must break the trendline itself, either rising or falling depending on the direction of the trend. Secondly, the breakout needs to be with strong volume. lastly, the price must also break the most recent higher low in an uptrend or lower high in a downtrend. Without this structural break, what looks like a reversal may only be a correction before the market resumes in its original direction. This distinction is crucial because many traders enter too early on a simple trendline break, only to get caught when the market snaps back into the trend. The combination of both the trendline break and the structural break provides much stronger confirmation.
Trading the trendbreak is where discipline and patience make the difference between success and failure. When the structure has been broken, it is tempting to enter immediately in the direction of the new move. But the higher-probability entry usually comes from waiting. Price often pulls back after a break, returning to retest the broken level. This retest can take different forms. Sometimes price simply returns to the broken higher low or lower high and uses it as support or resistance. Other times, price fills what traders call a fair value gap (fvg), which is an imbalance left on the chart when price moves too quickly in one direction without much trading in between. By waiting for this retest, a trader enters at a better price, with a tighter stop loss and greater profit potential.
Example
For example, imagine the market in an uptrend. Price respects a rising trendline until it finally breaks through it. Shortly after, the market breaks below the most recent higher low, confirming the bearish trendbreak. Instead of selling right at the break, the disciplined trader waits. Price pulls back upward to retest the broken higher low, which now acts as resistance. At that moment, the trader sells with a stop loss just above the retest level and targets the next support or previous swing low. This provides a controlled risk and larger potential reward.
The same logic applies to a bullish trendbreak. Price in a downtrend breaks above the falling trendline, then pushes higher to break a lower high, flipping the structure bullish. Price later dips back down to retest the broken lower high or fills a fair value gap. When it holds and begins to rise again, the trader enters long, with a stop below the retest and a target at the next resistance level.
By combining awareness of trendlines, structural shifts, and retest opportunities, traders can filter out false signals and position themselves to catch the early stages of new trends. The trendbreak is not just about spotting the first sign of weakness or strength, but about confirming that the underlying structure has truly changed. This approach gives a trader clarity, consistency, and confidence in execution, making trendbreaks one of the most powerful tools for price action trading.
-------------------------
Disclosure: I am part of Trade Nation's Influencer program and receive a monthly fee for using their TradingView charts in my analysis.
Thanks for your support. If you enjoyed this analysis, make sure to follow me so you don't miss the next one. And if you found it helpful, feel free to drop a like 👍 and leave a comment 💬, I’d love to hear your thoughts!
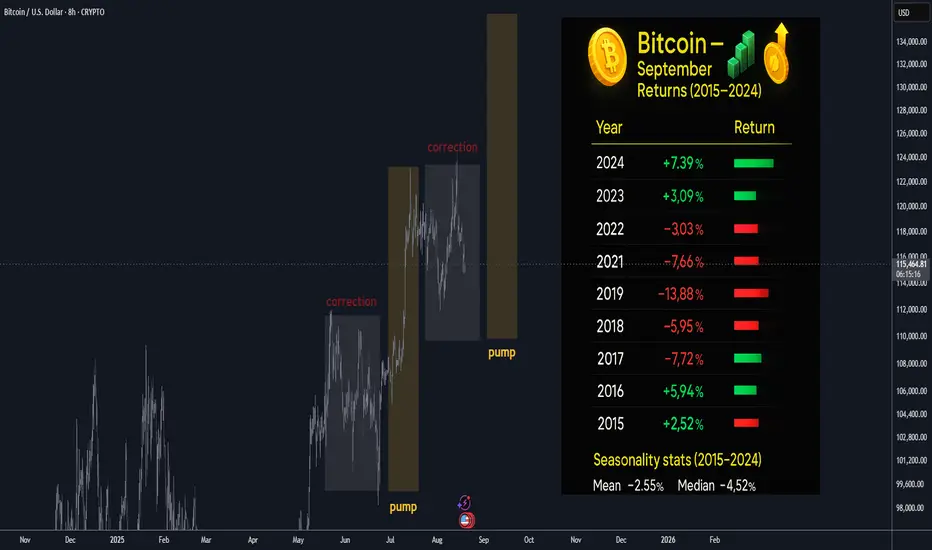
Bitcoin September Seasonality: Correction in progress 100/110K Bitcoin is heading into September after recently printing a new ATH,
historically September is a red month, so expecting further mild losses
heading into September and limited upside, however, once the pattern
and correction is complete, we should see another bull run and mark up.
📊 Bitcoin September Seasonality (Last 10 Years: 2015–2024)
Yearly September Returns
Year 📈 Return
2024 🟢 +7.39%
2023 🟢 +3.99%
2022 🔴 −3.09%
2021 🔴 −7.03%
2020 🔴 −7.66%
2019 🔴 −13.88%
2018 🔴 −5.95%
2017 🔴 −7.72%
2016 🟢 +5.94%
2015 🟢 +2.52%
📌 At-a-glance stats (2015–2024)
📉 Mean (10-yr): −2.55%
⚖️ Median: −4.52%
🔴 Red months: 6 out of 10
❌ Worst September: 2019 (−13.88%)
✅ Best September: 2024 (+7.39%)
📅 Recent Performance (last 3 years)
2024: 🟢 +7.39% → Strongest September in a decade
2023: 🟢 +3.99% → Rare green month, breaking the red-seasonality myth
2022: 🔴 −3.09% → Modest dip during a bearish macro cycle
➡️ Average of last 3 years: 🟢 +2.8%
➡️ Average of last 5 years (2020–2024): 🔴 −1.3%
🔎 Key Insights
September Slump : Historically, September is known as a "red month" for Bitcoin, often averaging −4% to −6% declines. Over the last decade, the median return (−4.5%) aligns with this bearish narrative.
Volatility Factor: The spread between best (+7.39% in 2024) and worst (−13.88% in 2019) September is 21 percentage points, underlining Bitcoin’s volatility even within seasonal patterns.
Changing Trend? The last two years (2023 & 2024) both closed green — suggesting the September slump might be losing strength in the current cycle.
🚀 Macro & Market Context
2019–2020: Heavy red Septembers coincided with global macro uncertainty (trade wars, COVID jitters).
2021: Correction phase post-$64k BTC ATH saw September hit −7%.
2022: Ongoing bear market after Terra/LUNA & 3AC collapses kept September negative.
2023–2024: Renewed momentum, institutional inflows, and ETF speculation helped reverse September’s red streak.
🧭 Takeaway
While September has historically been Bitcoin’s weakest month, the last two years show signs of reversal. The broader trend reminds us that seasonality is a tendency, not a guarantee — macro cycles and catalysts often override calendar effects.
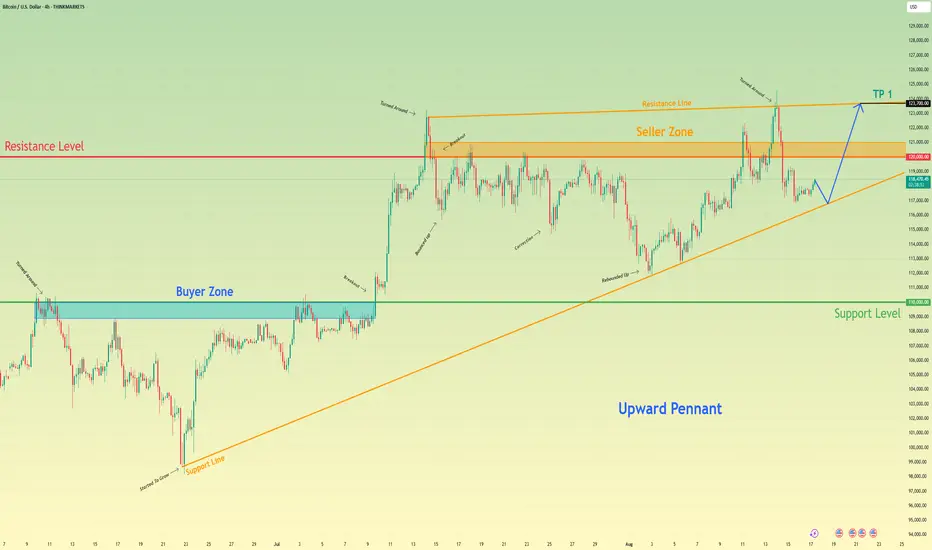
Bitcoin may bounce up of support line and break resistance levelHello traders, I want share with you my opinion about Bitcoin. Following a powerful upward trend and a significant breakout, bitcoin has established a new and higher territory for its price action, leading into the current phase of extensive consolidation. This consolidation has taken the form of a large upward pennant, a classic pattern of contracting volatility where the price is being squeezed between a descending resistance line and an ascending support line. The market has been rotating within these boundaries, with the seller zone around the 120000 resistance level capping rallies and the dynamic support line providing a floor for pullbacks. Currently, the asset is positioned at a critical juncture, testing the ascending support line of this multi-week formation after a corrective move down. The primary working hypothesis is a long scenario, based on the expectation of a successful upward rebound from this dynamic support. A confirmed bounce would validate the integrity of the pennant and suggest that another full rotation to the upside is the most probable path. This move would first challenge the horizontal resistance at 120000. Therefore, the ultimate TP for this rotational play is logically set at the 123700 level, as this precisely targets the upper resistance line of the pennant, representing the completion of the swing and a key decision point for a potential future breakout. Please share this idea with your friends and click Boost 🚀
Disclaimer: As part of ThinkMarkets’ Influencer Program, I am sponsored to share and publish their charts in my analysis.
BITCOIN Are the 0.5 Fib and 1D MA100 coming to the rescue?Bitcoin (BTCUSD) has been trading within a Channel Up pattern for exactly the past 4 months (since April 22) and the recent correction off its All Time High (ATH) has broken below the 1D MA50 (blue trend-line) for the first time since July 02 and is about to test the 1D MA100 (green trend-line).
The 1D MA100 has been intact since the day the Channel Up started so it is on its own a strong Support. It gets stronger though, considering that this is where the 0.5 Fibonacci retracement level is from its ATH, which is exactly where BTC rebounded (and priced the previous Higher Low) on June 22.
As you can see, there is a very high degree of symmetry among the Bullish and Bearish Legs of the Channel Up and the 0.5 Fib is -11.09% from the recent High, which is again the % correction of BTC's last Bearish Leg.
Notice also the similarities between the Bearish Legs' fractals, being on Lower Highs and Lower Lows. A new Lower Low now, would potentially signal the bottom.
As far as the next Bullish Leg is concerned, based on the previous one, we can expect a rise to the 1.5 Fibonacci extension, which is at $140000.
Do you think history will be repeated once more? Feel free to let us know in the comments section below!
-------------------------------------------------------------------------------
** Please LIKE 👍, FOLLOW ✅, SHARE 🙌 and COMMENT ✍ if you enjoy this idea! Also share your ideas and charts in the comments section below! This is best way to keep it relevant, support us, keep the content here free and allow the idea to reach as many people as possible. **
-------------------------------------------------------------------------------
💸💸💸💸💸💸
👇 👇 👇 👇 👇 👇

Bitcoin will bounce from buyer zone and start to growHello traders, I want share with you my opinion about Bitcoin. The broader market context for Bitcoin has been one of prolonged and volatile consolidation, with price action largely contained between two dominant control zones: a major seller zone capping rallies near 120000 and a foundational buyer zone providing strong support around 112000. After the most recent rejection from the upper boundary, the asset has undergone a significant downward correction, which has taken the shape of a smaller descending triangle. Currently, the price has reached a critical inflection point, as it is testing the apex of this triangle directly at the major horizontal support level of 112000. The primary working hypothesis is a long scenario, which anticipates that the strong historical demand within the buyer zone will absorb the recent selling pressure and initiate a powerful rebound. This rebound is expected to be strong enough to cause a breakout from the descending triangle, signaling a shift in short-term momentum. The scenario further anticipates a brief retest of the broken triangle's resistance line from above to confirm it as new support. Following a successful retest, the path would be clear for a continued rally. Therefore, the tp for this move is logically placed at the 117000 level. Please share this idea with your friends and click Boost 🚀
Disclaimer: As part of ThinkMarkets’ Influencer Program, I am sponsored to share and publish their charts in my analysis.

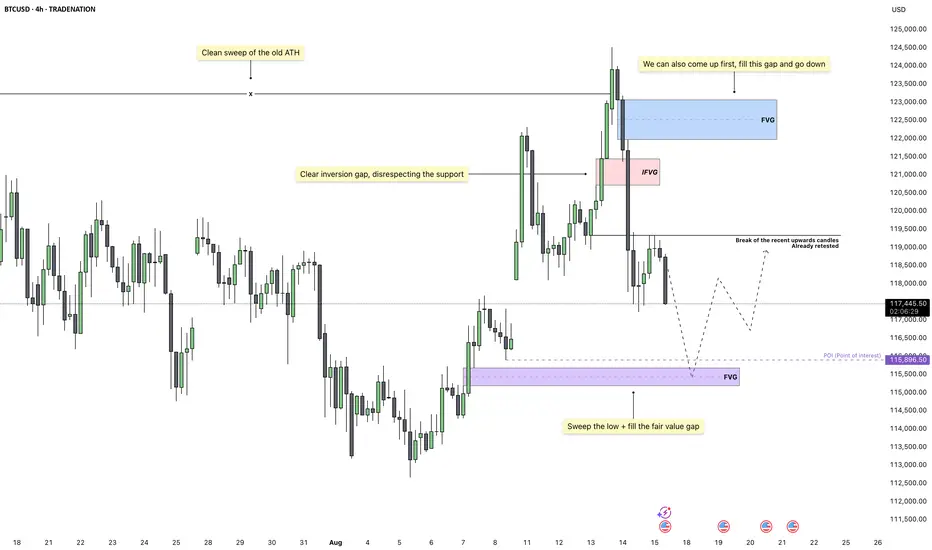
Bitcoin – Momentum Turns Bearish After Topside SweepBitcoin has just completed a clean sweep of the old all-time high, which served as a major liquidity grab. This move has cleared out buy-side liquidity at the very top, creating the perfect environment for a shift in momentum. Price action shows a clear rejection after the sweep, suggesting that the market may now be poised to reach for sell-side liquidity.
Inversion Structure and CISD
On the 4H timeframe, we have a well-defined inversion fair value gap forming immediately after the high was taken. This aligns with the CISD concept, as the liquidity sweep at the top acted as inducement before a sharp displacement to the downside. The CISD level has already been retested, confirming the shift in structure and reducing the likelihood of another deep revisit before the next leg down.
Bearish Pathway
From here, price could either continue to slide directly or first pull back into a nearby imbalance before continuing lower. Both scenarios favor the downside, as the order flow remains bearish after the displacement. A further push down is likely to aim for sell-side liquidity resting below the recent swing low.
Key Downside Objective
The primary target sits at the confluence of a marked liquidity pool and a lower fair value gap. This is a high-probability area for price to react, as it combines the sweep of the recent low with a fill of unmitigated inefficiency. Once that zone is reached, we can reassess for potential reversals or continuation patterns.
Expectation
The market has already shown its intent by taking the highest liquidity first, shifting structure, and respecting the CISD framework. Unless the upside imbalance is filled in a deeper retrace, the path of least resistance remains lower toward the highlighted fair value gap.
Conclusion
With liquidity above already cleared and the CISD retested, the focus now shifts to the liquidity resting below. The alignment between structure, inefficiency, and liquidity targets supports a bearish continuation into the marked zone before any meaningful bounce.
Disclosure: I am part of Trade Nation's Influencer program and receive a monthly fee for using their TradingView charts in my analysis.
___________________________________
Thanks for your support!
If you found this idea helpful or learned something new, drop a like 👍 and leave a comment, I’d love to hear your thoughts! 🚀
Bitcoin will bounce up from wedge to 117K pointsHello traders, I want share with you my opinion about Bitcoin. The recent price action for Bitcoin has been complex, marked by a significant breakout from a prior downward channel that failed to produce a sustained trend, leading instead to the current corrective structure. This new market phase has taken the form of a large downward wedge, a pattern of contracting volatility that often resolves to the upside. The price has been making a series of lower highs and lower lows within this wedge, with the major buyer zone around the 113000 support level acting as a foundational floor. Currently, the price is in the final stages of this consolidation, making another descent towards the apex of the wedge. The primary working hypothesis is a long scenario, based on a potential 'fake breakdown' or liquidity grab below the established support. It is anticipated that the price may briefly dip below the 113000 support level to trap sellers before staging a sharp reversal. A swift reclaim of this level would be the ultimate confirmation of the bullish thesis, validating the wedge as an accumulation pattern and likely triggering a powerful breakout to the upside. Therefore, the TP for this reversal scenario is logically set at 117000 points. Please share this idea with your friends and click Boost 🚀
Disclaimer: As part of ThinkMarkets’ Influencer Program, I am sponsored to share and publish their charts in my analysis.

Do you think I'm joking ???As I said, Bitcoin broke the triangle, and now with a slight price correction(109k), it could surge to $150k , and you still think I'm joking!!
Previous analysis

Bitcoin I Weekly Range - Down to $107 000Bitcoin has created weekly range which has ben falsely broken up. Which has triggered buy stops.
There is also historical highest leverage longs which must be liquidated.
Liquidations will be bellow the weekly range hence 107K is in play.
Im not selling my spot position (ever) but Im already in short.
Whats your view guys?
Good luck
David Perk aka Dave FX Hunter

Bitcoin to 80,937$ within 45 days!How much more specific can I get.
Hey, I'm back, you can probably tell by my writing style after 4 years.
Eventually, bitcoin will go to 32,026$ to find support within the next 1.5 years before bitcoin sees another meteoric ascend to 300,000$

Bitcoin: America’s New Monetary Power Play🇺🇸🧠 Bitcoin: America’s New Monetary Power Play 💥📈
Today, Jerome Powell showed his hand — and it wasn’t a rug pull (yes, we were worried).
While many feared the Fed would stall Bitcoin’s momentum, Powell flipped the switch to “Support Mode” 🟢 right at the key technical level.
And let’s not forget: Trump has been quietly supportive all along .
From his early hints to broader pro-Bitcoin policies, the message is getting louder:
Bitcoin is aligning with American power.
📊 On the chart:
BTC has reclaimed the ascending channel and bounced from key support near 116K . The structure is intact, and the next levels in play are:
➡️ 122K test
➡️ 138K–140K zone
Wave 3 in motion — rocket path activated 🚀
But this breakout goes beyond the chart.
Why Bitcoin is Great for America 🇺🇸:
🛡️ 1. Fiscal Firepower Through Reserve Revaluation
The Fed already hinted at the power of marking reserves to market. Bitcoin, like gold, can unlock fiscal liquidity — without printing or taxing.
Volatility = Fiscal Ammunition.
🌐 2. It’s Already the Rails
Stablecoins are useful. But when they move globally, they do so via Bitcoin’s Lightning Network .
Bitcoin is becoming America’s invisible monetary infrastructure.
📉 3. Digital Gold in a Multipolar World
While rivals hoard gold, America integrates Bitcoin — programmable, neutral, unstoppable.
The dollar doesn’t have to die for Bitcoin to win.
Together, they can extend U.S. influence deeper into the 21st century.
⚡ 4. Real Yield, Protocol-Native
The Lightning node by C= now earns 9.7% APR in Bitcoin — non-custodial, no tokens, no middlemen.
That’s monetary throughput , not speculation.
🔧 5. Built With American DNA
From open-source roots to decentralized ideals — Bitcoin was born from American innovation.
This is not foreign tech. It’s digital sovereignty, made in the USA.
The Big Picture 🧭
Trump's symbolic backing and Powell's real-time support are not coincidences.
BTC isn’t just breaking out — it’s becoming the financial backbone of the next American era.
📈 Target zones :
122K retest in progress
138K–140K = technical extension of Wave 3 🚀
This is not just a rally.
It’s a realignment. And Bitcoin is wearing red, white, and blue. 🇺🇸✨
One Love,
The FXPROFESSOR 💙
Disclosure: I am happy to be part of the Trade Nation's Influencer program and receive a monthly fee for using their TradingView charts in my analysis. Awesome broker, where the trader really comes first! 🌟🤝📈

Leverage in Crypto: The Sexy Lie vs. The Boring TruthLet’s be honest: the vast majority of crypto traders don’t come with a trading background. Not in stocks, not in futures, and definitely not in leveraged Forex.
Most enter crypto because of hype, the dream of fast money, and stories of overnight millionaires.
That’s why leverage in crypto is so dangerous. It’s not just a tool — it’s a trap for the unprepared.
________________________________________
What leverage really means
To keep it simple: with 100× leverage, every 1% move in your favor doubles your account, but every 1% move against you wipes it out completely.
👉 No matter the asset — Forex, Gold, Bitcoin, or meme coins — at 100× leverage you only have 1% room to be wrong.
________________________________________
Yesterday’s market moves – a perfect example
Yesterday, markets exploded across all asset classes:
• EURUSD → +1%
• Gold (XAUUSD) → +1.5%
• Bitcoin (BTC) → +4%
• Ethereum (ETH) → +8%
• PEPE, other coins and meme coins → +10%+
Now imagine trading them with 100× leverage, catching the bottom and selling at the top:
• EURUSD → +100% (account doubled)
• Gold → +150%
• BTC → +400%
• ETH → +800%
• PEPE → +1000%
Sounds incredible, right?
But here’s the other side: with 100× leverage, a –1% move against you = instant liquidation.
________________________________________
Effective Leverage – The Hidden Concept
Effective leverage — you rarely see it explained. Why?
Because it’s not sexy, not marketable, and most of all… exchanges and brokers don’t want this to be very clear.
Nominal leverage (the 50×, 100×, 200× banners you see everywhere) sells dreams. Effective leverage, on the other hand, shows the brutal reality: how much exposure you actually control compared to your account size.
Formula:
Effective Leverage=Position Size/Account Equity
• Example 1 (Forex): $1,000 account, $5,000 EURUSD position = 5× effective leverage.
• Example 2 (Crypto): $100,000 account, BTC at $100k, controlling 5 BTC ($500,000 position) = 5× effective leverage.
👉 Nominal leverage is the ad. Effective leverage is the invoice.
And once you understand it, the marketing magic disappears.
________________________________________
A concrete example – Solana trade
Let’s take a real setup I shared recently on Solana:
• Entry: buy at $200
• Stop Loss: $185 → risk on the asset = -7.5%
Case 1 – 100× leverage
From 200 → 198 (–1%), you’re liquidated. You never reach your stop at 185.
Case 2 – 10× effective leverage
Every 1% move = 10% account swing. You could survive down to 180, but you’d be under constant stress.
Case 3 – 2× effective leverage (my choice)
Let’s say you control $2,000 worth of SOL, effectively $4,000 exposure.
• If Solana falls to 185 (–7.5%), that’s a –15% hit to your account. Painful, but survivable.
• If Solana rises to 250 (+25%), with 2× leverage you make +50% on allocated capital.
• Risk–reward ratio: ~1:3.3 — sustainable, worth taking.
________________________________________
The psychological factor
This is where leverage breaks most traders.
• With 100× leverage, every 0.2% fluctuation moves your account by 20% (≈ $400 on a $2,000 account). Every 1% move = liquidation. How do you stay calm? You don’t.
• With 2× effective leverage, a 1% fluctuation only moves your account 2% (≈ $40). Boring? Maybe. Survivable? Absolutely.
Now imagine: you enter SOL at 200 with 100× leverage.
• At 202, you’ve doubled your account.
• At 210, you’ve made 5×.
But will you hold? No. Because:
1. If you’re awake, the stress of watching wild swings (in money, not in price) forces you to close early.
2. If you do hold, it’s usually because you were asleep — or the move happened in a single violent candle.
Markets never move in a straight line. They go 200 → 202 → 201 → 203 → 201 → 205…
At 100× leverage, every retracement feels like life or death. At 2× leverage, it’s just noise.
________________________________________
Conclusion
Leverage isn’t evil. It’s just a tool. But in crypto, with insane volatility and inexperienced traders, it becomes a weapon of mass destruction.
• At 100×, you’re gambling on the next 1% very small move.
• At 10×, you’re constantly stressed and one bad move away from ruin.
• At 2×–5× effective leverage, you can actually follow your plan, respect your stop, and let your targets play out.
Trading isn’t about adrenaline. It’s about survival.
High leverage destroys accounts — and discipline. Small, controlled leverage gives you the one thing you need most in trading: time.
P.S.
Of course, the choice is yours — what leverage you decide to use, whether you take into consideration the concept of effective leverage, or how you handle the psychological impact of high leverage.
But at least now, you know. 🙂

BTC/USD Bearish Outlook: Key Levels to WatchHello everyone, what do you think about the trend of BITSTAMP:BTCUSD ? Here’s my bearish idea.
BTC/USD is currently under significant selling pressure due to a combination of technical factors, psychological resistance, and market news. Recently, BTC/USD has faced substantial selling pressure after reaching a new all-time high (ATH). As the chart shows, the price has struggled to maintain upward momentum and is now in a clear downtrend. The price is adjusting, testing key support levels, and is likely heading toward intermediate support at 110,000 USD, followed by 106,000 USD. Fibonacci projections also suggest this.
The Federal Reserve's tightening policy, global economic uncertainty, and regulatory concerns, such as government scrutiny over Bitcoin’s environmental impact and calls for tighter crypto regulations in multiple countries, are contributing to the market instability and risk-averse sentiment among investors.
In my personal assessment, Bitcoin is under pressure and may test deeper support levels. In the short term, I expect a correction, but of course, I can’t be certain about the long-term outlook! :D
So, feel free to share your thoughts on BITSTAMP:BTCUSD – I’d love to know what you think!
Good luck!

BTC/USD 15M | Equal Highs Liquidity Trap SetupPrice is consolidating below Equal Highs (117,904) with multiple swing lows building liquidity. Two scenarios are in play:
1️⃣ Liquidity Grab & Pump → Sweep equal highs, target 118,409 strong high zone for continuation.
2️⃣ Rejection Scenario → Failure to break equal highs → liquidity flush below 117,634 swing low toward 117,300 rejection block.
Key Levels:
Equal Highs: 117,904
Strong High: 118,409
Swing Low Support: 117,634
Rejection Block: 117,300
P1D Low/Equal Lows: 116,993

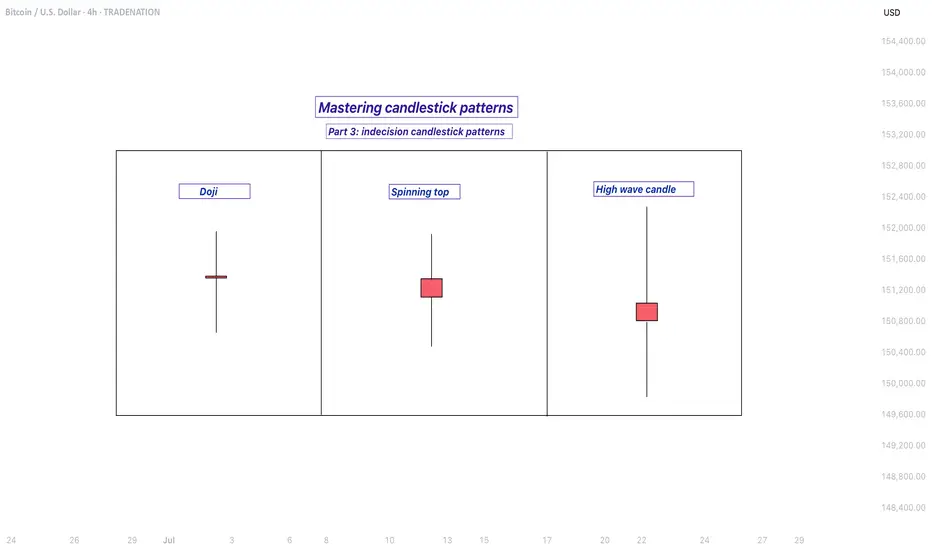
Mastering indecision candlestick patterns - How to use it!In this guide I will explain the indecision candlestick patterns. The next subjects will be discussed:
- What are indecision candlestick patterns?
- What is the doji?
- What is the spinning top?
- What is the high wave candle?
What are indecision candlestick patterns?
Indecision candlestick patterns are formations on a price chart that suggest uncertainty in the market. They appear when neither buyers nor sellers have full control, meaning the price moves up and down during the trading period but closes near where it opened. This creates a candle with a small real body and often long wicks on either side, showing that the market explored both higher and lower prices but ended up not committing strongly in either direction. These patterns are often seen during periods when traders are waiting for more information before making bigger moves.
What is the doji?
One of the most well-known indecision candles is the doji. A doji forms when the opening price and the closing price are almost identical, resulting in a very thin body. The wicks, which show the highest and lowest prices of the period, can be long or short depending on market activity. A doji tells us that buying and selling pressure were almost equal, which can happen during pauses in trends or before major reversals.
What is the spinning top?
Another type is the spinning top. A spinning top also has a small body, but unlike the doji, the open and close are not exactly the same. The wicks on both sides are typically of similar length, indicating that the market moved both up and down significantly before settling close to the starting point. This pattern reflects hesitation and a balanced struggle between bulls and bears.
What is the high wave candle?
The high wave candle is a more dramatic version of indecision. It has a small real body like the other patterns but features very long upper and lower shadows. This means the market swung widely in both directions during the period, but ultimately closed without making strong progress either way. The high wave candle signals strong volatility paired with uncertainty, which can often precede sharp moves once the market chooses a direction.
When you see these types of candles, they are essentially the market saying “I’m not sure yet.” They often appear at turning points or before big news events and can warn that the current trend may be losing strength. However, they are not guarantees of reversal or continuation on their own. Traders usually combine them with other technical signals or chart patterns to confirm whether the market will break out in one direction or the other.
-------------------------
Disclosure: I am part of Trade Nation's Influencer program and receive a monthly fee for using their TradingView charts in my analysis.
Thanks for your support. If you enjoyed this analysis, make sure to follow me so you don't miss the next one. And if you found it helpful, feel free to drop a like 👍 and leave a comment 💬, I’d love to hear your thoughts!
Bitcoin, Quick Update · Is The Retrace Over?We are looking at Bitcoin and we are tracking Bitcoin's movements but we trade mainly the altcoins. How Bitcoin behaves affects the altcoins market and how the altcoins market behaves reveals what Bitcoin intends to do next. The chart reveals what is happening and what is about to happen.
Bitcoin produced a low of $112,000 2-August. Today Bitcoin produced a low of $112,353. If $112,000 holds as support or remains unchallenged, we can have an early end to the present retrace. Several things to consider:
1) Trading volume is low and this can be considered good. It can happen that the retrace ends or the final flush is still upon us. In both scenarios everything unravels within the next few days. No more than a week.
2) Trading volume was really high on the bearish side late July but so far there is no follow through.
3) Seeing six days red yet only a small retrace is a positive signal. Again, it can happen that the final flush happens today and the market turns. Something to keep in mind; when a flash crash happens, we tend to think of this as the start of a major down-move but normally this is the end. It can happen that Bitcoin moves lower and that's it, it starts to grow again.
4) Seeing how the market lacks bearish pressure—and also how the small altcoins are performing—we are going with the bulls.
5) As long as Bitcoin trades above $110,000, we are bullish long-term. Above $112,000, ultra-bullish including the short-term. When Bitcoin is trading above $100,000, the bullish bias is confirmed. It doesn't matter how you slice it, the bulls have control of this chart. The trading price is the most important data point and right now Bitcoin's price is really strong.
If $112,000 holds, expect Bitcoin to grow.
Namaste.
